Schematic overview of the cellular and molecular mechanisms involved in the cancer progression, including the proposed cellular and molecular mechanisms in cancer cells trajectory. AT1: alveolar type 1 cells; AT2: alveolar type 2 cells; AAH: atypical adenomatous hyperplasia; AIS: adenocarcinoma in situ; MIA: minimally invasive adenocarcinoma; IA: invasive adenocarcinoma; EMT: epithelial-mesenchymal transition

Home

Download

Statistics

Help

Contact

Center for Computational Systems Medicine
leaf

Gene summary

leaf

Malignant transformation analysis

leaf

Malignant transformation related pathway analysis

leaf

Cell-cell communication analysis

leaf

Single-cell gene regulatory network inference analysis

leaf

Somatic mutation of malignant transformation related genes

leaf

Related drugs of malignant transformation related genes

Gene: PTCD3

Gene summary for PTCD3

check button Gene summary.

Gene informationSpeciesHuman
Gene symbol

PTCD3

Gene ID

55037

Gene namepentatricopeptide repeat domain 3
Gene AliasCOXPD51
Cytomap2p11.2
Gene Typeprotein-coding
GO ID

GO:0006412

UniProtAcc

Q96EY7


Top

Malignant transformation analysis

check button Identification of the aberrant gene expression in precancerous and cancerous lesions by comparing the gene expression of stem-like cells in diseased tissues with normal stem cells
check button Malignant transformation involving gene list.
Entrez IDSymbolReplicatesSpeciesOrganTissueAdj P-valueLog2FCMalignancy
55037PTCD3LZE4THumanEsophagusESCC3.69e-102.15e-010.0811
55037PTCD3LZE7THumanEsophagusESCC1.09e-135.48e-010.0667
55037PTCD3LZE8THumanEsophagusESCC9.82e-057.33e-020.067
55037PTCD3LZE20THumanEsophagusESCC4.10e-021.23e-010.0662
55037PTCD3LZE24THumanEsophagusESCC4.02e-092.77e-010.0596
55037PTCD3LZE21THumanEsophagusESCC2.18e-044.09e-010.0655
55037PTCD3LZE6THumanEsophagusESCC6.60e-061.13e-010.0845
55037PTCD3P1T-EHumanEsophagusESCC3.91e-053.25e-010.0875
55037PTCD3P2T-EHumanEsophagusESCC1.67e-285.17e-010.1177
55037PTCD3P4T-EHumanEsophagusESCC1.18e-215.67e-010.1323
55037PTCD3P5T-EHumanEsophagusESCC8.41e-162.13e-010.1327
55037PTCD3P8T-EHumanEsophagusESCC1.45e-203.31e-010.0889
55037PTCD3P9T-EHumanEsophagusESCC9.68e-122.06e-010.1131
55037PTCD3P10T-EHumanEsophagusESCC1.26e-661.27e+000.116
55037PTCD3P11T-EHumanEsophagusESCC6.65e-113.76e-010.1426
55037PTCD3P12T-EHumanEsophagusESCC9.31e-244.67e-010.1122
55037PTCD3P15T-EHumanEsophagusESCC7.85e-255.87e-010.1149
55037PTCD3P16T-EHumanEsophagusESCC6.06e-315.63e-010.1153
55037PTCD3P17T-EHumanEsophagusESCC1.68e-021.91e-010.1278
55037PTCD3P20T-EHumanEsophagusESCC8.45e-214.70e-010.1124
Page: 1 2 3 4 5 6 

check button Transcriptomic changes along malignancy continuum.
TissueExpression DynamicsAbbreviation
EsophagusThe image shows the transcriptomic changes along malignancy continuum.log2FC in expression of this searched gene in stem-like cells from each diseased tissue sample relative to stem-like cells in normal samples in each tissue plotted against the malignancy continuum. Samples are colored based on if they are from different disease stage.ESCC: Esophageal squamous cell carcinoma
HGIN: High-grade intraepithelial neoplasias
LGIN: Low-grade intraepithelial neoplasias
LiverThe image shows the transcriptomic changes along malignancy continuum.log2FC in expression of this searched gene in stem-like cells from each diseased tissue sample relative to stem-like cells in normal samples in each tissue plotted against the malignancy continuum. Samples are colored based on if they are from different disease stage.
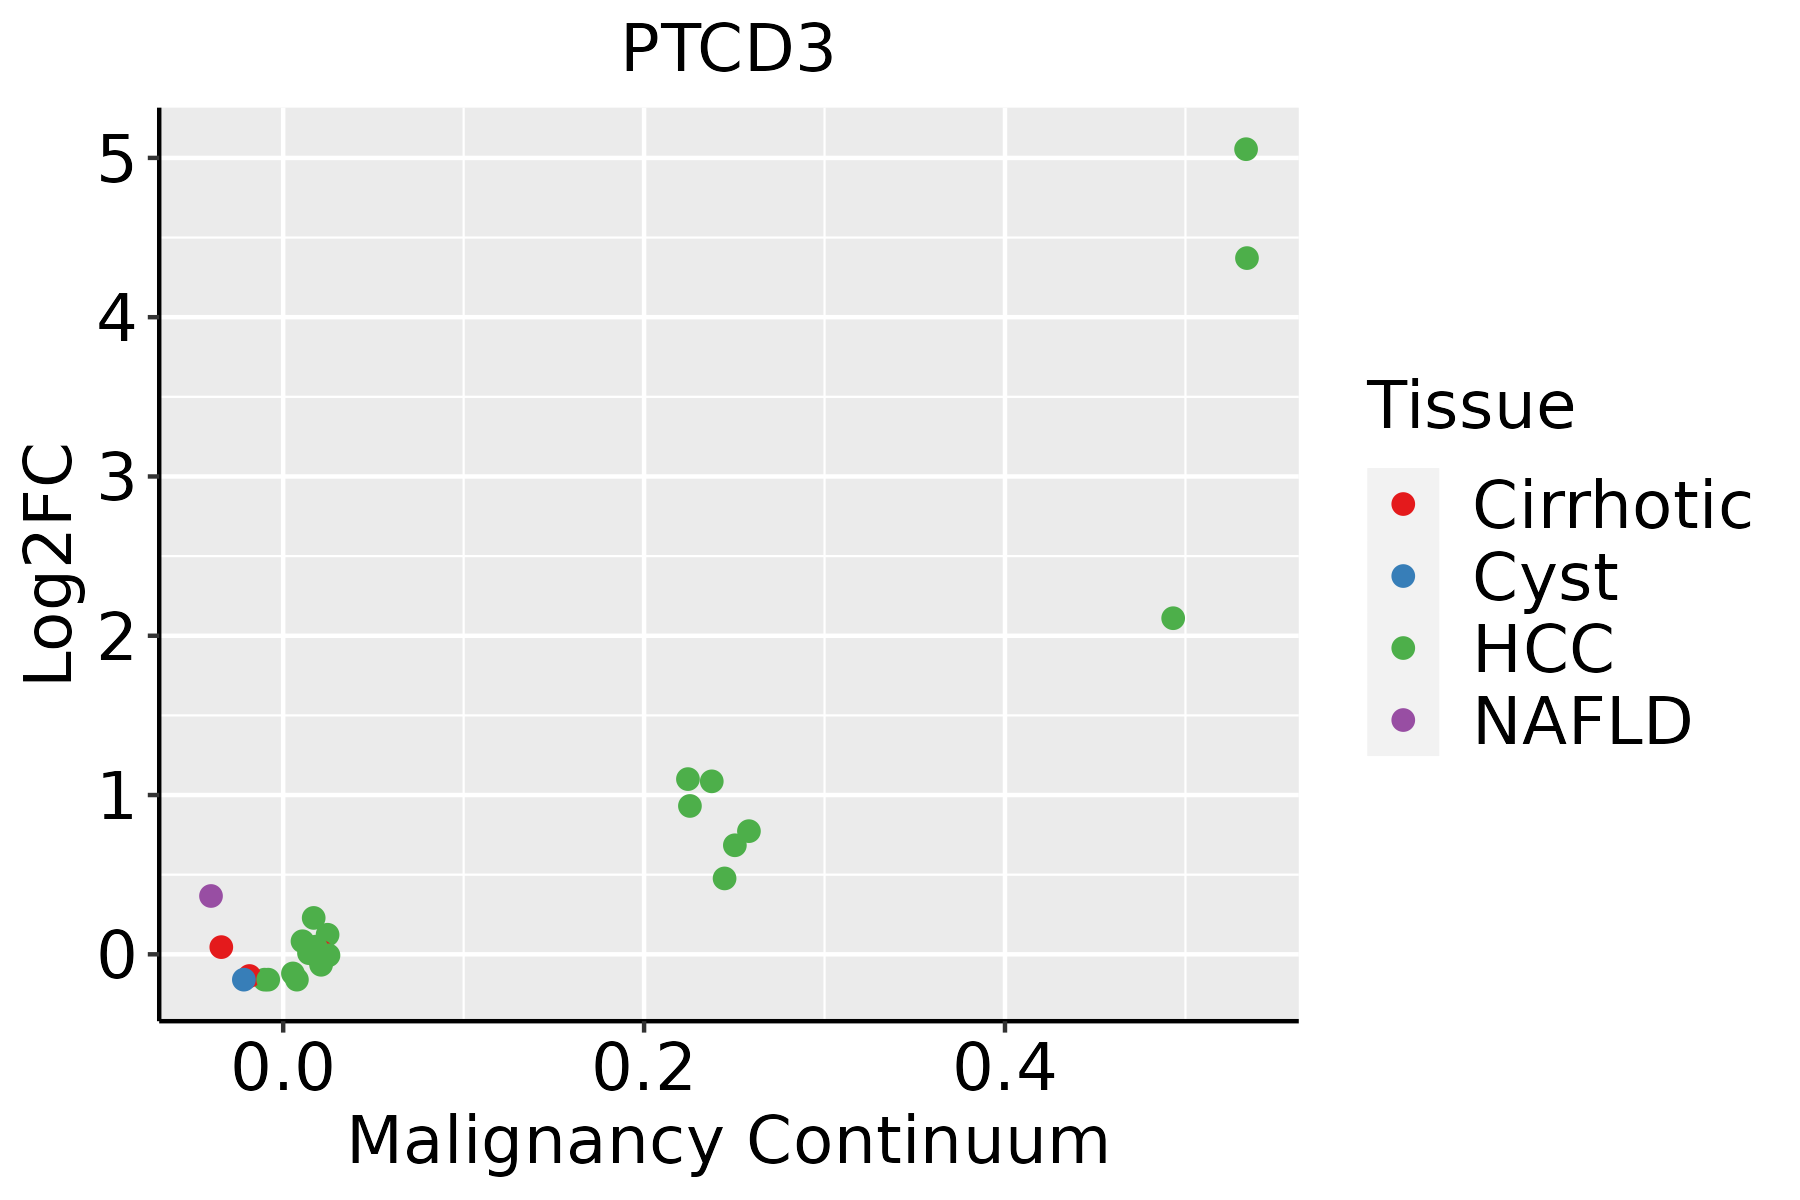
HCC: Hepatocellular carcinoma
NAFLD: Non-alcoholic fatty liver disease
Oral CavityThe image shows the transcriptomic changes along malignancy continuum.log2FC in expression of this searched gene in stem-like cells from each diseased tissue sample relative to stem-like cells in normal samples in each tissue plotted against the malignancy continuum. Samples are colored based on if they are from different disease stage.
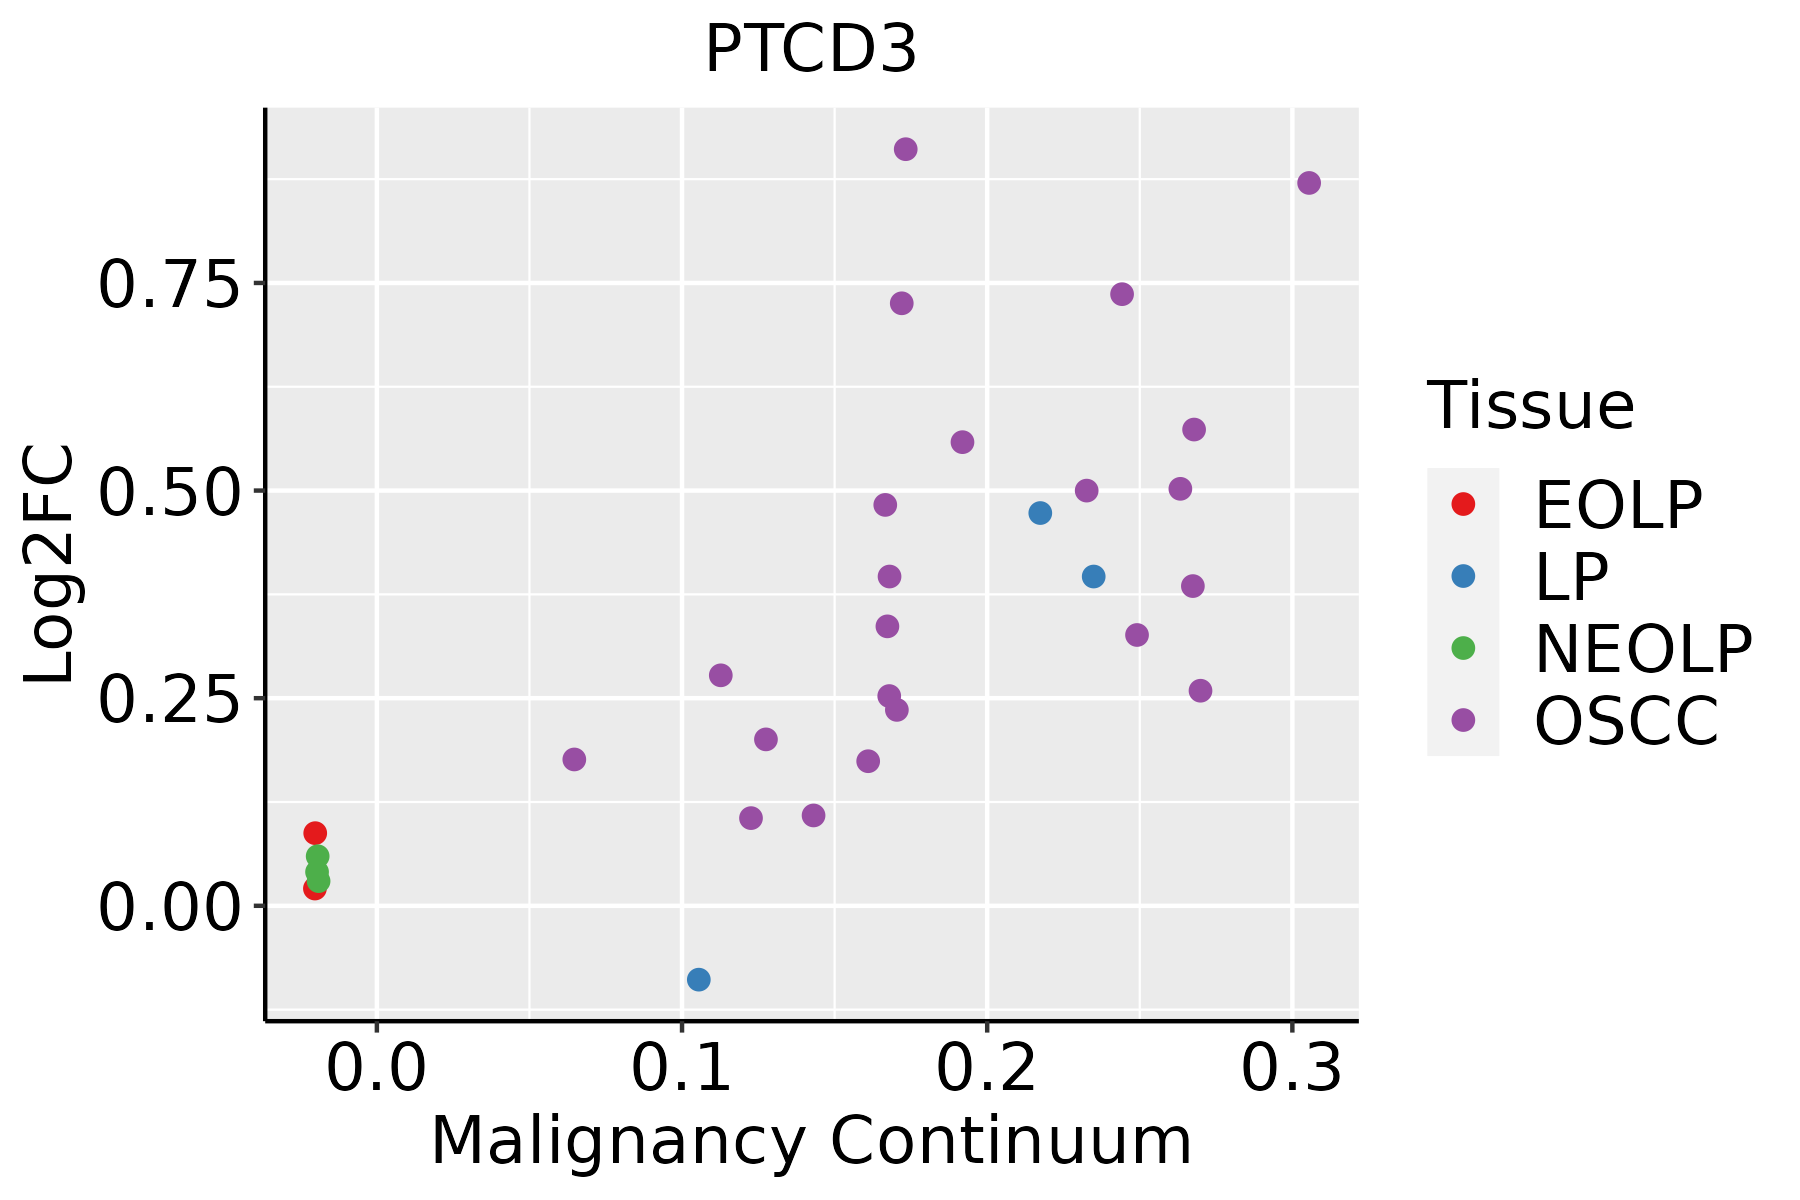
EOLP: Erosive Oral lichen planus
LP: leukoplakia
NEOLP: Non-erosive oral lichen planus
OSCC: Oral squamous cell carcinoma
SkinThe image shows the transcriptomic changes along malignancy continuum.log2FC in expression of this searched gene in stem-like cells from each diseased tissue sample relative to stem-like cells in normal samples in each tissue plotted against the malignancy continuum. Samples are colored based on if they are from different disease stage.
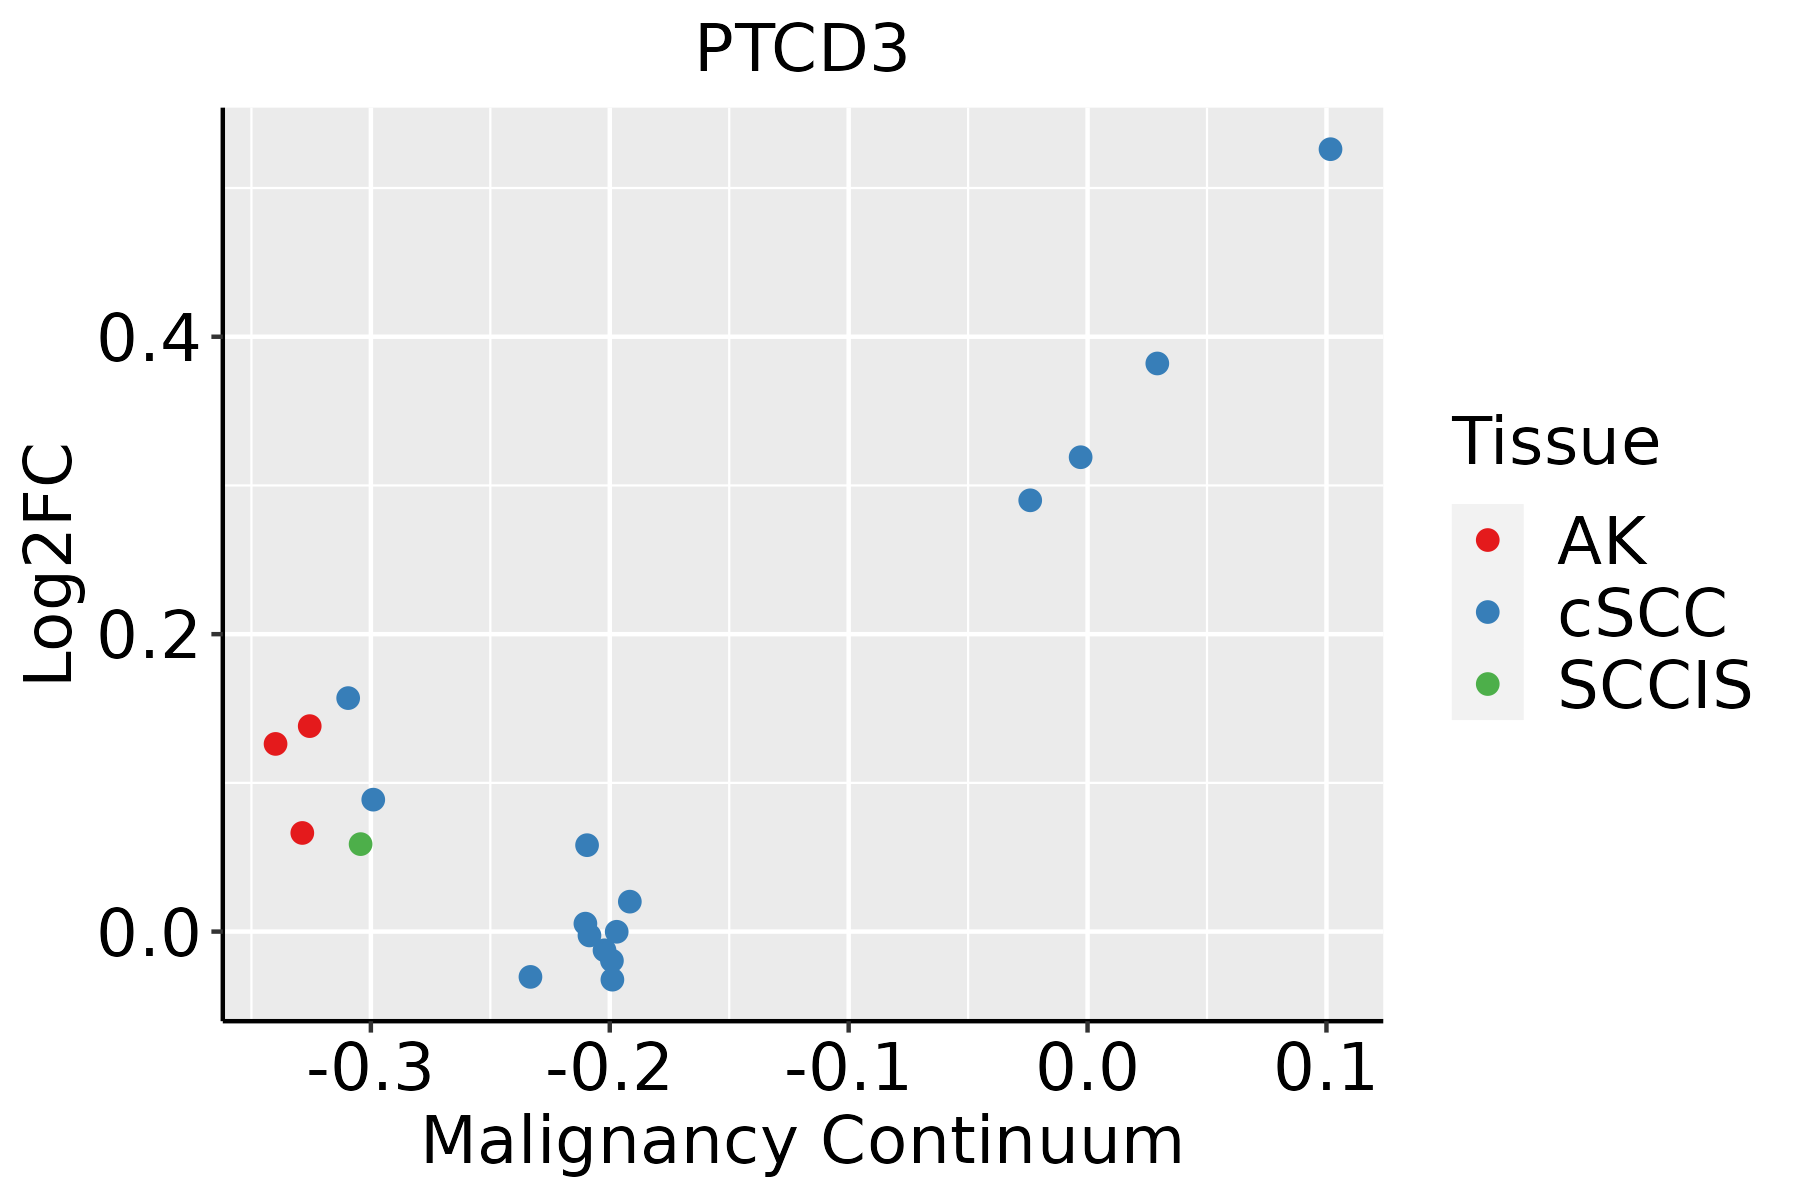
AK: Actinic keratosis
cSCC: Cutaneous squamous cell carcinoma
SCCIS:squamous cell carcinoma in situ
ThyroidThe image shows the transcriptomic changes along malignancy continuum.log2FC in expression of this searched gene in stem-like cells from each diseased tissue sample relative to stem-like cells in normal samples in each tissue plotted against the malignancy continuum. Samples are colored based on if they are from different disease stage.ATC: Anaplastic thyroid cancer
HT: Hashimoto's thyroiditis
PTC: Papillary thyroid cancer
∗log2FC in expression of this searched gene in stem-like cells from each diseased tissue sample relative to stem-like cells in normal samples in each tissue plotted against the malignancy continuum. Samples are colored based on if they are from different disease stage.

Top

Malignant transformation related pathway analysis

check buttonFind out the enriched GO biological processes and KEGG pathways involved in transition from healthy to precancer to cancer
check button Figure of enriched GO biological processes.
TissueDisease StageEnriched GO biological Processes
ColorectumADGO analysis - Figure of enriched GO biological processes: Top 15 enriched GO BP terms are showed in the bar plot of each disease state in each tissue. Each row represents a significant GO biological process which is colored according to the -log10(p.adjust).
ColorectumSERGO analysis - Figure of enriched GO biological processes: Top 15 enriched GO BP terms are showed in the bar plot of each disease state in each tissue. Each row represents a significant GO biological process which is colored according to the -log10(p.adjust).
ColorectumMSSGO analysis - Figure of enriched GO biological processes: Top 15 enriched GO BP terms are showed in the bar plot of each disease state in each tissue. Each row represents a significant GO biological process which is colored according to the -log10(p.adjust).
ColorectumMSI-HGO analysis - Figure of enriched GO biological processes: Top 15 enriched GO BP terms are showed in the bar plot of each disease state in each tissue. Each row represents a significant GO biological process which is colored according to the -log10(p.adjust).
ColorectumFAPGO analysis - Figure of enriched GO biological processes: Top 15 enriched GO BP terms are showed in the bar plot of each disease state in each tissue. Each row represents a significant GO biological process which is colored according to the -log10(p.adjust).
∗Top 15 enriched GO BP terms are showed in the bar plot of each disease state in each tissue. Each row represents a significant GO biological process which is colored according to the -log10(p.adjust).
Page: 1 2 3 4 5 6 7 8 9 

check button Enriched GO biological processes.
GO IDTissueDisease StageDescriptionGene RatioBg Ratiopvaluep.adjustCount
GO:014005313EsophagusESCCmitochondrial gene expression93/8552108/187231.96e-182.03e-1693
GO:0006417111EsophagusESCCregulation of translation304/8552468/187231.53e-171.33e-15304
GO:003254314EsophagusESCCmitochondrial translation68/855276/187231.02e-156.86e-1468
GO:000641712LiverCirrhoticregulation of translation194/4634468/187237.28e-168.79e-14194
GO:0032543LiverCirrhoticmitochondrial translation40/463476/187231.61e-074.29e-0640
GO:0140053LiverCirrhoticmitochondrial gene expression49/4634108/187232.35e-064.31e-0549
GO:000641722LiverHCCregulation of translation287/7958468/187238.79e-178.08e-15287
GO:01400531LiverHCCmitochondrial gene expression82/7958108/187231.49e-127.20e-1182
GO:00325431LiverHCCmitochondrial translation62/795876/187232.95e-121.34e-1062
GO:000641720Oral cavityOSCCregulation of translation274/7305468/187234.39e-184.63e-16274
GO:01400533Oral cavityOSCCmitochondrial gene expression78/7305108/187232.37e-129.86e-1178
GO:00325434Oral cavityOSCCmitochondrial translation59/730576/187237.21e-122.70e-1059
GO:0006417110Oral cavityLPregulation of translation175/4623468/187234.49e-102.22e-08175
GO:003254313Oral cavityLPmitochondrial translation43/462376/187232.85e-091.26e-0743
GO:014005312Oral cavityLPmitochondrial gene expression53/4623108/187233.54e-081.27e-0653
GO:000641729SkincSCCregulation of translation226/4864468/187238.78e-262.62e-23226
GO:00325436SkincSCCmitochondrial translation47/486476/187234.70e-112.22e-0947
GO:01400535SkincSCCmitochondrial gene expression56/4864108/187238.06e-092.56e-0756
GO:0006417113ThyroidPTCregulation of translation236/5968468/187232.70e-172.52e-15236
GO:01400536ThyroidPTCmitochondrial gene expression51/5968108/187236.04e-043.83e-0351
Page: 1 2 

check button Enriched KEGG pathways.
Pathway IDTissueDisease StageDescriptionGene RatioBg Ratiopvaluep.adjustqvalueCount
Page: 1 

Top

Cell-cell communication analysis

check buttonIdentification of potential cell-cell interactions between two cell types and their ligand-receptor pairs for different disease states
LigandReceptorLRpairPathwayTissueDisease Stage
Page: 1 

Top

Single-cell gene regulatory network inference analysis

check buttonFind out the significant the regulons (TFs) and the target genes of each regulon across cell types for different disease states
TFCell TypeTissueDisease StageTarget GeneRSSRegulon Activity
∗The dot plots of a searched regulon are shown for all cell subpopulations in each disease state of each tissue based on the regulon specific score inferred using pySCENIC and by calculating the average expression.
Page: 1 

Top

Somatic mutation of malignant transformation related genes

check buttonAnnotation of somatic variants for genes involved in malignant transformation
Hugo SymbolVariant ClassVariant ClassificationdbSNP RSHGVScHGVSpHGVSp ShortSWISSPROTBIOTYPESIFTPolyPhenTumor Sample BarcodeTissueHistologySexAgeStageTherapy TypesDrugsOutcome
PTCD3SNVMissense_Mutationc.391G>Ap.Asp131Asnp.D131NQ96EY7protein_codingdeleterious(0.05)possibly_damaging(0.471)TCGA-AO-A03R-01Breastbreast invasive carcinomaFemale<65I/IIChemotherapydoxorubicinSD
PTCD3SNVMissense_Mutationnovelc.2050N>Ap.Asp684Asnp.D684NQ96EY7protein_codingtolerated_low_confidence(0.15)benign(0.346)TCGA-B6-A3ZX-01Breastbreast invasive carcinomaFemale<65III/IVChemotherapycyclophosphamidePD
PTCD3SNVMissense_Mutationnovelc.1931N>Ap.Gly644Aspp.G644DQ96EY7protein_codingtolerated(0.55)benign(0.035)TCGA-BH-A0HK-01Breastbreast invasive carcinomaFemale>=65I/IIHormone TherapyarimidexSD
PTCD3insertionNonsense_Mutationnovelc.1846_1847insGTTTGTGAATGGGAACCTTATGCATATTCATGTTTCCp.Asp616GlyfsTer3p.D616Gfs*3Q96EY7protein_codingTCGA-A8-A09C-01Breastbreast invasive carcinomaFemale>=65I/IIUnknownUnknownSD
PTCD3insertionNonsense_Mutationnovelc.1961_1962insTACAGTATAGTTp.Ala654_Ile655insThrValTerLeup.A654_I655insTV*LQ96EY7protein_codingTCGA-AN-A03X-01Breastbreast invasive carcinomaFemale>=65I/IIUnknownUnknownSD
PTCD3insertionNonsense_Mutationnovelc.1932_1933insATTGAATAGATCATCATGAAGTCATACTGAATGAATGTTGATAATp.Gly644_Leu645insIleGluTerIleIleMetLysSerTyrTerMetAsnValAspAsnp.G644_L645insIE*IIMKSY*MNVDNQ96EY7protein_codingTCGA-BH-A0HK-01Breastbreast invasive carcinomaFemale>=65I/IIHormone TherapyarimidexSD
PTCD3insertionFrame_Shift_Insnovelc.1248dupTp.Gln417SerfsTer35p.Q417Sfs*35Q96EY7protein_codingTCGA-D8-A27G-01Breastbreast invasive carcinomaFemale>=65I/IIUnknownUnknownSD
PTCD3insertionIn_Frame_Insrs749173570c.30_31insGGCCTCCGCAGCAGGCTTp.Leu12_Gly17dupp.L12_G17dupQ96EY7protein_codingTCGA-Z7-A8R5-01Breastbreast invasive carcinomaFemale<65III/IVChemotherapyadriamycinPD
PTCD3SNVMissense_Mutationnovelc.1543G>Tp.Asp515Tyrp.D515YQ96EY7protein_codingdeleterious(0)probably_damaging(1)TCGA-2W-A8YY-01Cervixcervical & endocervical cancerFemale<65I/IIChemotherapycisplatinCR
PTCD3SNVMissense_Mutationrs778632544c.1387G>Ap.Asp463Asnp.D463NQ96EY7protein_codingtolerated(0.88)benign(0)TCGA-AA-3977-01Colorectumcolon adenocarcinomaMale>=65I/IIUnknownUnknownSD
Page: 1 2 3 4 5 6 7 

Top

Related drugs of malignant transformation related genes

check buttonIdentification of chemicals and drugs interact with genes involved in malignant transfromation
(DGIdb 4.0)
Entrez IDSymbolCategoryInteraction TypesDrug Claim NameDrug NamePMIDs
Page: 1