
|
|||||
|
 | |
| |
| |
| |
| |
| |
|
Gene: PTCD1 |
Gene summary for PTCD1 |
| Gene information | Species | Human | Gene symbol | PTCD1 | Gene ID | 26024 |
| Gene name | pentatricopeptide repeat domain 1 | |
| Gene Alias | PTCD1 | |
| Cytomap | 7q22.1 | |
| Gene Type | protein-coding | GO ID | GO:0006139 | UniProtAcc | A4D273 |
Top |
Malignant transformation analysis |
| Identification of the aberrant gene expression in precancerous and cancerous lesions by comparing the gene expression of stem-like cells in diseased tissues with normal stem cells |
| Entrez ID | Symbol | Replicates | Species | Organ | Tissue | Adj P-value | Log2FC | Malignancy |
| 26024 | PTCD1 | LZE20T | Human | Esophagus | ESCC | 1.38e-02 | 1.02e-01 | 0.0662 |
| 26024 | PTCD1 | LZE24T | Human | Esophagus | ESCC | 4.09e-04 | 1.21e-01 | 0.0596 |
| 26024 | PTCD1 | P1T-E | Human | Esophagus | ESCC | 4.79e-03 | 1.94e-01 | 0.0875 |
| 26024 | PTCD1 | P2T-E | Human | Esophagus | ESCC | 1.19e-09 | 1.69e-01 | 0.1177 |
| 26024 | PTCD1 | P4T-E | Human | Esophagus | ESCC | 6.28e-09 | 1.88e-01 | 0.1323 |
| 26024 | PTCD1 | P5T-E | Human | Esophagus | ESCC | 1.91e-02 | 7.53e-02 | 0.1327 |
| 26024 | PTCD1 | P10T-E | Human | Esophagus | ESCC | 2.31e-10 | 1.06e-01 | 0.116 |
| 26024 | PTCD1 | P11T-E | Human | Esophagus | ESCC | 3.78e-03 | 1.34e-01 | 0.1426 |
| 26024 | PTCD1 | P12T-E | Human | Esophagus | ESCC | 3.74e-19 | 3.14e-01 | 0.1122 |
| 26024 | PTCD1 | P15T-E | Human | Esophagus | ESCC | 3.31e-13 | 3.33e-01 | 0.1149 |
| 26024 | PTCD1 | P16T-E | Human | Esophagus | ESCC | 5.28e-13 | 2.32e-01 | 0.1153 |
| 26024 | PTCD1 | P17T-E | Human | Esophagus | ESCC | 8.63e-04 | 2.25e-01 | 0.1278 |
| 26024 | PTCD1 | P20T-E | Human | Esophagus | ESCC | 6.24e-26 | 5.14e-01 | 0.1124 |
| 26024 | PTCD1 | P21T-E | Human | Esophagus | ESCC | 7.35e-09 | 1.18e-01 | 0.1617 |
| 26024 | PTCD1 | P22T-E | Human | Esophagus | ESCC | 8.21e-03 | 6.54e-02 | 0.1236 |
| 26024 | PTCD1 | P23T-E | Human | Esophagus | ESCC | 2.26e-11 | 3.66e-01 | 0.108 |
| 26024 | PTCD1 | P24T-E | Human | Esophagus | ESCC | 8.98e-07 | 1.08e-01 | 0.1287 |
| 26024 | PTCD1 | P26T-E | Human | Esophagus | ESCC | 4.93e-16 | 2.09e-01 | 0.1276 |
| 26024 | PTCD1 | P27T-E | Human | Esophagus | ESCC | 5.17e-20 | 3.06e-01 | 0.1055 |
| 26024 | PTCD1 | P28T-E | Human | Esophagus | ESCC | 7.25e-11 | 2.43e-01 | 0.1149 |
| Page: 1 2 3 |
| Tissue | Expression Dynamics | Abbreviation |
| Esophagus | 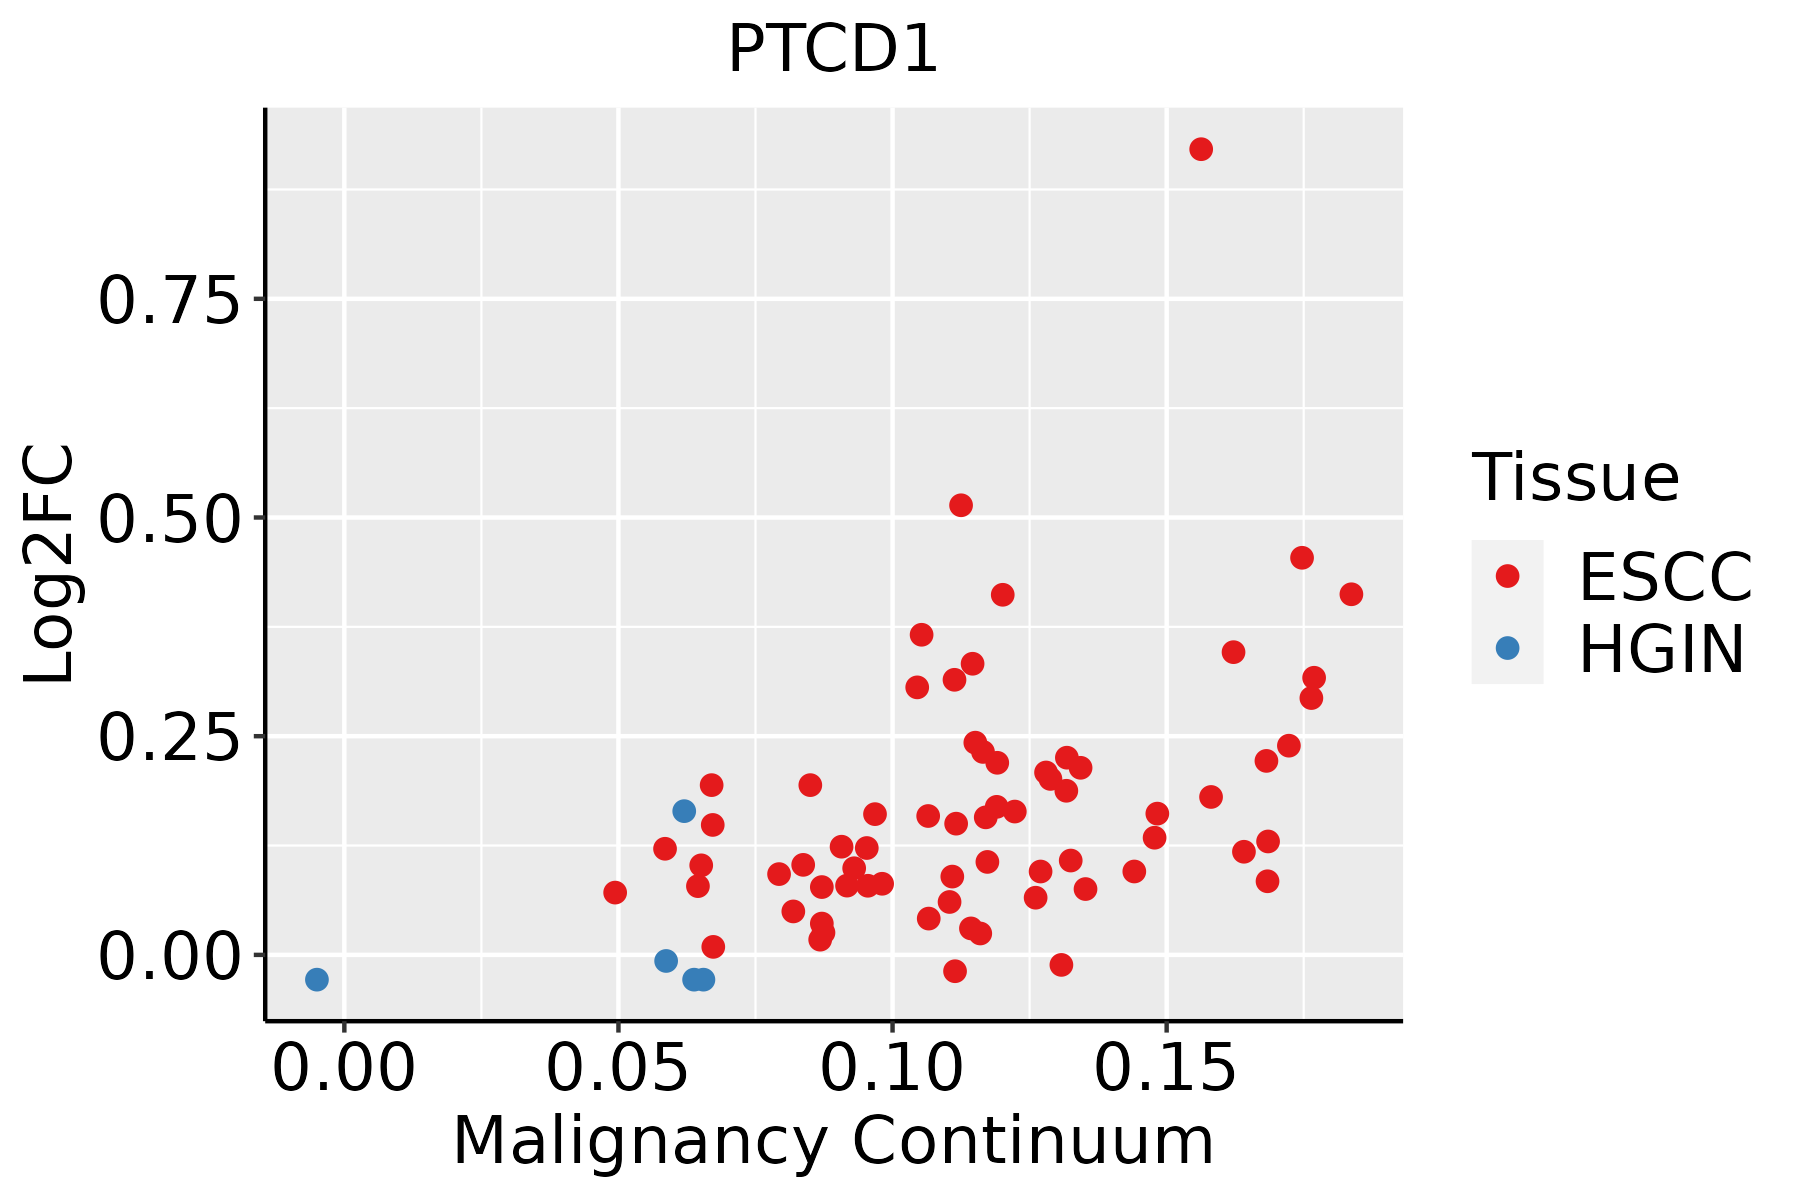 | ESCC: Esophageal squamous cell carcinoma |
| HGIN: High-grade intraepithelial neoplasias | ||
| LGIN: Low-grade intraepithelial neoplasias | ||
| Thyroid | 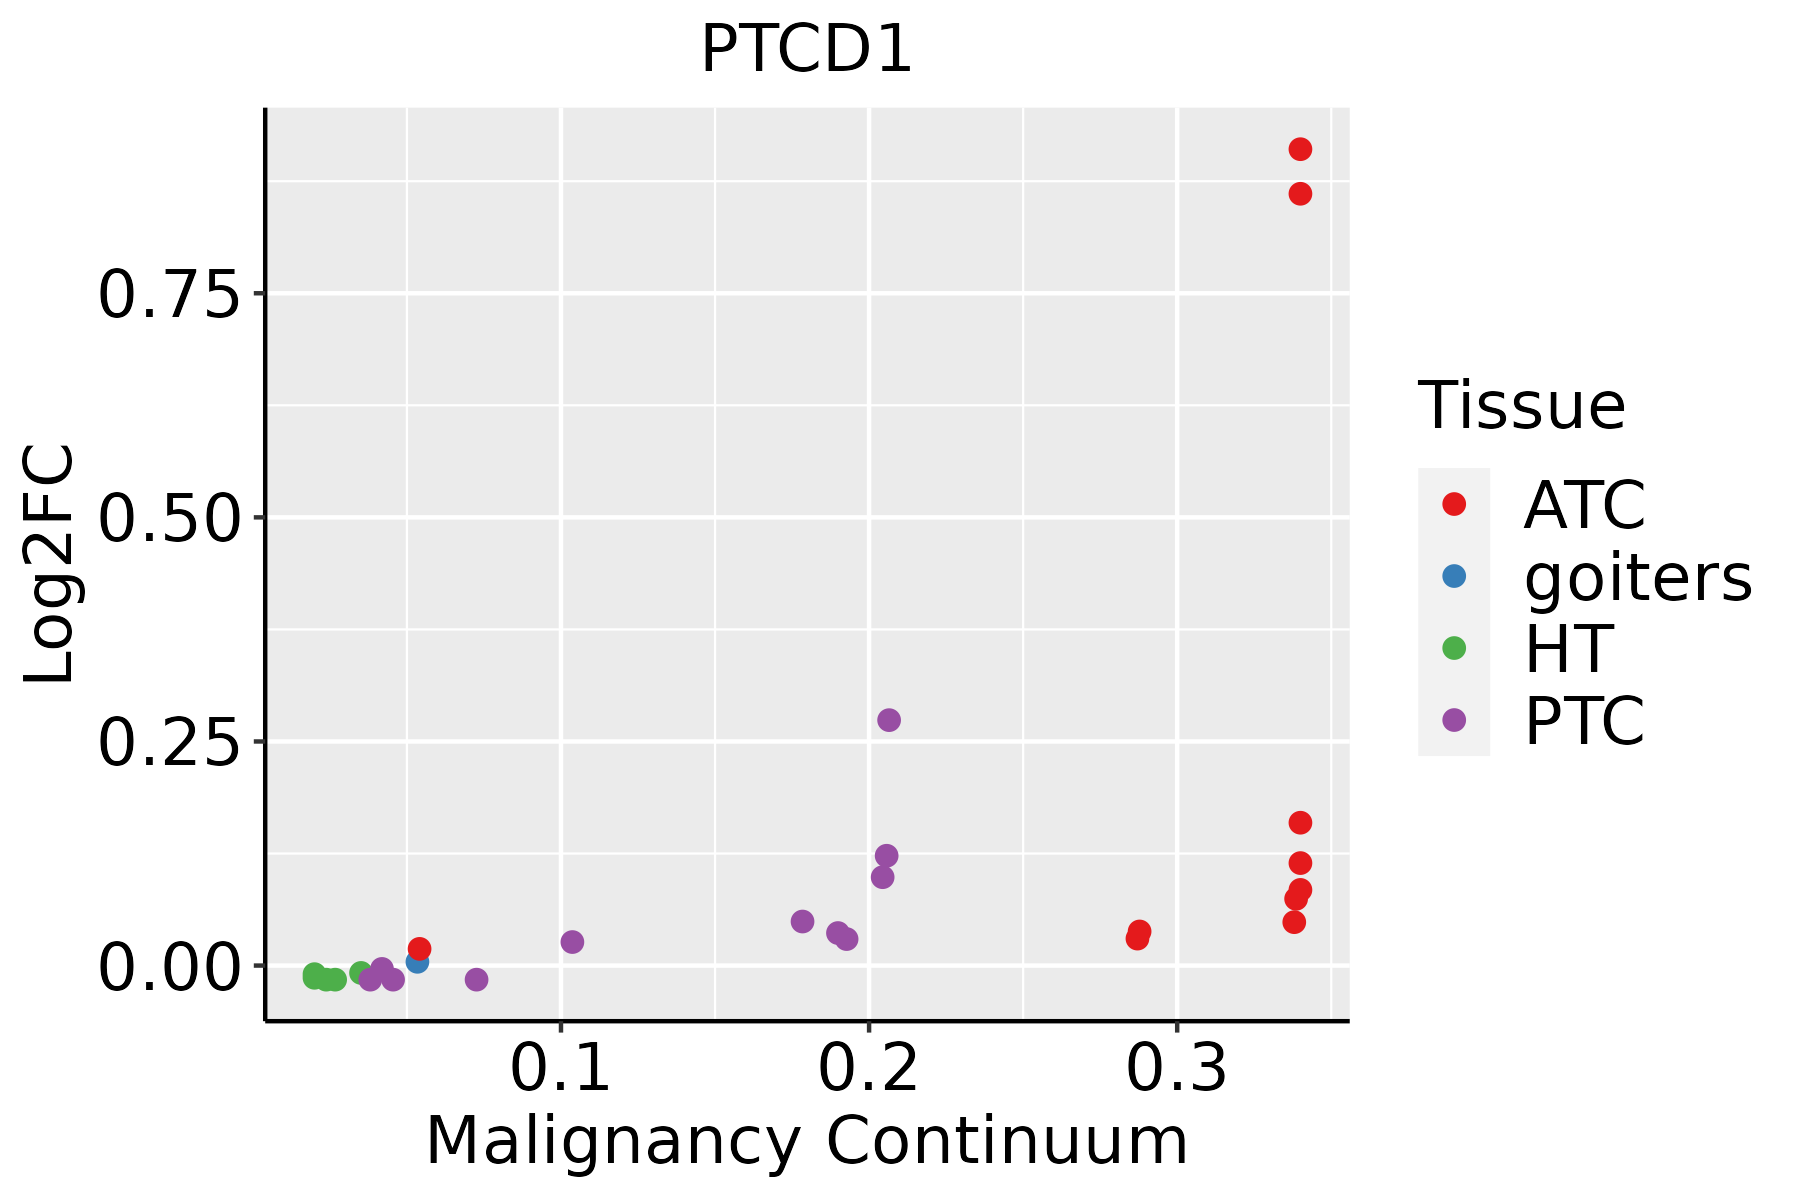 | ATC: Anaplastic thyroid cancer |
| HT: Hashimoto's thyroiditis | ||
| PTC: Papillary thyroid cancer |
| ∗log2FC in expression of this searched gene in stem-like cells from each diseased tissue sample relative to stem-like cells in normal samples in each tissue plotted against the malignancy continuum. Samples are colored based on if they are from different disease stage. |
Top |
Malignant transformation related pathway analysis |
| Find out the enriched GO biological processes and KEGG pathways involved in transition from healthy to precancer to cancer |
| Tissue | Disease Stage | Enriched GO biological Processes |
| Colorectum | AD |  |
| Colorectum | SER |  |
| Colorectum | MSS |  |
| Colorectum | MSI-H |  |
| Colorectum | FAP |  |
| ∗Top 15 enriched GO BP terms are showed in the bar plot of each disease state in each tissue. Each row represents a significant GO biological process which is colored according to the -log10(p.adjust). |
| Page: 1 2 3 4 5 6 7 8 9 |
| GO ID | Tissue | Disease Stage | Description | Gene Ratio | Bg Ratio | pvalue | p.adjust | Count |
| GO:003447015 | Esophagus | ESCC | ncRNA processing | 300/8552 | 395/18723 | 3.09e-35 | 3.26e-32 | 300 |
| GO:003466012 | Esophagus | ESCC | ncRNA metabolic process | 346/8552 | 485/18723 | 4.35e-31 | 2.51e-28 | 346 |
| GO:00080333 | Esophagus | ESCC | tRNA processing | 92/8552 | 127/18723 | 7.83e-10 | 1.93e-08 | 92 |
| GO:00063992 | Esophagus | ESCC | tRNA metabolic process | 122/8552 | 179/18723 | 9.03e-10 | 2.19e-08 | 122 |
| GO:00311233 | Esophagus | ESCC | RNA 3'-end processing | 76/8552 | 116/18723 | 1.25e-05 | 1.15e-04 | 76 |
| GO:003447018 | Thyroid | PTC | ncRNA processing | 215/5968 | 395/18723 | 7.14e-21 | 1.22e-18 | 215 |
| GO:00346608 | Thyroid | PTC | ncRNA metabolic process | 239/5968 | 485/18723 | 5.54e-16 | 4.26e-14 | 239 |
| GO:00311235 | Thyroid | PTC | RNA 3'-end processing | 65/5968 | 116/18723 | 6.24e-08 | 1.30e-06 | 65 |
| GO:003447021 | Thyroid | ATC | ncRNA processing | 216/6293 | 395/18723 | 3.14e-18 | 3.98e-16 | 216 |
| GO:003466021 | Thyroid | ATC | ncRNA metabolic process | 240/6293 | 485/18723 | 2.03e-13 | 9.91e-12 | 240 |
| GO:003112312 | Thyroid | ATC | RNA 3'-end processing | 65/6293 | 116/18723 | 5.58e-07 | 7.93e-06 | 65 |
| Page: 1 |
| Pathway ID | Tissue | Disease Stage | Description | Gene Ratio | Bg Ratio | pvalue | p.adjust | qvalue | Count |
| Page: 1 |
Top |
Cell-cell communication analysis |
| Identification of potential cell-cell interactions between two cell types and their ligand-receptor pairs for different disease states |
| Ligand | Receptor | LRpair | Pathway | Tissue | Disease Stage |
| Page: 1 |
Top |
Single-cell gene regulatory network inference analysis |
| Find out the significant the regulons (TFs) and the target genes of each regulon across cell types for different disease states |
| TF | Cell Type | Tissue | Disease Stage | Target Gene | RSS | Regulon Activity |
| ∗The dot plots of a searched regulon are shown for all cell subpopulations in each disease state of each tissue based on the regulon specific score inferred using pySCENIC and by calculating the average expression. |
| Page: 1 |
Top |
Somatic mutation of malignant transformation related genes |
| Annotation of somatic variants for genes involved in malignant transformation |
| Hugo Symbol | Variant Class | Variant Classification | dbSNP RS | HGVSc | HGVSp | HGVSp Short | SWISSPROT | BIOTYPE | SIFT | PolyPhen | Tumor Sample Barcode | Tissue | Histology | Sex | Age | Stage | Therapy Types | Drugs | Outcome |
| PTCD1 | SNV | Missense_Mutation | rs369237643 | c.119N>A | p.Arg40Gln | p.R40Q | O75127 | protein_coding | tolerated_low_confidence(0.31) | benign(0) | TCGA-3C-AALK-01 | Breast | breast invasive carcinoma | Female | <65 | I/II | Chemotherapy | docetaxel | SD |
| PTCD1 | SNV | Missense_Mutation | novel | c.1214N>C | p.Arg405Thr | p.R405T | O75127 | protein_coding | tolerated(0.21) | benign(0.003) | TCGA-AC-A5XS-01 | Breast | breast invasive carcinoma | Female | >=65 | I/II | Hormone Therapy | femara | SD |
| PTCD1 | SNV | Missense_Mutation | c.146C>T | p.Ser49Phe | p.S49F | O75127 | protein_coding | tolerated(0.11) | benign(0.01) | TCGA-D8-A1J8-01 | Breast | breast invasive carcinoma | Female | >=65 | I/II | Hormone Therapy | nolvadex | SD | |
| PTCD1 | SNV | Missense_Mutation | rs757199775 | c.550N>A | p.Gly184Arg | p.G184R | O75127 | protein_coding | deleterious(0) | probably_damaging(1) | TCGA-EW-A6S9-01 | Breast | breast invasive carcinoma | Female | <65 | I/II | Unknown | Unknown | SD |
| PTCD1 | SNV | Missense_Mutation | c.1384N>C | p.Ala462Pro | p.A462P | O75127 | protein_coding | deleterious(0.02) | possibly_damaging(0.544) | TCGA-GM-A2DD-01 | Breast | breast invasive carcinoma | Female | <65 | I/II | Chemotherapy | fluorouracil | CR | |
| PTCD1 | insertion | Frame_Shift_Ins | novel | c.903_907dupGTACG | p.Ala303GlyfsTer9 | p.A303Gfs*9 | O75127 | protein_coding | TCGA-AR-A256-01 | Breast | breast invasive carcinoma | Female | <65 | I/II | Chemotherapy | doxorubicin | PD | ||
| PTCD1 | SNV | Missense_Mutation | c.278N>G | p.Ser93Cys | p.S93C | O75127 | protein_coding | deleterious(0) | probably_damaging(0.968) | TCGA-EK-A3GM-01 | Cervix | cervical & endocervical cancer | Female | >=65 | I/II | Unknown | Unknown | SD | |
| PTCD1 | SNV | Missense_Mutation | c.949N>A | p.Pro317Thr | p.P317T | O75127 | protein_coding | deleterious(0) | probably_damaging(0.985) | TCGA-FU-A3TQ-01 | Cervix | cervical & endocervical cancer | Female | <65 | III/IV | Unknown | Unknown | SD | |
| PTCD1 | SNV | Missense_Mutation | novel | c.1794C>G | p.Ile598Met | p.I598M | O75127 | protein_coding | deleterious(0.02) | benign(0) | TCGA-HM-A4S6-01 | Cervix | cervical & endocervical cancer | Female | <65 | III/IV | Chemotherapy | cisplatin | CR |
| PTCD1 | SNV | Missense_Mutation | rs147029104 | c.1864N>A | p.Glu622Lys | p.E622K | O75127 | protein_coding | deleterious(0.02) | probably_damaging(0.978) | TCGA-VS-A953-01 | Cervix | cervical & endocervical cancer | Female | <65 | I/II | Unknown | Unknown | PD |
| Page: 1 2 3 4 5 6 7 8 |
Top |
Related drugs of malignant transformation related genes |
| Identification of chemicals and drugs interact with genes involved in malignant transfromation |
| (DGIdb 4.0) |
| Entrez ID | Symbol | Category | Interaction Types | Drug Claim Name | Drug Name | PMIDs |
| Page: 1 |

Copyright 2023-Present -The University of Texas Health Science Center at Houston |