| Tissue | Expression Dynamics | Abbreviation |
| Cervix | 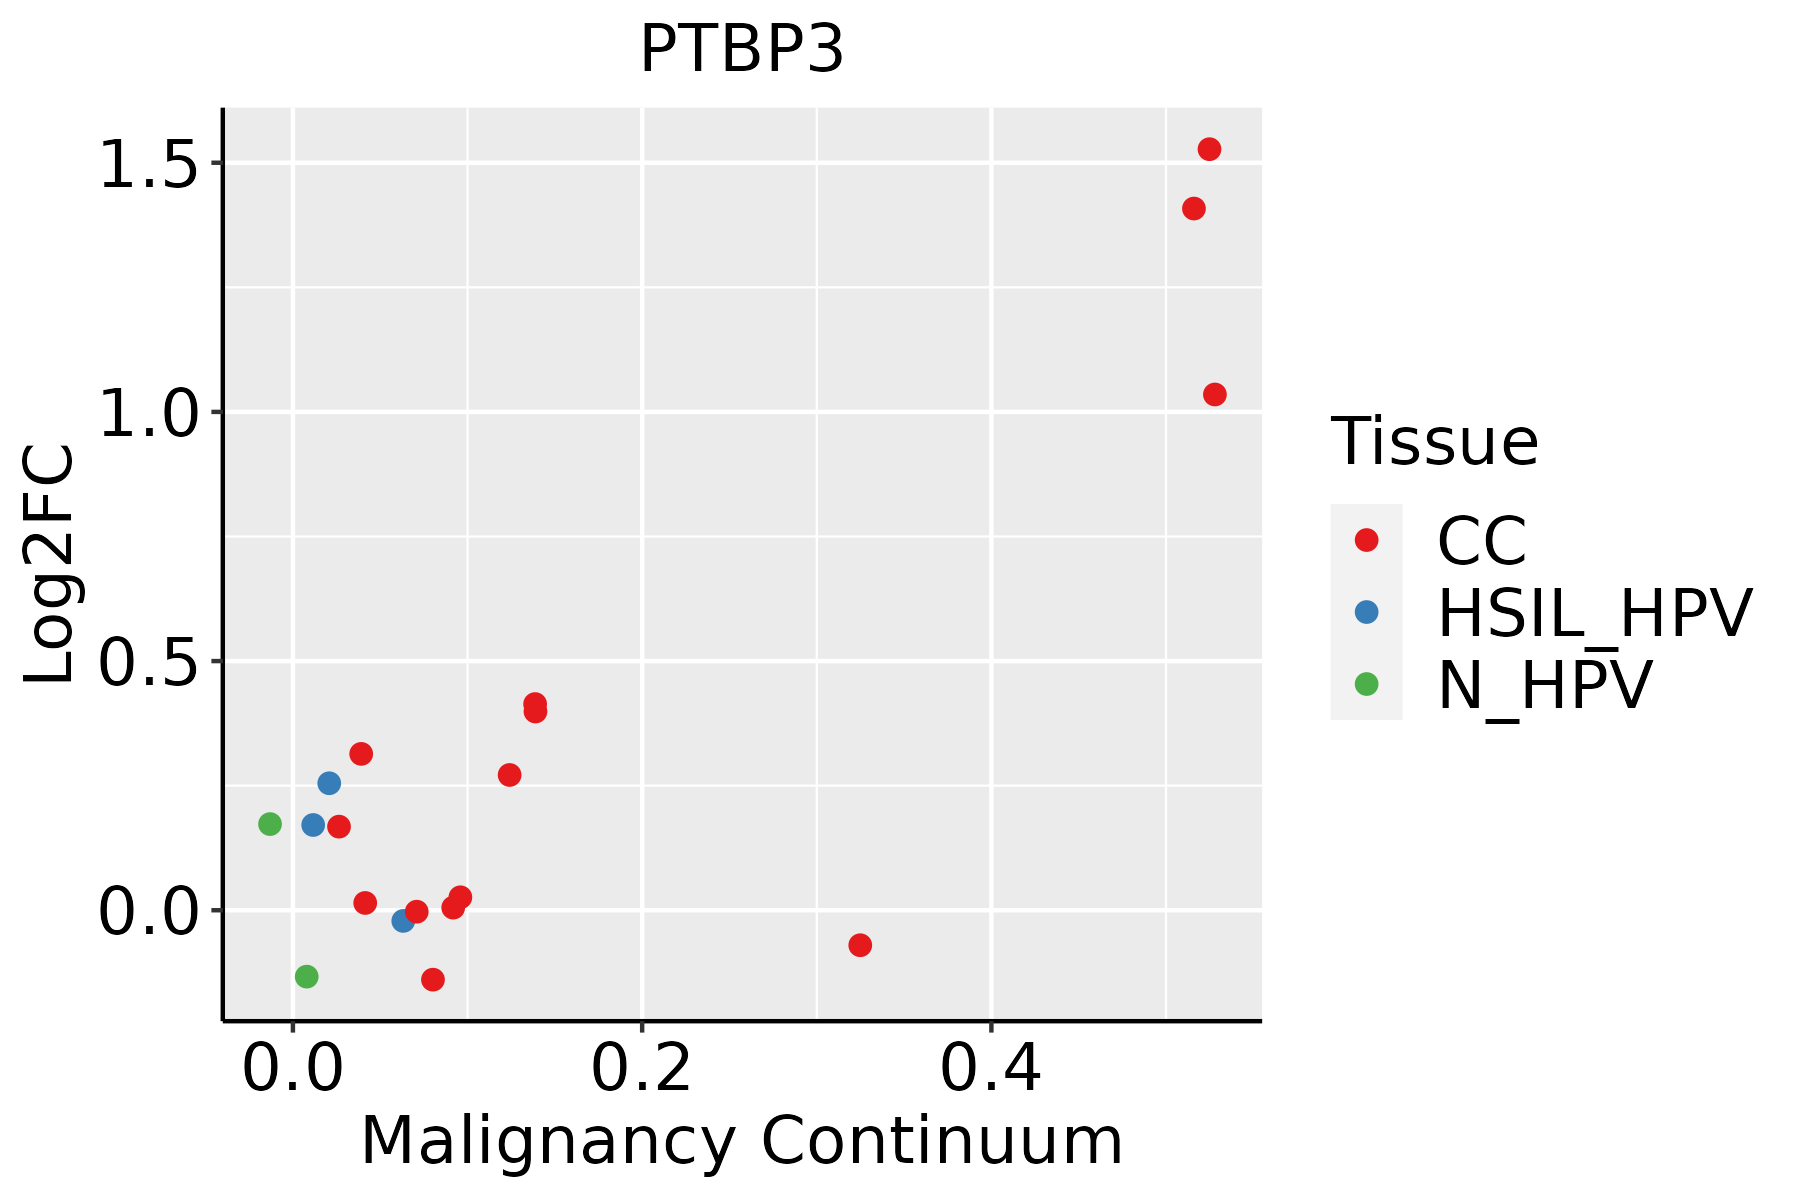 | CC: Cervix cancer |
| HSIL_HPV: HPV-infected high-grade squamous intraepithelial lesions |
| N_HPV: HPV-infected normal cervix |
| Colorectum (GSE201348) |  | FAP: Familial adenomatous polyposis |
| CRC: Colorectal cancer |
| Colorectum (HTA11) |  | AD: Adenomas |
| SER: Sessile serrated lesions |
| MSI-H: Microsatellite-high colorectal cancer |
| MSS: Microsatellite stable colorectal cancer |
| Esophagus | 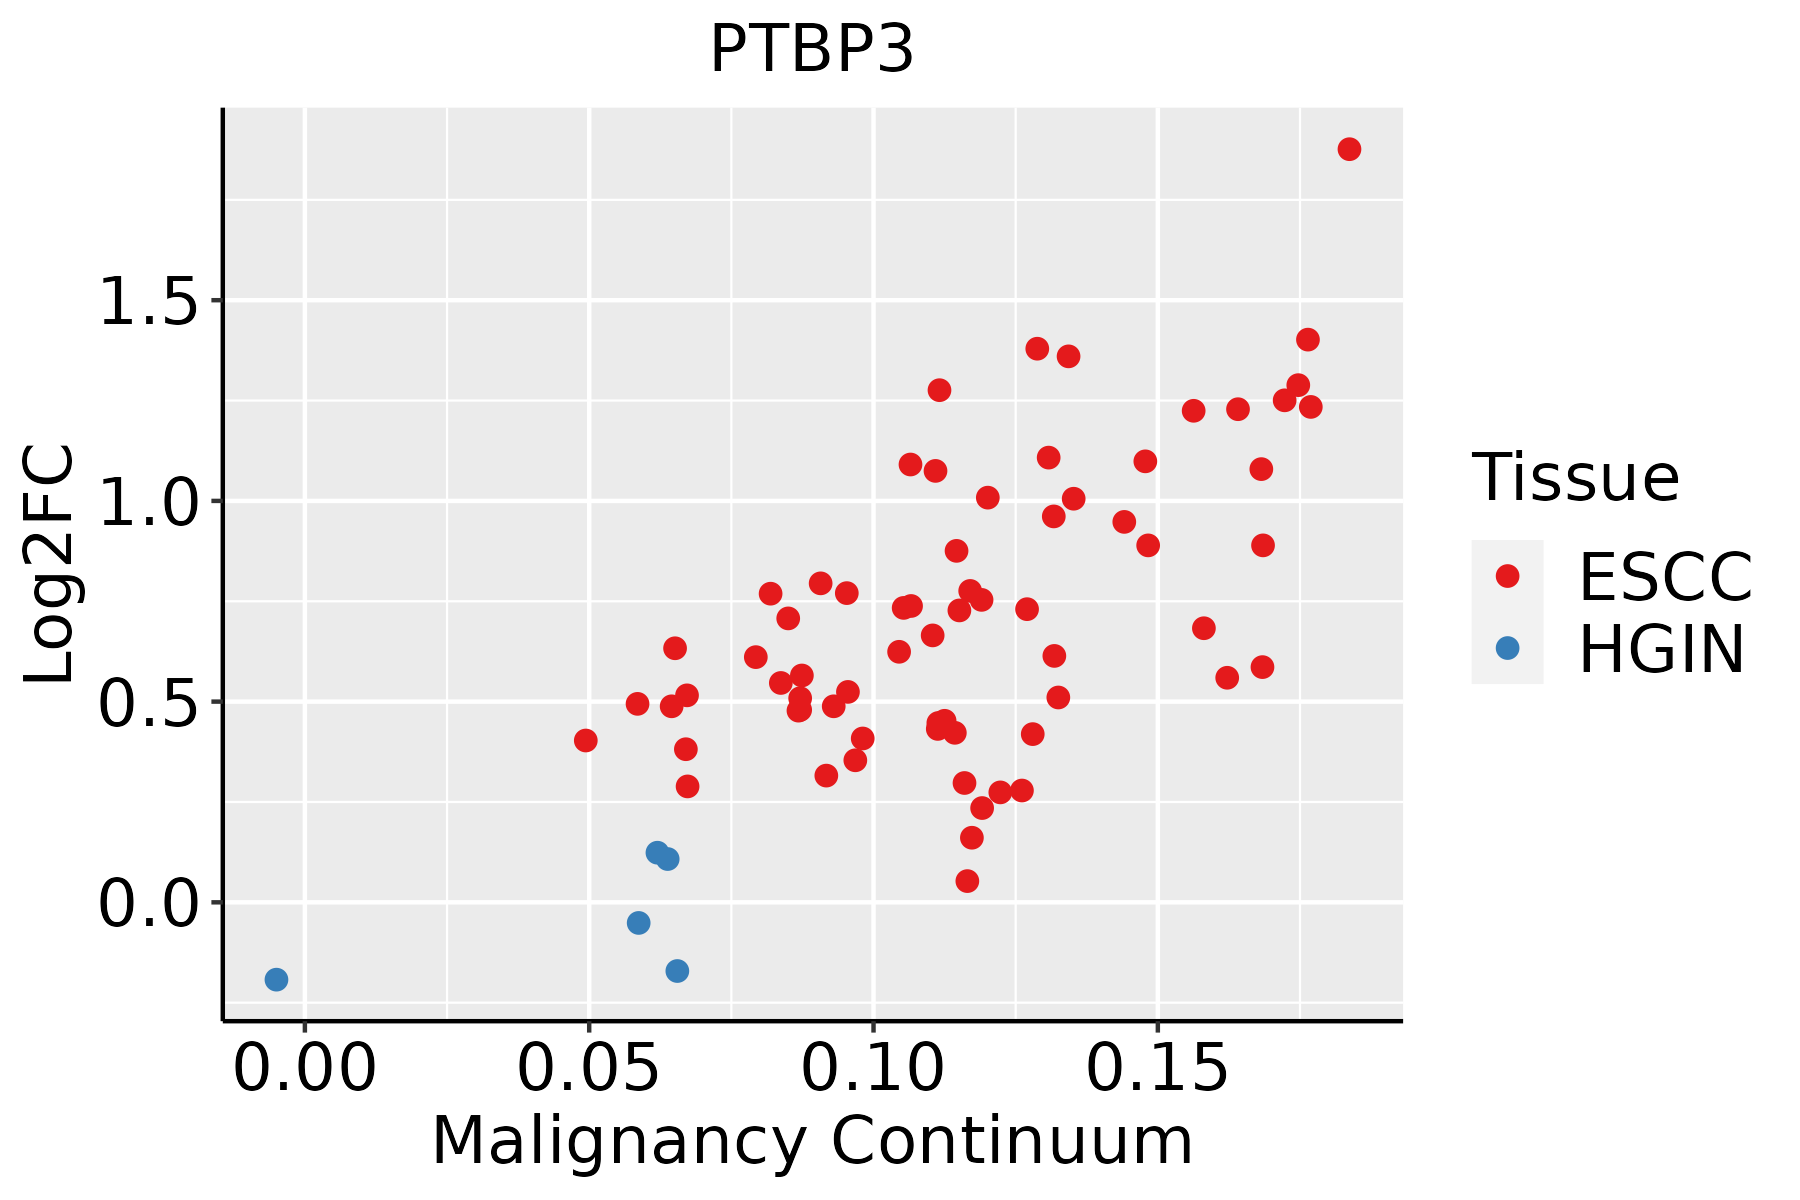 | ESCC: Esophageal squamous cell carcinoma |
| HGIN: High-grade intraepithelial neoplasias |
| LGIN: Low-grade intraepithelial neoplasias |
| Liver |  | HCC: Hepatocellular carcinoma |
| NAFLD: Non-alcoholic fatty liver disease |
| Lung | 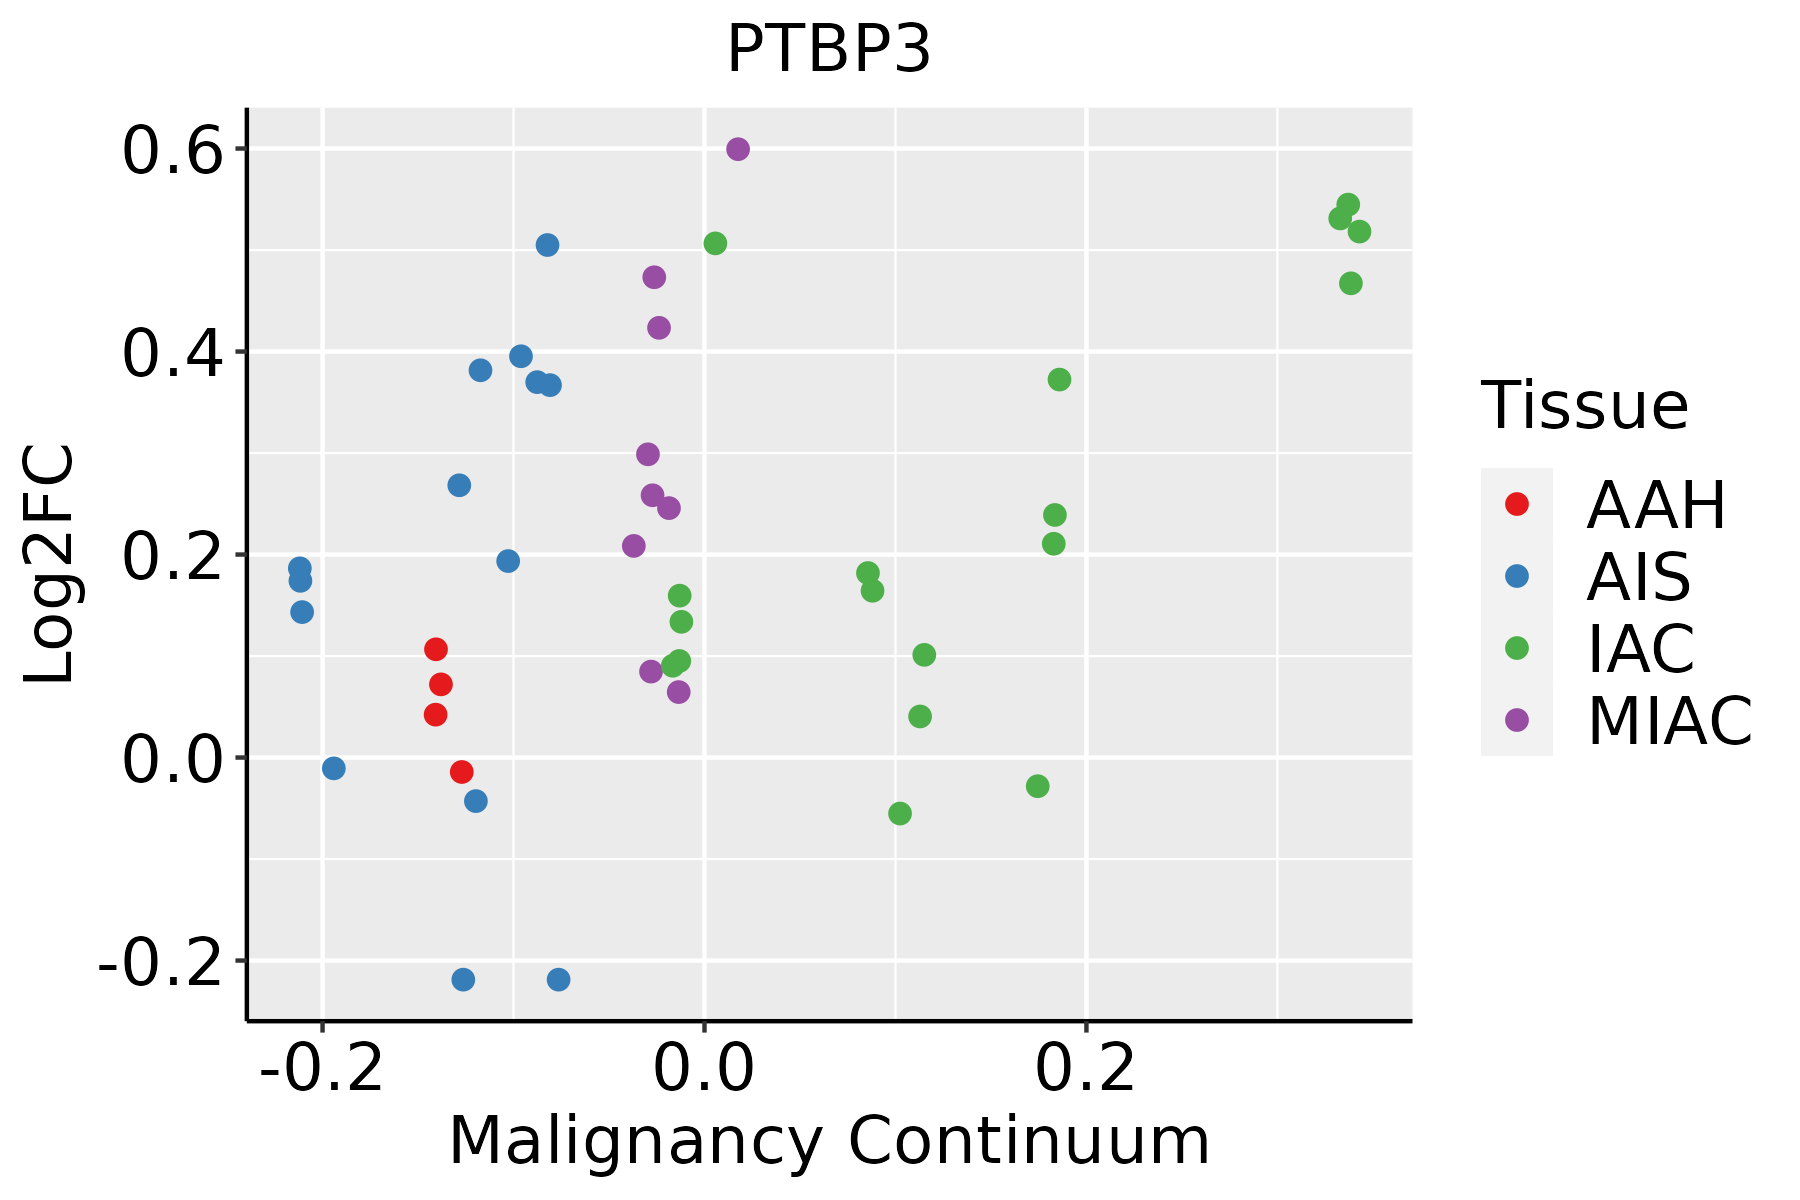 | AAH: Atypical adenomatous hyperplasia |
| AIS: Adenocarcinoma in situ |
| IAC: Invasive lung adenocarcinoma |
| MIA: Minimally invasive adenocarcinoma |
| Oral Cavity | 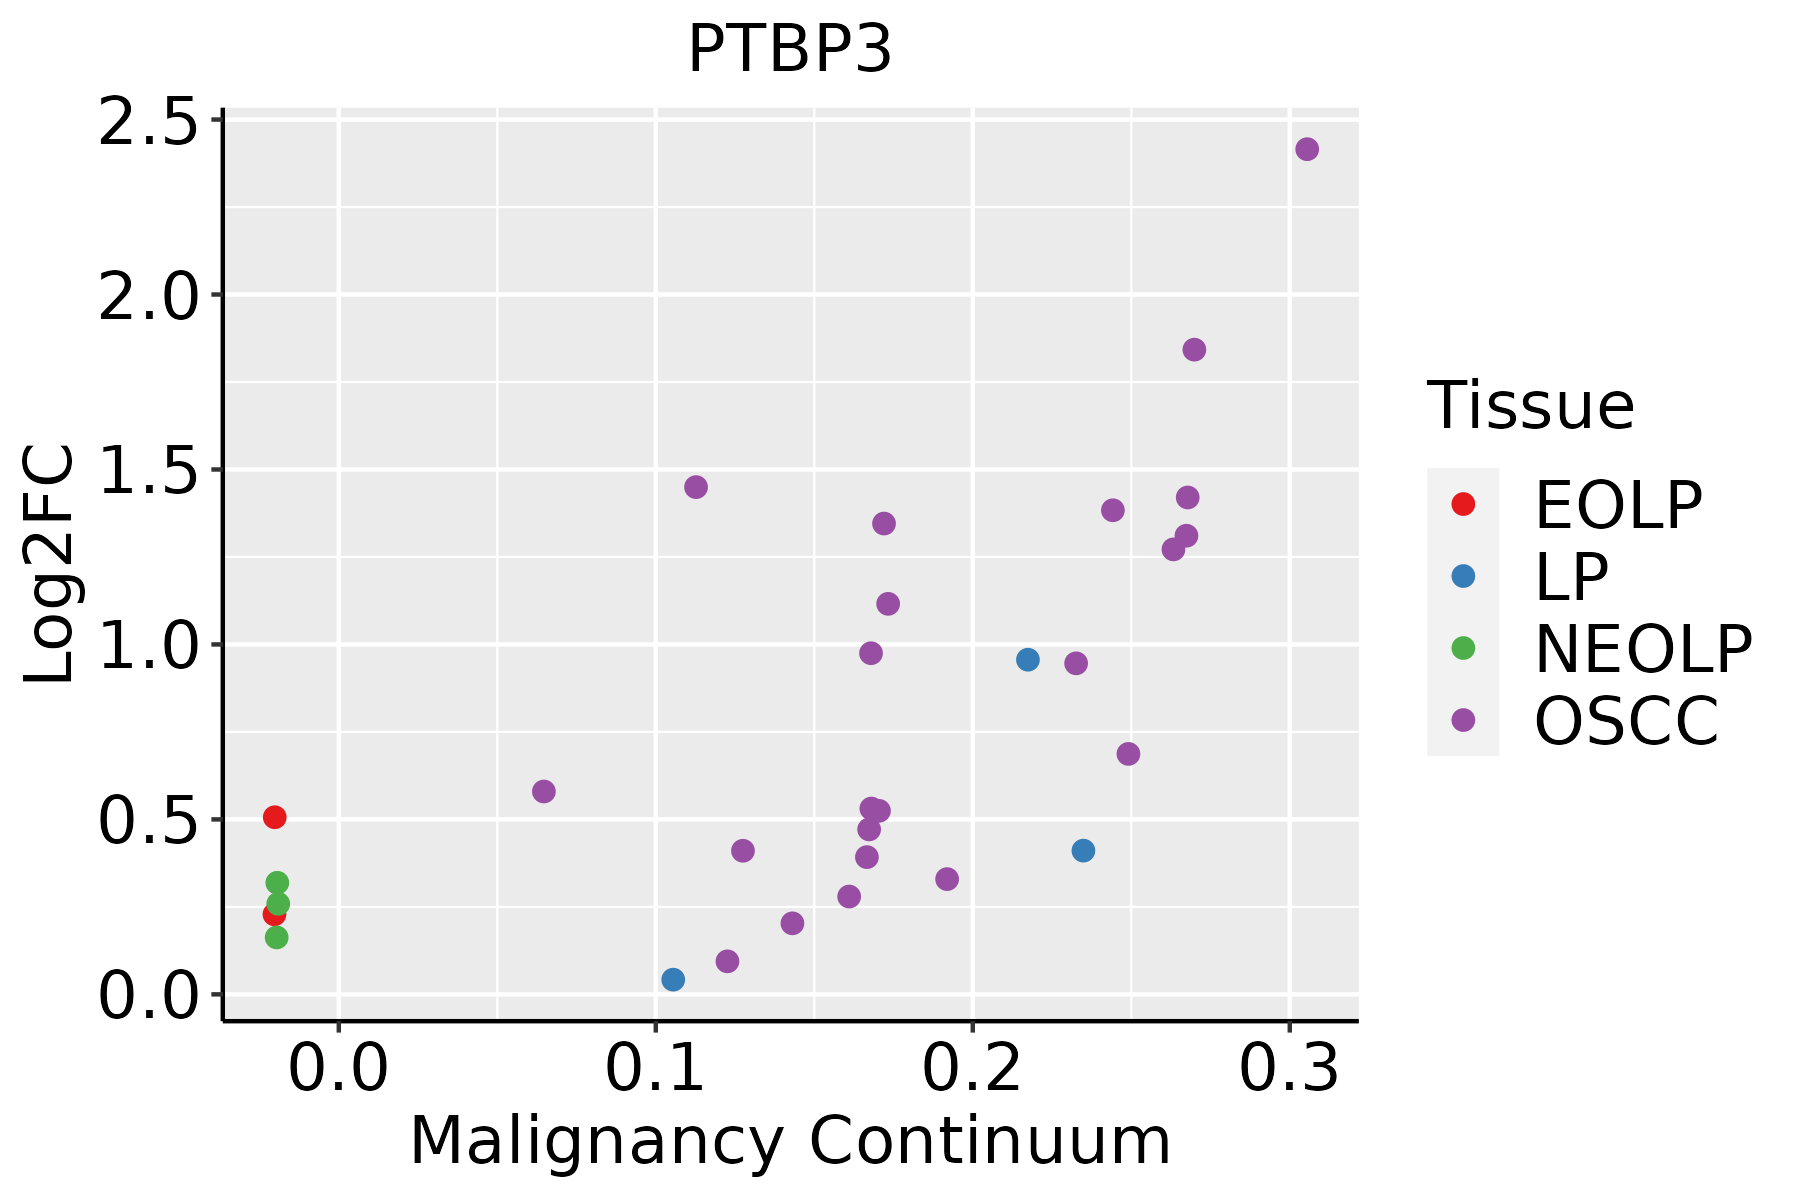 | EOLP: Erosive Oral lichen planus |
| LP: leukoplakia |
| NEOLP: Non-erosive oral lichen planus |
| OSCC: Oral squamous cell carcinoma |
| Prostate |  | BPH: Benign Prostatic Hyperplasia |
| Skin | 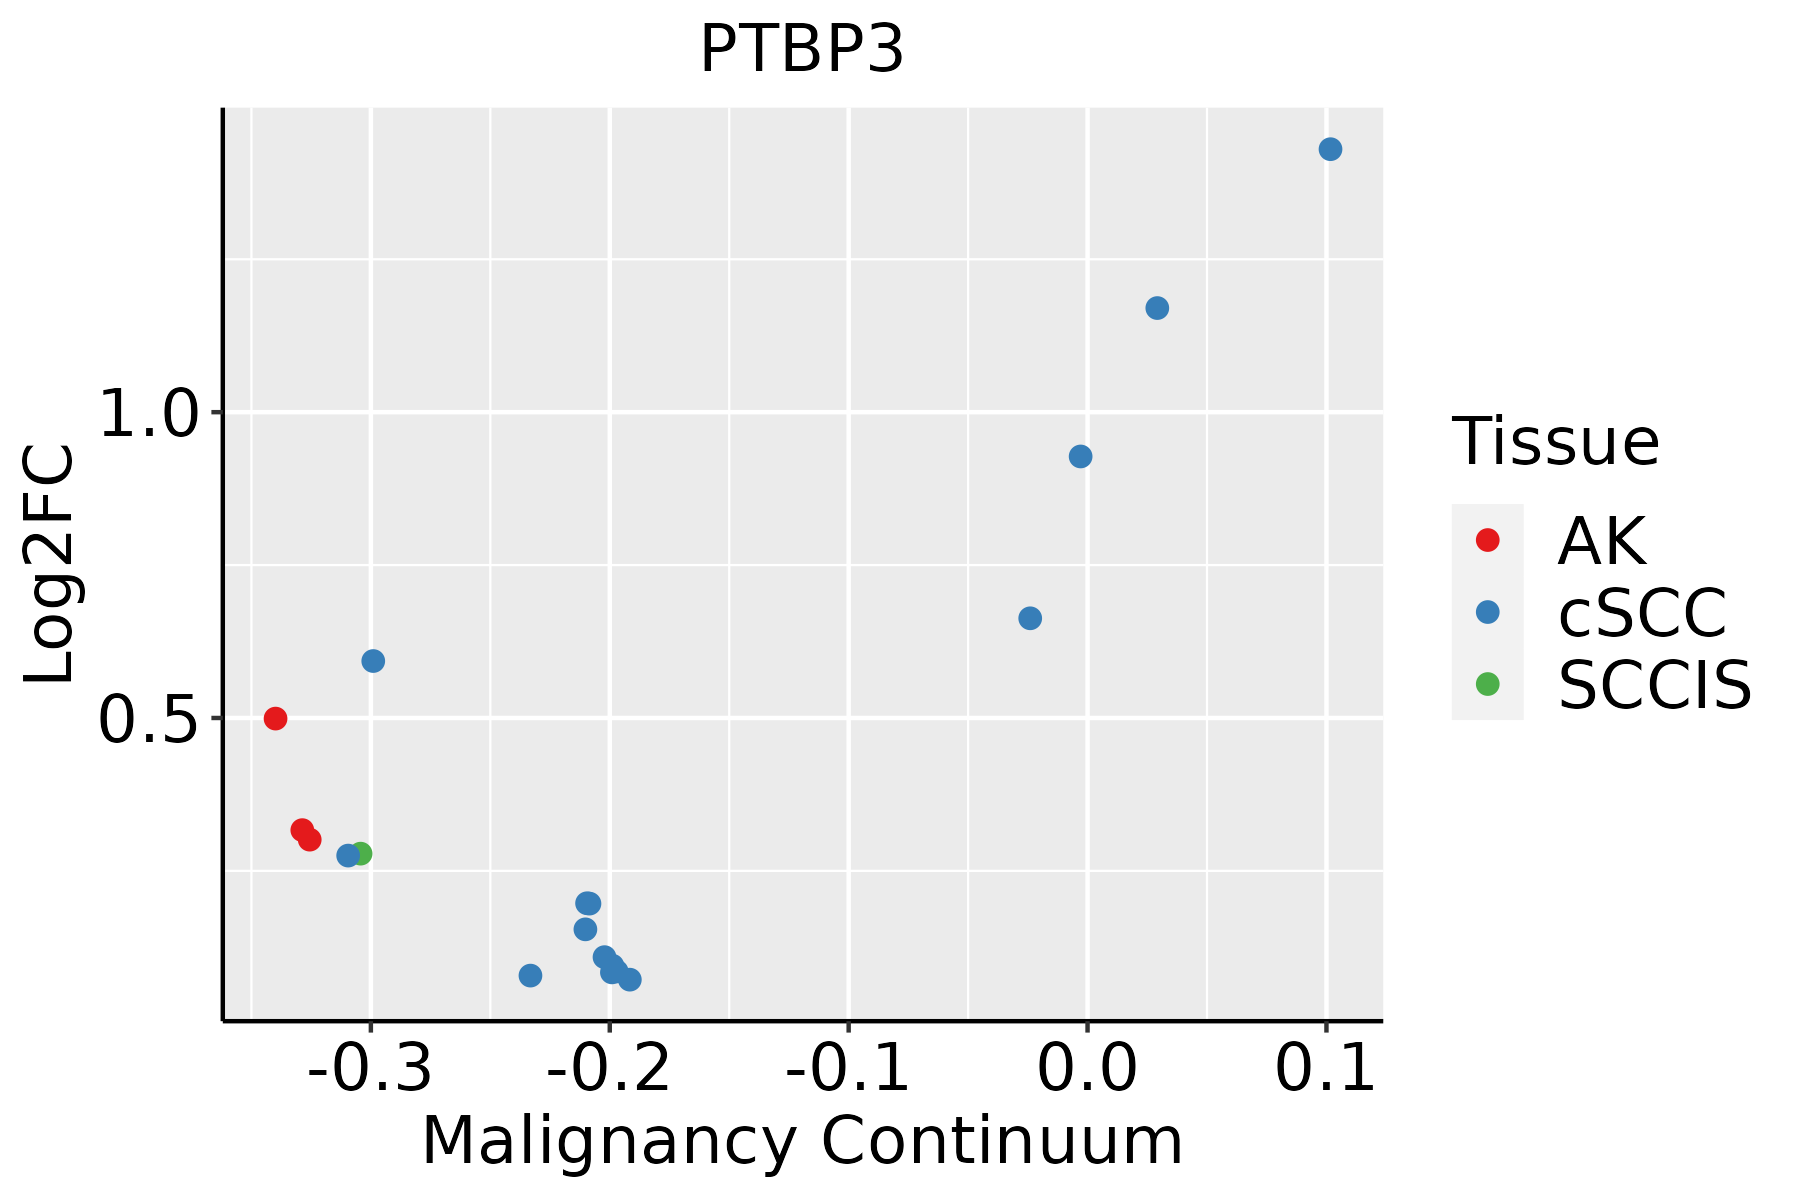 | AK: Actinic keratosis |
| cSCC: Cutaneous squamous cell carcinoma |
| SCCIS:squamous cell carcinoma in situ |
| Thyroid |  | ATC: Anaplastic thyroid cancer |
| HT: Hashimoto's thyroiditis |
| PTC: Papillary thyroid cancer |
| GO ID | Tissue | Disease Stage | Description | Gene Ratio | Bg Ratio | pvalue | p.adjust | Count |
| GO:004348410 | Cervix | CC | regulation of RNA splicing | 42/2311 | 148/18723 | 1.25e-07 | 6.24e-06 | 42 |
| GO:003009910 | Cervix | CC | myeloid cell differentiation | 83/2311 | 381/18723 | 1.31e-07 | 6.42e-06 | 83 |
| GO:000226210 | Cervix | CC | myeloid cell homeostasis | 43/2311 | 157/18723 | 2.66e-07 | 1.12e-05 | 43 |
| GO:003410110 | Cervix | CC | erythrocyte homeostasis | 37/2311 | 129/18723 | 5.16e-07 | 1.93e-05 | 37 |
| GO:003311910 | Cervix | CC | negative regulation of RNA splicing | 13/2311 | 25/18723 | 1.83e-06 | 5.89e-05 | 13 |
| GO:003021810 | Cervix | CC | erythrocyte differentiation | 34/2311 | 120/18723 | 2.00e-06 | 6.18e-05 | 34 |
| GO:004887210 | Cervix | CC | homeostasis of number of cells | 61/2311 | 272/18723 | 2.17e-06 | 6.55e-05 | 61 |
| GO:000838010 | Cervix | CC | RNA splicing | 76/2311 | 434/18723 | 9.79e-04 | 8.19e-03 | 76 |
| GO:0008380 | Colorectum | AD | RNA splicing | 169/3918 | 434/18723 | 3.59e-18 | 2.04e-15 | 169 |
| GO:0043484 | Colorectum | AD | regulation of RNA splicing | 70/3918 | 148/18723 | 6.47e-13 | 1.16e-10 | 70 |
| GO:0034101 | Colorectum | AD | erythrocyte homeostasis | 51/3918 | 129/18723 | 1.07e-06 | 3.59e-05 | 51 |
| GO:0030099 | Colorectum | AD | myeloid cell differentiation | 119/3918 | 381/18723 | 1.24e-06 | 4.01e-05 | 119 |
| GO:0002262 | Colorectum | AD | myeloid cell homeostasis | 57/3918 | 157/18723 | 6.17e-06 | 1.56e-04 | 57 |
| GO:0048872 | Colorectum | AD | homeostasis of number of cells | 87/3918 | 272/18723 | 1.16e-05 | 2.61e-04 | 87 |
| GO:0030218 | Colorectum | AD | erythrocyte differentiation | 45/3918 | 120/18723 | 2.22e-05 | 4.39e-04 | 45 |
| GO:0033119 | Colorectum | AD | negative regulation of RNA splicing | 15/3918 | 25/18723 | 2.37e-05 | 4.62e-04 | 15 |
| GO:00083801 | Colorectum | SER | RNA splicing | 123/2897 | 434/18723 | 3.84e-12 | 8.41e-10 | 123 |
| GO:00434841 | Colorectum | SER | regulation of RNA splicing | 49/2897 | 148/18723 | 7.02e-08 | 4.49e-06 | 49 |
| GO:00341011 | Colorectum | SER | erythrocyte homeostasis | 39/2897 | 129/18723 | 1.70e-05 | 5.11e-04 | 39 |
| GO:00022621 | Colorectum | SER | myeloid cell homeostasis | 44/2897 | 157/18723 | 4.09e-05 | 1.03e-03 | 44 |
| Hugo Symbol | Variant Class | Variant Classification | dbSNP RS | HGVSc | HGVSp | HGVSp Short | SWISSPROT | BIOTYPE | SIFT | PolyPhen | Tumor Sample Barcode | Tissue | Histology | Sex | Age | Stage | Therapy Types | Drugs | Outcome |
| PTBP3 | SNV | Missense_Mutation | novel | c.70G>C | p.Asp24His | p.D24H | O95758 | protein_coding | deleterious(0) | probably_damaging(0.94) | TCGA-A7-A6VY-01 | Breast | breast invasive carcinoma | Female | <65 | I/II | Chemotherapy | cyclophosphamide | CR |
| PTBP3 | SNV | Missense_Mutation | | c.373N>G | p.Pro125Ala | p.P125A | O95758 | protein_coding | tolerated(0.19) | benign(0.06) | TCGA-A8-A09N-01 | Breast | breast invasive carcinoma | Female | <65 | III/IV | Unknown | Unknown | SD |
| PTBP3 | SNV | Missense_Mutation | | c.926N>T | p.Ser309Leu | p.S309L | O95758 | protein_coding | tolerated(0.11) | benign(0.005) | TCGA-A8-A0A7-01 | Breast | breast invasive carcinoma | Female | <65 | I/II | Unknown | Unknown | SD |
| PTBP3 | SNV | Missense_Mutation | | c.566N>A | p.Arg189Gln | p.R189Q | O95758 | protein_coding | deleterious(0) | possibly_damaging(0.892) | TCGA-AN-A046-01 | Breast | breast invasive carcinoma | Female | >=65 | I/II | Unknown | Unknown | SD |
| PTBP3 | SNV | Missense_Mutation | | c.1313N>G | p.His438Arg | p.H438R | O95758 | protein_coding | deleterious(0) | probably_damaging(0.912) | TCGA-BH-A0E9-01 | Breast | breast invasive carcinoma | Female | <65 | I/II | Chemotherapy | taxotere | CR |
| PTBP3 | SNV | Missense_Mutation | | c.932A>T | p.Tyr311Phe | p.Y311F | O95758 | protein_coding | tolerated(0.36) | benign(0.3) | TCGA-BH-A1FU-01 | Breast | breast invasive carcinoma | Female | <65 | I/II | Unknown | Unknown | PD |
| PTBP3 | deletion | Frame_Shift_Del | novel | c.1073delG | p.Ser358MetfsTer37 | p.S358Mfs*37 | O95758 | protein_coding | | | TCGA-EW-A2FV-01 | Breast | breast invasive carcinoma | Female | <65 | III/IV | Chemotherapy | docetaxel | SD |
| PTBP3 | SNV | Missense_Mutation | | c.1348G>C | p.Asp450His | p.D450H | O95758 | protein_coding | deleterious(0) | benign(0.143) | TCGA-EA-A43B-01 | Cervix | cervical & endocervical cancer | Female | <65 | I/II | Chemotherapy | cisplatin | CR |
| PTBP3 | SNV | Missense_Mutation | | c.830N>C | p.Arg277Thr | p.R277T | O95758 | protein_coding | deleterious(0) | probably_damaging(0.989) | TCGA-EK-A2RJ-01 | Cervix | cervical & endocervical cancer | Female | <65 | I/II | Unknown | Unknown | SD |
| PTBP3 | SNV | Missense_Mutation | novel | c.1274N>C | p.Arg425Thr | p.R425T | O95758 | protein_coding | tolerated(0.07) | benign(0.023) | TCGA-HM-A4S6-01 | Cervix | cervical & endocervical cancer | Female | <65 | III/IV | Chemotherapy | cisplatin | CR |


