
|
|||||
|
 | |
| |
| |
| |
| |
| |
|
Gene: PTBP2 |
Gene summary for PTBP2 |
| Gene information | Species | Human | Gene symbol | PTBP2 | Gene ID | 58155 |
| Gene name | polypyrimidine tract binding protein 2 | |
| Gene Alias | PTBLP | |
| Cytomap | 1p21.3 | |
| Gene Type | protein-coding | GO ID | GO:0006139 | UniProtAcc | Q9UKA9 |
Top |
Malignant transformation analysis |
| Identification of the aberrant gene expression in precancerous and cancerous lesions by comparing the gene expression of stem-like cells in diseased tissues with normal stem cells |
| Entrez ID | Symbol | Replicates | Species | Organ | Tissue | Adj P-value | Log2FC | Malignancy |
| 58155 | PTBP2 | CCI_1 | Human | Cervix | CC | 1.27e-14 | 1.15e+00 | 0.528 |
| 58155 | PTBP2 | CCI_2 | Human | Cervix | CC | 4.08e-05 | 8.04e-01 | 0.5249 |
| 58155 | PTBP2 | CCI_3 | Human | Cervix | CC | 8.39e-17 | 9.96e-01 | 0.516 |
| 58155 | PTBP2 | HTA11_3410_2000001011 | Human | Colorectum | AD | 2.08e-15 | -5.42e-01 | 0.0155 |
| 58155 | PTBP2 | HTA11_2487_2000001011 | Human | Colorectum | SER | 3.66e-12 | -6.41e-01 | -0.1808 |
| 58155 | PTBP2 | HTA11_78_2000001011 | Human | Colorectum | AD | 1.70e-02 | -3.87e-01 | -0.1088 |
| 58155 | PTBP2 | HTA11_3361_2000001011 | Human | Colorectum | AD | 8.66e-09 | -5.63e-01 | -0.1207 |
| 58155 | PTBP2 | HTA11_696_2000001011 | Human | Colorectum | AD | 9.72e-08 | -4.55e-01 | -0.1464 |
| 58155 | PTBP2 | HTA11_2992_2000001011 | Human | Colorectum | SER | 8.87e-03 | -6.66e-01 | -0.1706 |
| 58155 | PTBP2 | HTA11_5212_2000001011 | Human | Colorectum | AD | 3.74e-04 | -6.60e-01 | -0.2061 |
| 58155 | PTBP2 | HTA11_5216_2000001011 | Human | Colorectum | SER | 2.25e-02 | -6.99e-01 | -0.1462 |
| 58155 | PTBP2 | HTA11_7862_2000001011 | Human | Colorectum | AD | 4.17e-04 | -5.95e-01 | -0.0179 |
| 58155 | PTBP2 | HTA11_866_3004761011 | Human | Colorectum | AD | 7.28e-10 | -5.16e-01 | 0.096 |
| 58155 | PTBP2 | HTA11_7696_3000711011 | Human | Colorectum | AD | 3.25e-06 | -4.22e-01 | 0.0674 |
| 58155 | PTBP2 | HTA11_6818_2000001021 | Human | Colorectum | AD | 2.89e-05 | -5.19e-01 | 0.0588 |
| 58155 | PTBP2 | HTA11_99999973899_84307 | Human | Colorectum | MSS | 4.55e-07 | -5.61e-01 | 0.2585 |
| 58155 | PTBP2 | HTA11_99999974143_84620 | Human | Colorectum | MSS | 4.97e-19 | -5.74e-01 | 0.3005 |
| 58155 | PTBP2 | F007 | Human | Colorectum | FAP | 2.15e-03 | -3.27e-01 | 0.1176 |
| 58155 | PTBP2 | A001-C-207 | Human | Colorectum | FAP | 1.78e-08 | -3.49e-01 | 0.1278 |
| 58155 | PTBP2 | A015-C-203 | Human | Colorectum | FAP | 2.44e-33 | -4.76e-01 | -0.1294 |
| Page: 1 2 3 4 5 6 7 |
| Tissue | Expression Dynamics | Abbreviation |
| Cervix |  | CC: Cervix cancer |
| HSIL_HPV: HPV-infected high-grade squamous intraepithelial lesions | ||
| N_HPV: HPV-infected normal cervix | ||
| Colorectum (GSE201348) |  | FAP: Familial adenomatous polyposis |
| CRC: Colorectal cancer | ||
| Colorectum (HTA11) |  | AD: Adenomas |
| SER: Sessile serrated lesions | ||
| MSI-H: Microsatellite-high colorectal cancer | ||
| MSS: Microsatellite stable colorectal cancer | ||
| Endometrium | 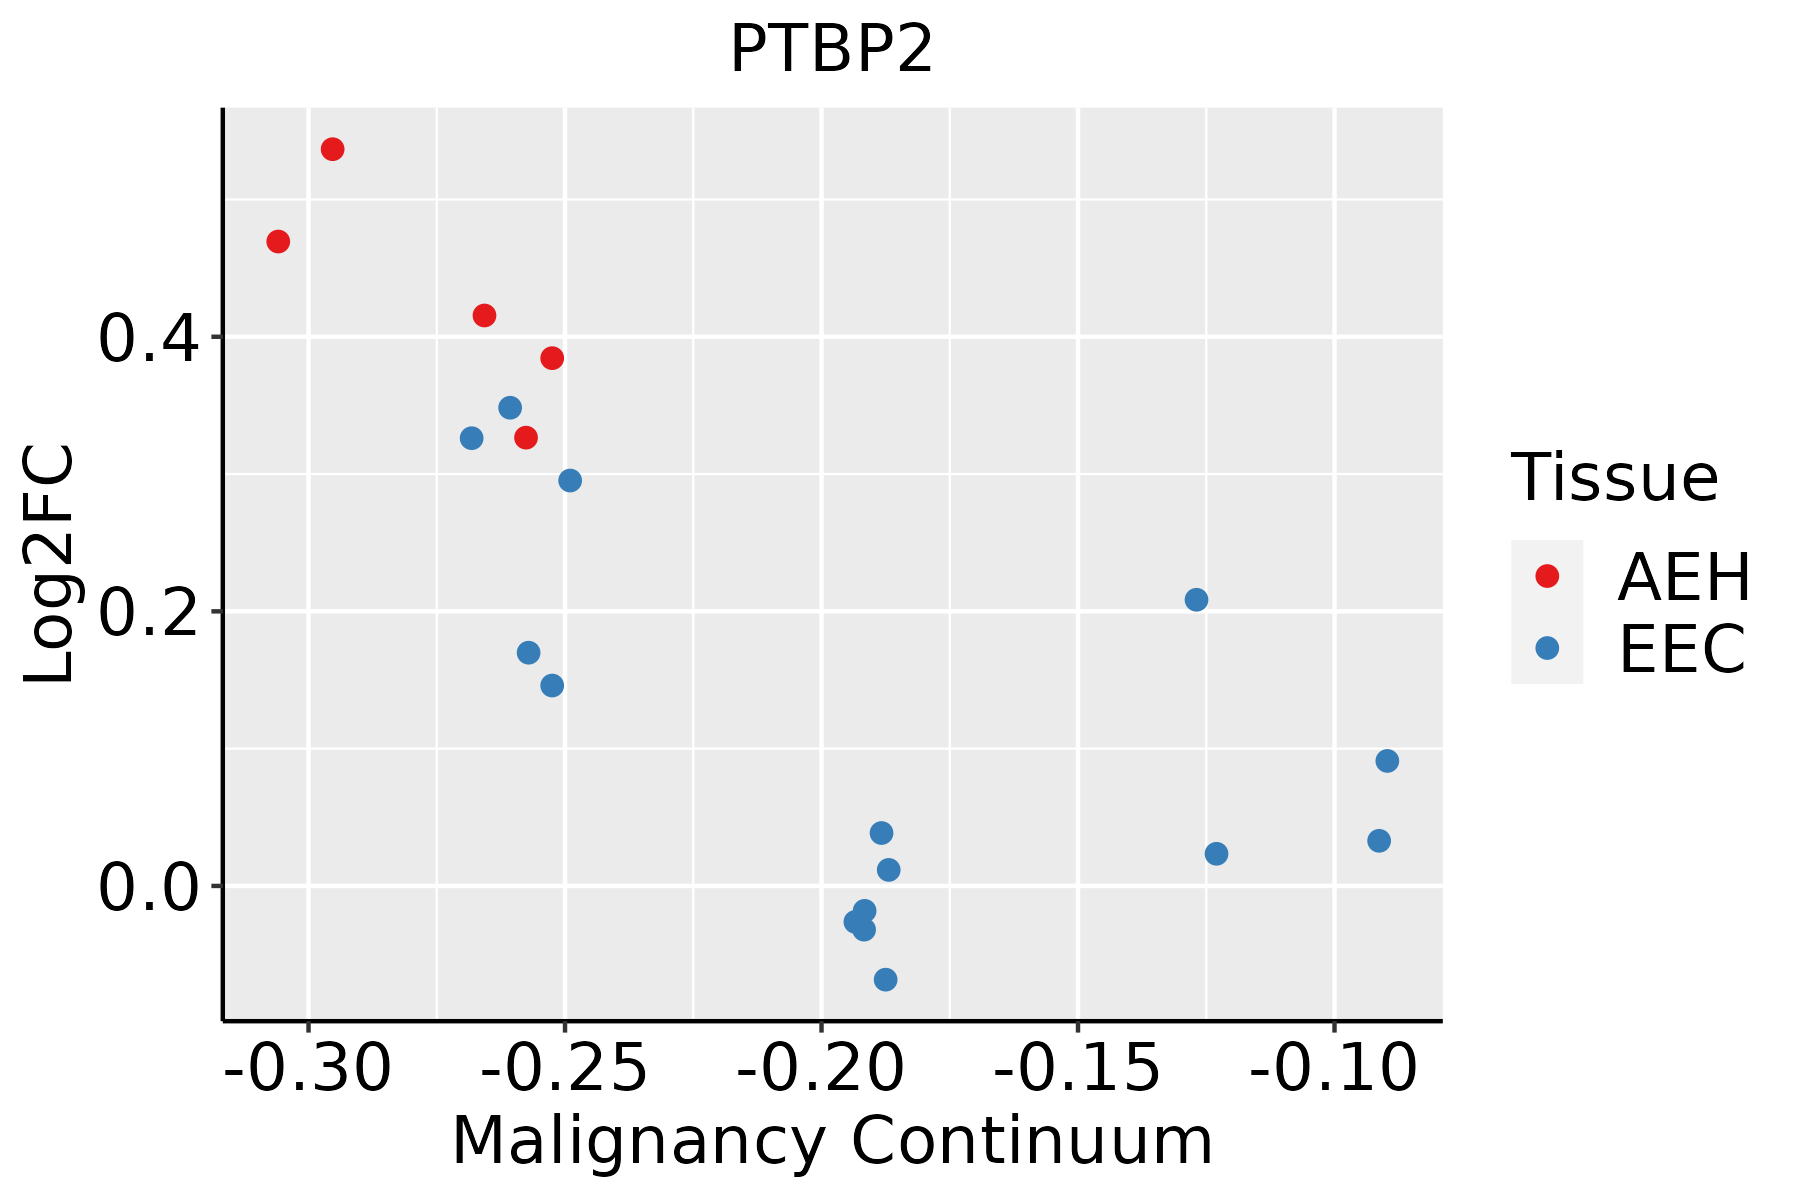 | AEH: Atypical endometrial hyperplasia |
| EEC: Endometrioid Cancer | ||
| Esophagus | 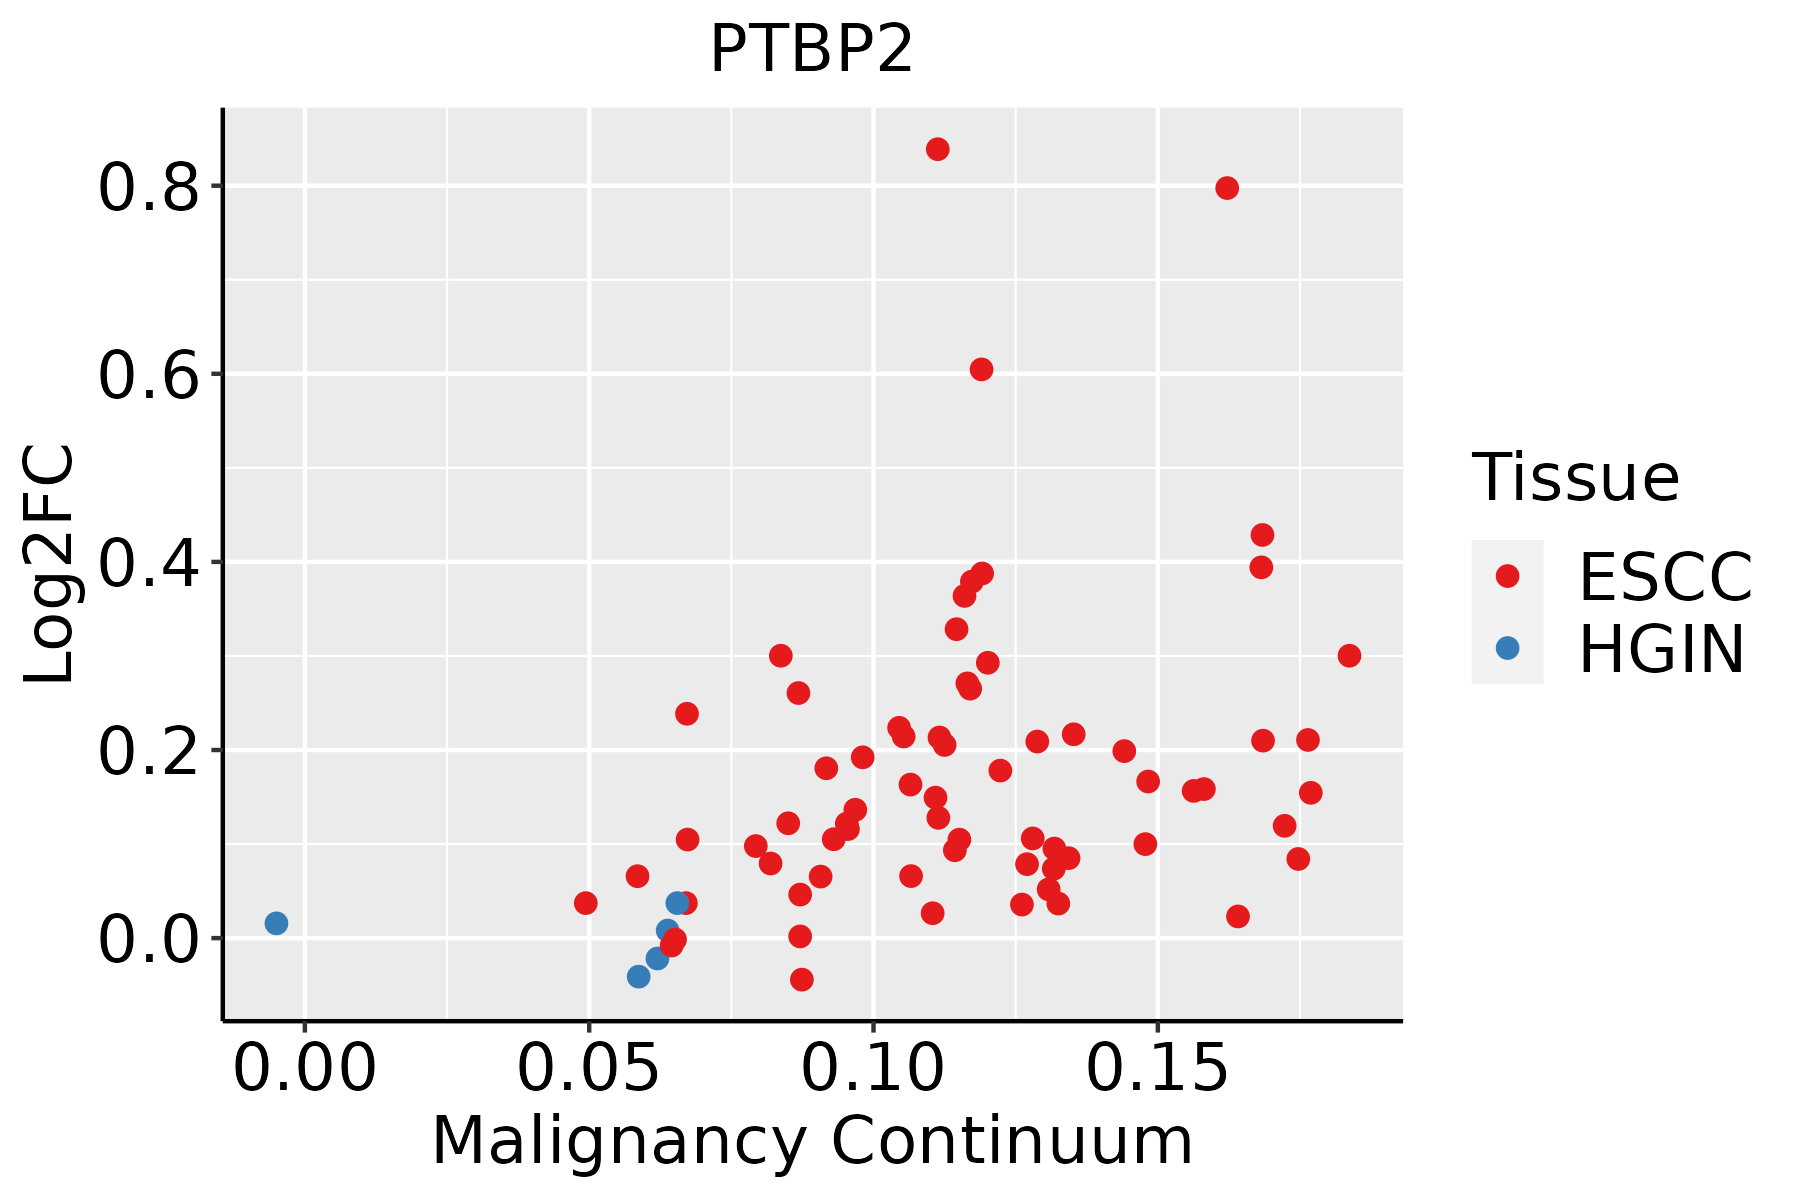 | ESCC: Esophageal squamous cell carcinoma |
| HGIN: High-grade intraepithelial neoplasias | ||
| LGIN: Low-grade intraepithelial neoplasias | ||
| Liver | 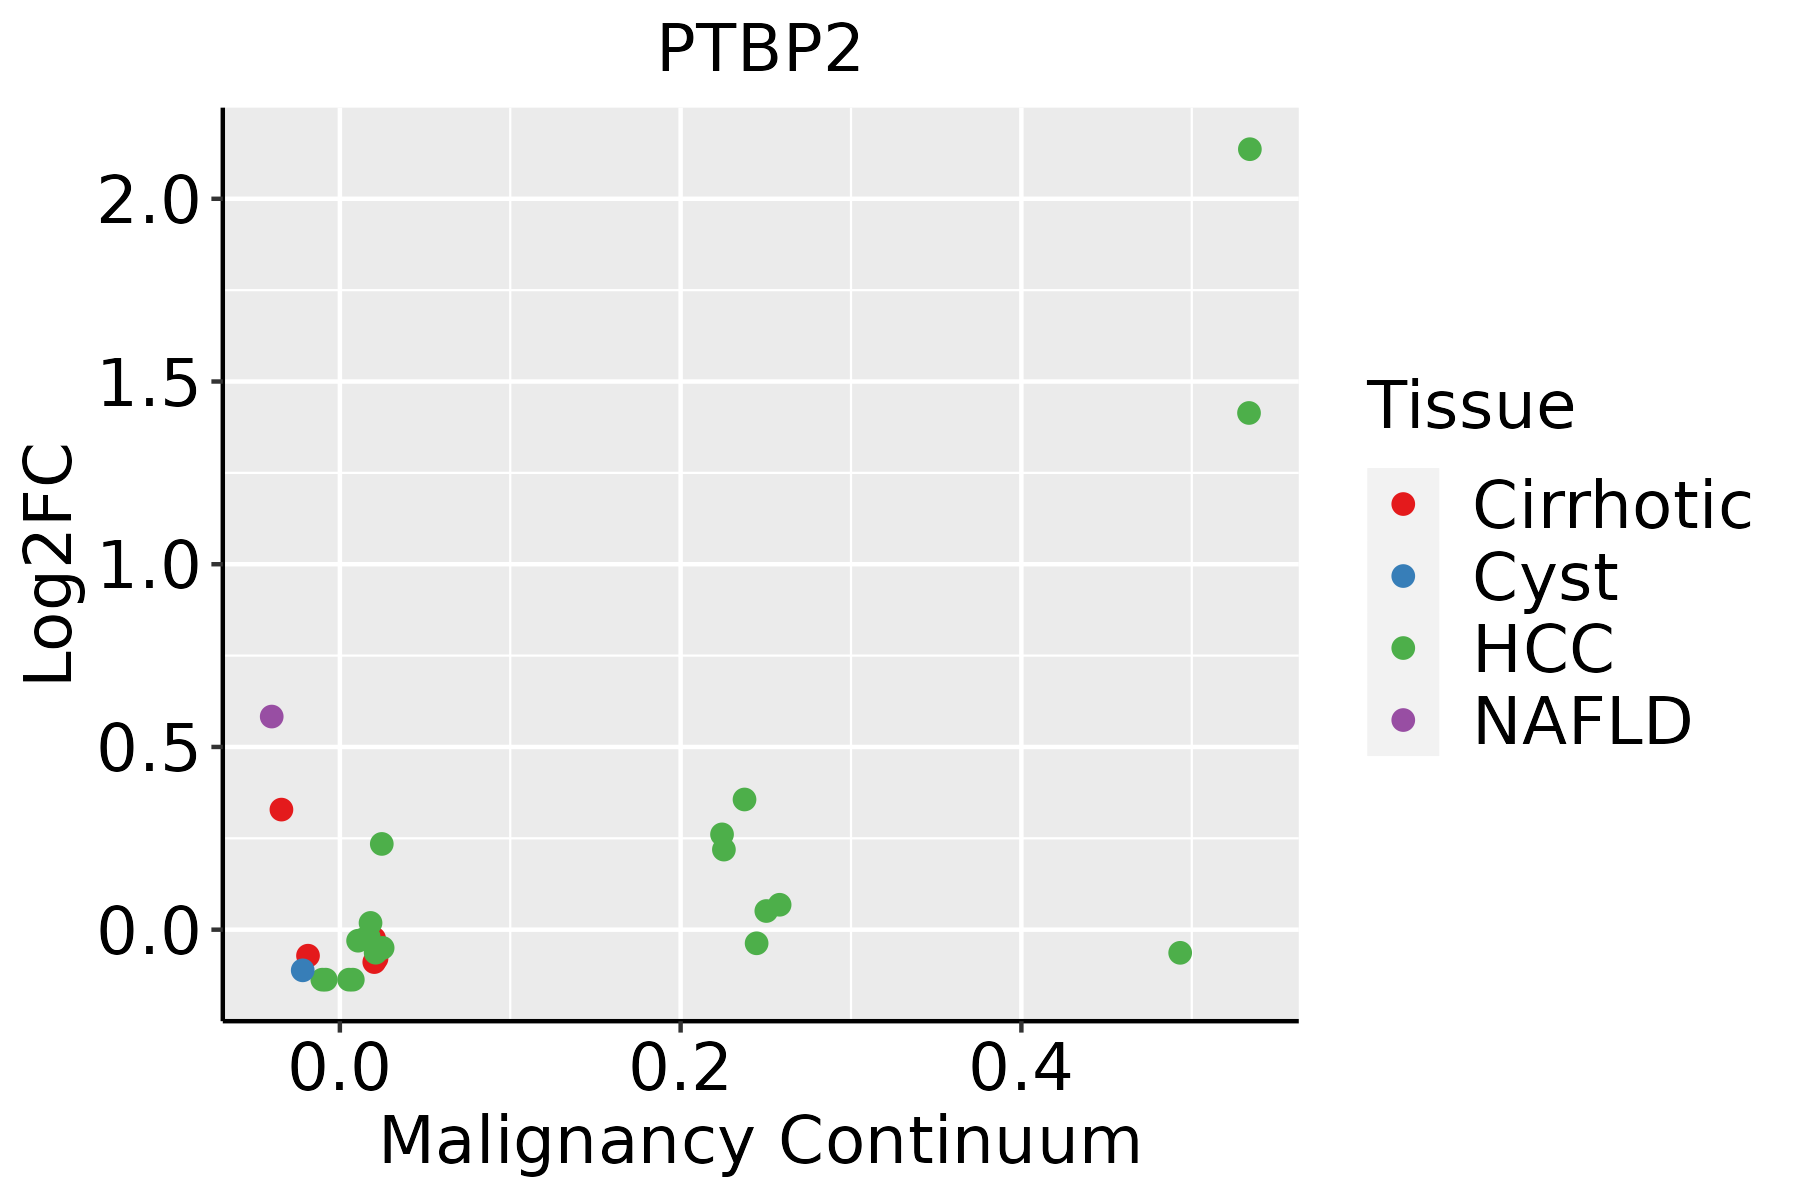 | HCC: Hepatocellular carcinoma |
| NAFLD: Non-alcoholic fatty liver disease | ||
| Lung | 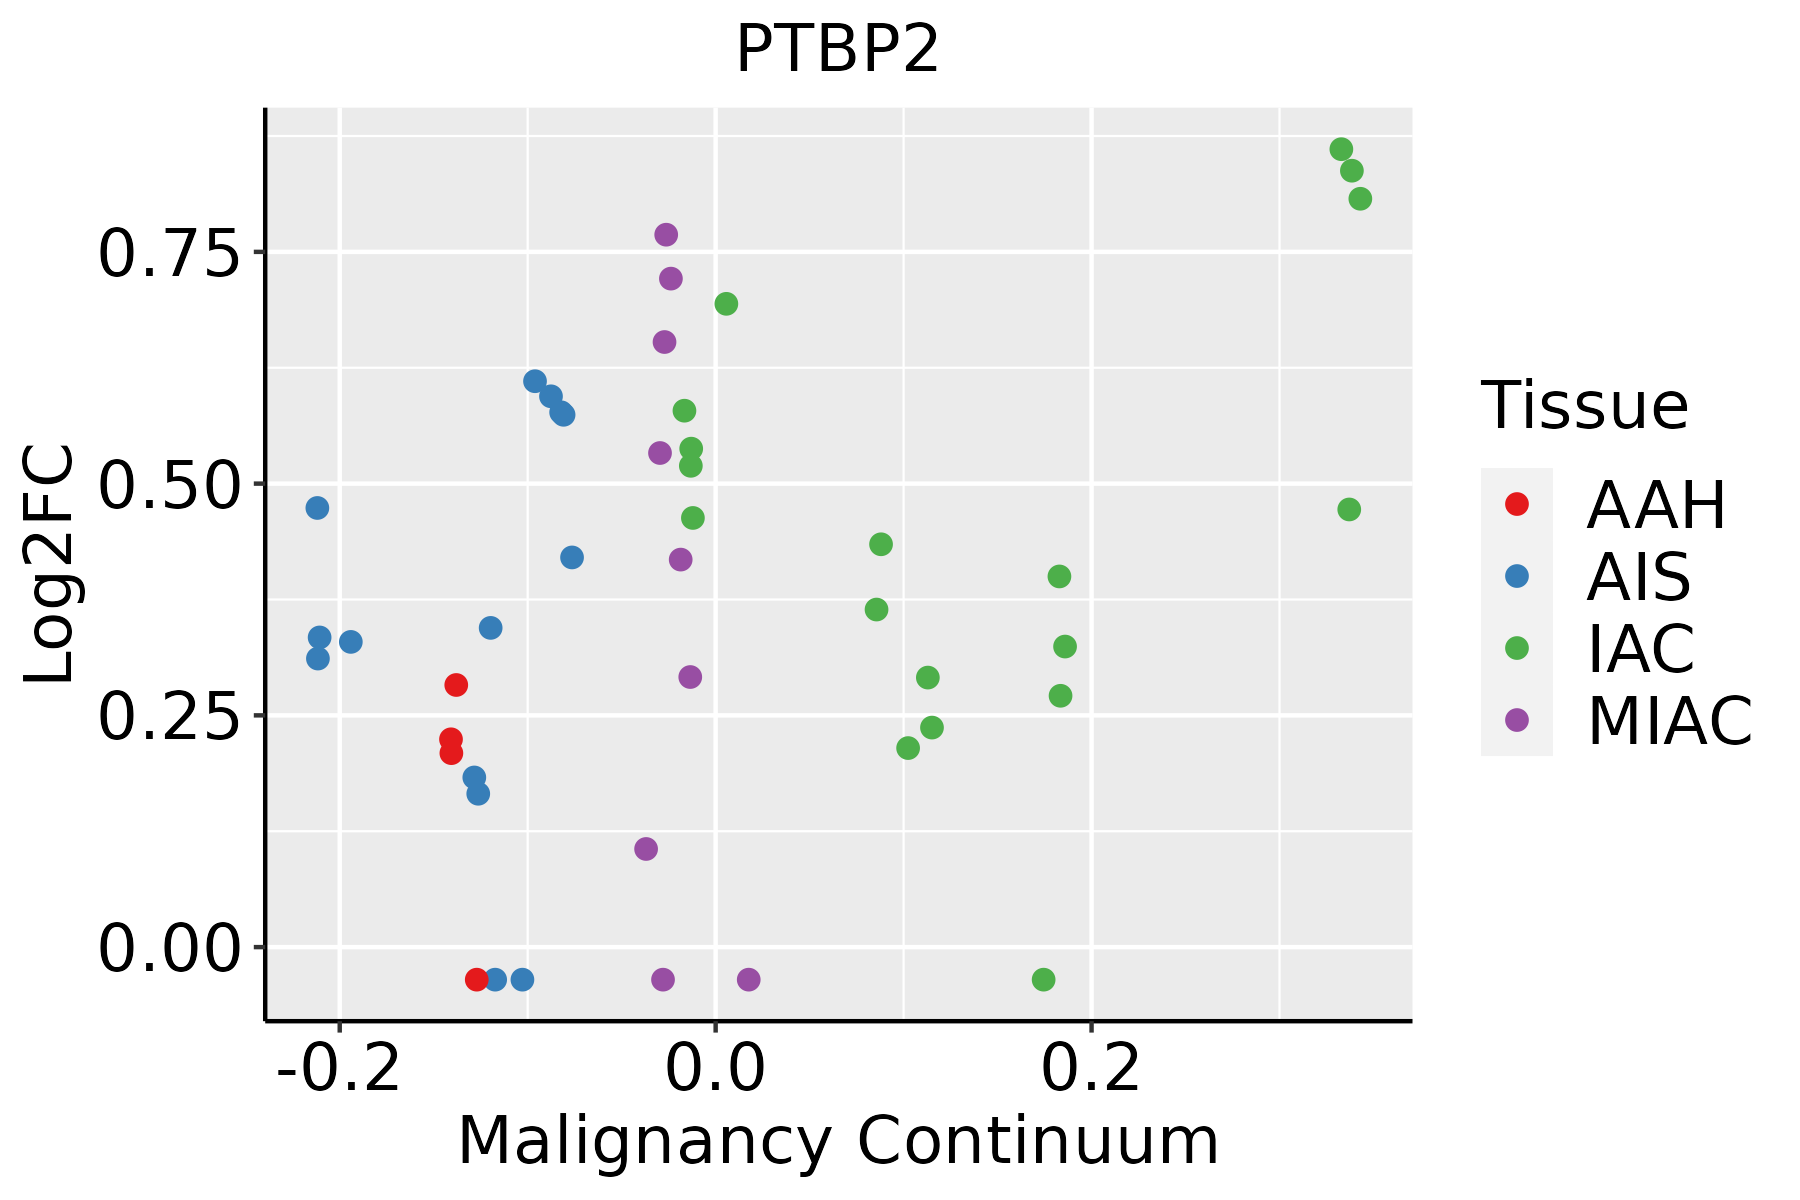 | AAH: Atypical adenomatous hyperplasia |
| AIS: Adenocarcinoma in situ | ||
| IAC: Invasive lung adenocarcinoma | ||
| MIA: Minimally invasive adenocarcinoma | ||
| Prostate | 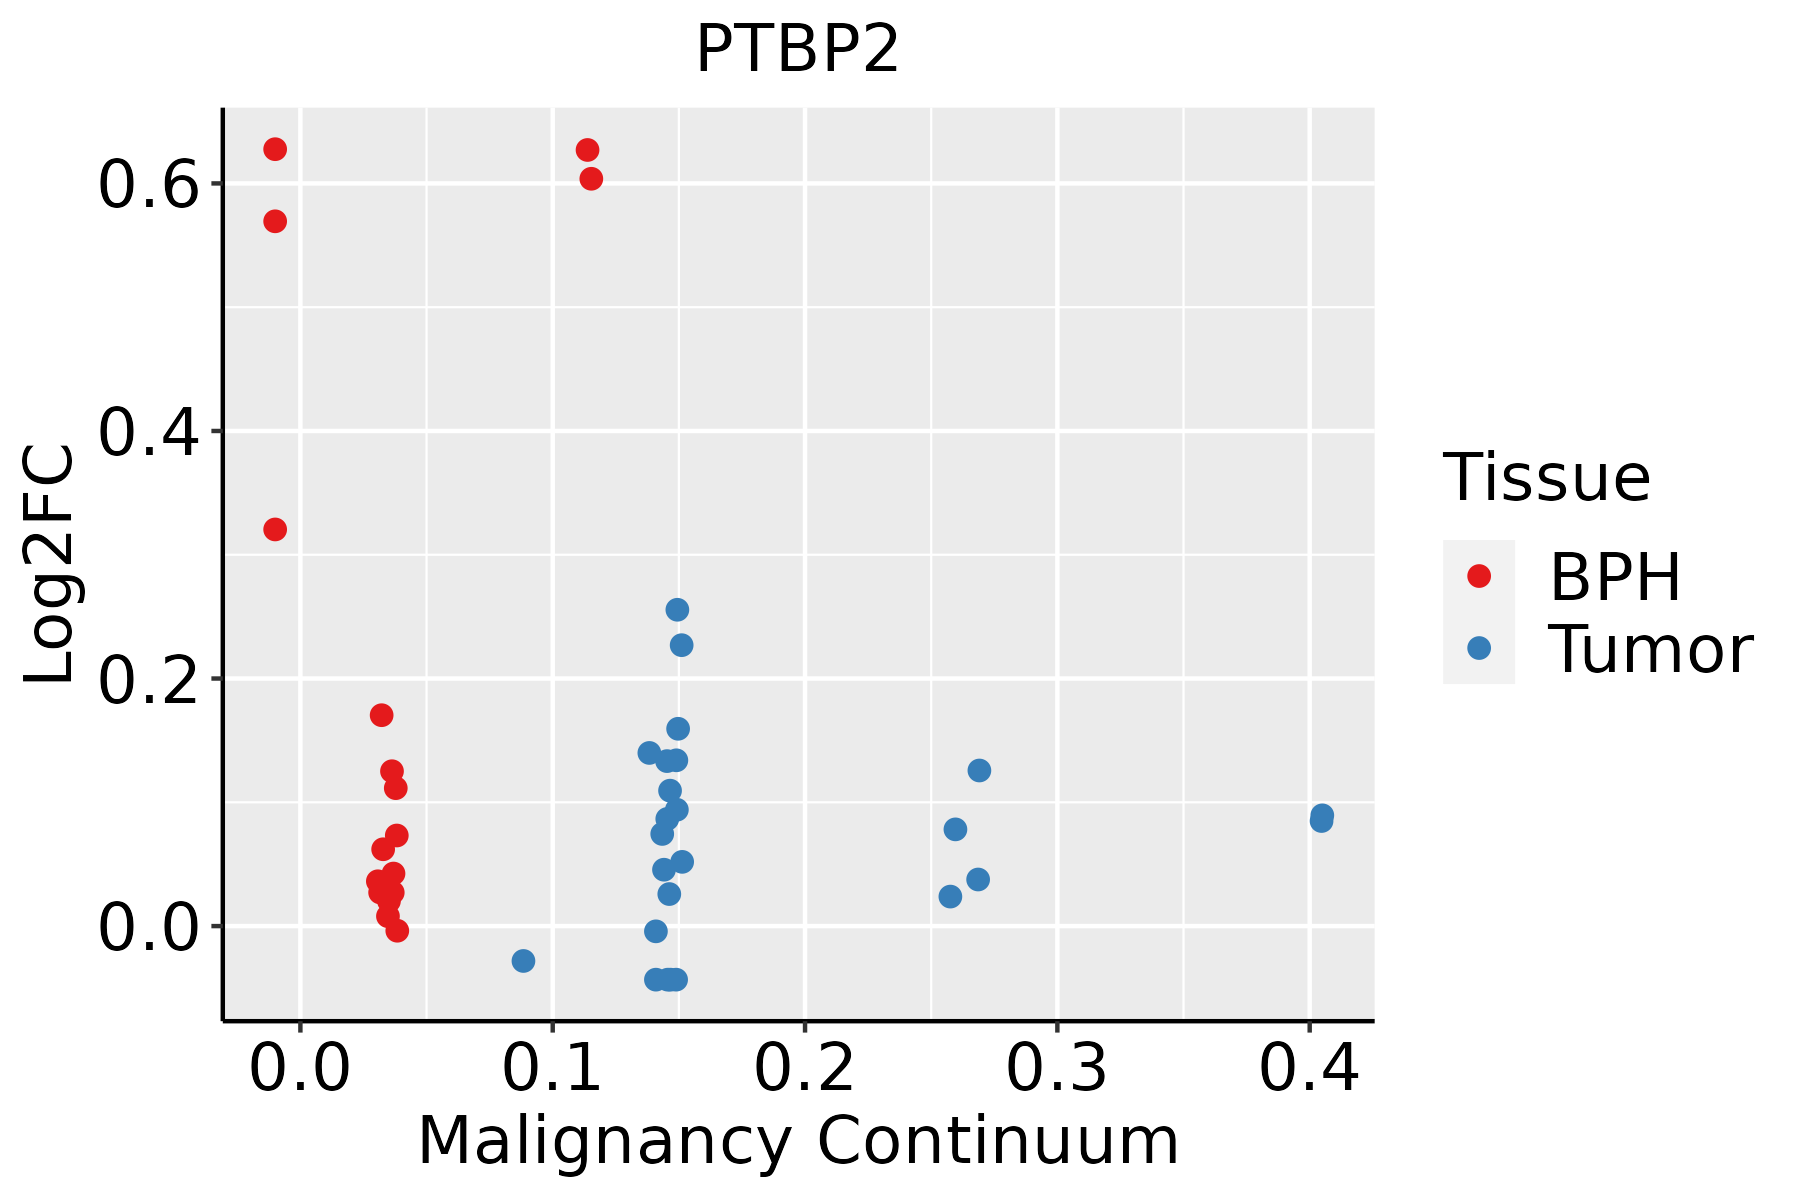 | BPH: Benign Prostatic Hyperplasia |
| ∗log2FC in expression of this searched gene in stem-like cells from each diseased tissue sample relative to stem-like cells in normal samples in each tissue plotted against the malignancy continuum. Samples are colored based on if they are from different disease stage. |
Top |
Malignant transformation related pathway analysis |
| Find out the enriched GO biological processes and KEGG pathways involved in transition from healthy to precancer to cancer |
| Tissue | Disease Stage | Enriched GO biological Processes |
| Colorectum | AD |  |
| Colorectum | SER |  |
| Colorectum | MSS |  |
| Colorectum | MSI-H |  |
| Colorectum | FAP |  |
| ∗Top 15 enriched GO BP terms are showed in the bar plot of each disease state in each tissue. Each row represents a significant GO biological process which is colored according to the -log10(p.adjust). |
| Page: 1 2 3 4 5 6 7 8 9 |
| GO ID | Tissue | Disease Stage | Description | Gene Ratio | Bg Ratio | pvalue | p.adjust | Count |
| GO:004348410 | Cervix | CC | regulation of RNA splicing | 42/2311 | 148/18723 | 1.25e-07 | 6.24e-06 | 42 |
| GO:003311910 | Cervix | CC | negative regulation of RNA splicing | 13/2311 | 25/18723 | 1.83e-06 | 5.89e-05 | 13 |
| GO:000838010 | Cervix | CC | RNA splicing | 76/2311 | 434/18723 | 9.79e-04 | 8.19e-03 | 76 |
| GO:0008380 | Colorectum | AD | RNA splicing | 169/3918 | 434/18723 | 3.59e-18 | 2.04e-15 | 169 |
| GO:0043484 | Colorectum | AD | regulation of RNA splicing | 70/3918 | 148/18723 | 6.47e-13 | 1.16e-10 | 70 |
| GO:0033119 | Colorectum | AD | negative regulation of RNA splicing | 15/3918 | 25/18723 | 2.37e-05 | 4.62e-04 | 15 |
| GO:00083801 | Colorectum | SER | RNA splicing | 123/2897 | 434/18723 | 3.84e-12 | 8.41e-10 | 123 |
| GO:00434841 | Colorectum | SER | regulation of RNA splicing | 49/2897 | 148/18723 | 7.02e-08 | 4.49e-06 | 49 |
| GO:00331191 | Colorectum | SER | negative regulation of RNA splicing | 12/2897 | 25/18723 | 1.32e-04 | 2.66e-03 | 12 |
| GO:00083802 | Colorectum | MSS | RNA splicing | 159/3467 | 434/18723 | 1.75e-19 | 1.22e-16 | 159 |
| GO:00434842 | Colorectum | MSS | regulation of RNA splicing | 66/3467 | 148/18723 | 2.44e-13 | 5.25e-11 | 66 |
| GO:00331192 | Colorectum | MSS | negative regulation of RNA splicing | 14/3467 | 25/18723 | 3.07e-05 | 6.18e-04 | 14 |
| GO:00434844 | Colorectum | FAP | regulation of RNA splicing | 53/2622 | 148/18723 | 2.16e-11 | 1.02e-08 | 53 |
| GO:00083804 | Colorectum | FAP | RNA splicing | 108/2622 | 434/18723 | 7.90e-10 | 1.86e-07 | 108 |
| GO:00331194 | Colorectum | FAP | negative regulation of RNA splicing | 11/2622 | 25/18723 | 2.66e-04 | 3.61e-03 | 11 |
| GO:00434845 | Colorectum | CRC | regulation of RNA splicing | 43/2078 | 148/18723 | 1.75e-09 | 5.31e-07 | 43 |
| GO:00083805 | Colorectum | CRC | RNA splicing | 90/2078 | 434/18723 | 2.80e-09 | 7.97e-07 | 90 |
| GO:00331195 | Colorectum | CRC | negative regulation of RNA splicing | 8/2078 | 25/18723 | 4.33e-03 | 3.47e-02 | 8 |
| GO:000838016 | Endometrium | AEH | RNA splicing | 111/2100 | 434/18723 | 2.42e-17 | 1.12e-14 | 111 |
| GO:004348416 | Endometrium | AEH | regulation of RNA splicing | 55/2100 | 148/18723 | 1.28e-16 | 5.49e-14 | 55 |
| Page: 1 2 3 |
| Pathway ID | Tissue | Disease Stage | Description | Gene Ratio | Bg Ratio | pvalue | p.adjust | qvalue | Count |
| Page: 1 |
Top |
Cell-cell communication analysis |
| Identification of potential cell-cell interactions between two cell types and their ligand-receptor pairs for different disease states |
| Ligand | Receptor | LRpair | Pathway | Tissue | Disease Stage |
| Page: 1 |
Top |
Single-cell gene regulatory network inference analysis |
| Find out the significant the regulons (TFs) and the target genes of each regulon across cell types for different disease states |
| TF | Cell Type | Tissue | Disease Stage | Target Gene | RSS | Regulon Activity |
| ∗The dot plots of a searched regulon are shown for all cell subpopulations in each disease state of each tissue based on the regulon specific score inferred using pySCENIC and by calculating the average expression. |
| Page: 1 |
Top |
Somatic mutation of malignant transformation related genes |
| Annotation of somatic variants for genes involved in malignant transformation |
| Hugo Symbol | Variant Class | Variant Classification | dbSNP RS | HGVSc | HGVSp | HGVSp Short | SWISSPROT | BIOTYPE | SIFT | PolyPhen | Tumor Sample Barcode | Tissue | Histology | Sex | Age | Stage | Therapy Types | Drugs | Outcome |
| PTBP2 | SNV | Missense_Mutation | c.769C>G | p.Leu257Val | p.L257V | Q9UKA9 | protein_coding | deleterious(0.02) | possibly_damaging(0.53) | TCGA-A2-A0D2-01 | Breast | breast invasive carcinoma | Female | <65 | I/II | Chemotherapy | adriamycin | SD | |
| PTBP2 | SNV | Missense_Mutation | c.191G>A | p.Arg64Gln | p.R64Q | Q9UKA9 | protein_coding | deleterious(0.03) | probably_damaging(0.979) | TCGA-AN-A046-01 | Breast | breast invasive carcinoma | Female | >=65 | I/II | Unknown | Unknown | SD | |
| PTBP2 | SNV | Missense_Mutation | c.1303G>A | p.Asp435Asn | p.D435N | Q9UKA9 | protein_coding | deleterious(0) | probably_damaging(0.958) | TCGA-AN-A046-01 | Breast | breast invasive carcinoma | Female | >=65 | I/II | Unknown | Unknown | SD | |
| PTBP2 | SNV | Missense_Mutation | novel | c.594N>A | p.His198Gln | p.H198Q | Q9UKA9 | protein_coding | tolerated(0.18) | benign(0.007) | TCGA-B6-A409-01 | Breast | breast invasive carcinoma | Female | <65 | III/IV | Chemotherapy | cyclophosphamide | PD |
| PTBP2 | insertion | Frame_Shift_Ins | novel | c.1556_1557insGCCTCTG | p.Asn519LysfsTer5 | p.N519Kfs*5 | Q9UKA9 | protein_coding | TCGA-A8-A07J-01 | Breast | breast invasive carcinoma | Female | <65 | I/II | Chemotherapy | 5-fluorouracil | CR | ||
| PTBP2 | insertion | Nonsense_Mutation | novel | c.1558_1559insAATATGAACATTAGCTTATTTTATCCATTTA | p.Tyr520Ter | p.Y520* | Q9UKA9 | protein_coding | TCGA-A8-A07J-01 | Breast | breast invasive carcinoma | Female | <65 | I/II | Chemotherapy | 5-fluorouracil | CR | ||
| PTBP2 | SNV | Missense_Mutation | novel | c.592N>T | p.His198Tyr | p.H198Y | Q9UKA9 | protein_coding | tolerated(0.37) | benign(0.012) | TCGA-MA-AA41-01 | Cervix | cervical & endocervical cancer | Female | <65 | I/II | Unknown | Unknown | SD |
| PTBP2 | SNV | Missense_Mutation | c.667C>G | p.Leu223Val | p.L223V | Q9UKA9 | protein_coding | tolerated(0.16) | benign(0.007) | TCGA-A6-5661-01 | Colorectum | colon adenocarcinoma | Female | >=65 | I/II | Unknown | Unknown | SD | |
| PTBP2 | SNV | Missense_Mutation | c.1319N>T | p.Pro440Leu | p.P440L | Q9UKA9 | protein_coding | deleterious(0.04) | probably_damaging(0.947) | TCGA-AA-3492-01 | Colorectum | colon adenocarcinoma | Female | >=65 | I/II | Unknown | Unknown | SD | |
| PTBP2 | SNV | Missense_Mutation | c.1378N>A | p.Ala460Thr | p.A460T | Q9UKA9 | protein_coding | deleterious(0.01) | benign(0.053) | TCGA-AA-3672-01 | Colorectum | colon adenocarcinoma | Female | >=65 | III/IV | Unknown | Unknown | SD |
| Page: 1 2 3 4 5 6 7 8 9 |
Top |
Related drugs of malignant transformation related genes |
| Identification of chemicals and drugs interact with genes involved in malignant transfromation |
| (DGIdb 4.0) |
| Entrez ID | Symbol | Category | Interaction Types | Drug Claim Name | Drug Name | PMIDs |
| Page: 1 |

Copyright 2023-Present -The University of Texas Health Science Center at Houston |