
|
|||||
|
 | |
| |
| |
| |
| |
| |
|
Gene: PSTPIP2 |
Gene summary for PSTPIP2 |
| Gene information | Species | Human | Gene symbol | PSTPIP2 | Gene ID | 9050 |
| Gene name | proline-serine-threonine phosphatase interacting protein 2 | |
| Gene Alias | MAYP | |
| Cytomap | 18q21.1 | |
| Gene Type | protein-coding | GO ID | GO:0006928 | UniProtAcc | A0A0S2Z4R2 |
Top |
Malignant transformation analysis |
| Identification of the aberrant gene expression in precancerous and cancerous lesions by comparing the gene expression of stem-like cells in diseased tissues with normal stem cells |
| Entrez ID | Symbol | Replicates | Species | Organ | Tissue | Adj P-value | Log2FC | Malignancy |
| 9050 | PSTPIP2 | LZE4T | Human | Esophagus | ESCC | 1.17e-02 | 2.81e-02 | 0.0811 |
| 9050 | PSTPIP2 | LZE7T | Human | Esophagus | ESCC | 5.67e-07 | 5.17e-01 | 0.0667 |
| 9050 | PSTPIP2 | LZE24T | Human | Esophagus | ESCC | 1.84e-02 | 8.18e-02 | 0.0596 |
| 9050 | PSTPIP2 | P1T-E | Human | Esophagus | ESCC | 2.39e-03 | 2.35e-01 | 0.0875 |
| 9050 | PSTPIP2 | P2T-E | Human | Esophagus | ESCC | 3.68e-58 | 1.09e+00 | 0.1177 |
| 9050 | PSTPIP2 | P4T-E | Human | Esophagus | ESCC | 9.75e-10 | 2.25e-01 | 0.1323 |
| 9050 | PSTPIP2 | P5T-E | Human | Esophagus | ESCC | 3.86e-22 | 4.27e-01 | 0.1327 |
| 9050 | PSTPIP2 | P8T-E | Human | Esophagus | ESCC | 4.03e-08 | 5.44e-02 | 0.0889 |
| 9050 | PSTPIP2 | P9T-E | Human | Esophagus | ESCC | 6.35e-18 | 4.24e-01 | 0.1131 |
| 9050 | PSTPIP2 | P11T-E | Human | Esophagus | ESCC | 1.33e-06 | 2.47e-01 | 0.1426 |
| 9050 | PSTPIP2 | P12T-E | Human | Esophagus | ESCC | 3.01e-15 | 3.17e-01 | 0.1122 |
| 9050 | PSTPIP2 | P16T-E | Human | Esophagus | ESCC | 1.59e-15 | 2.32e-01 | 0.1153 |
| 9050 | PSTPIP2 | P17T-E | Human | Esophagus | ESCC | 2.45e-03 | 3.26e-01 | 0.1278 |
| 9050 | PSTPIP2 | P21T-E | Human | Esophagus | ESCC | 2.01e-05 | 1.42e-01 | 0.1617 |
| 9050 | PSTPIP2 | P22T-E | Human | Esophagus | ESCC | 5.49e-07 | 8.39e-02 | 0.1236 |
| 9050 | PSTPIP2 | P23T-E | Human | Esophagus | ESCC | 2.64e-18 | 4.42e-01 | 0.108 |
| 9050 | PSTPIP2 | P24T-E | Human | Esophagus | ESCC | 2.04e-07 | 2.42e-01 | 0.1287 |
| 9050 | PSTPIP2 | P26T-E | Human | Esophagus | ESCC | 3.61e-24 | 5.56e-01 | 0.1276 |
| 9050 | PSTPIP2 | P30T-E | Human | Esophagus | ESCC | 1.19e-02 | 1.68e-01 | 0.137 |
| 9050 | PSTPIP2 | P31T-E | Human | Esophagus | ESCC | 5.27e-11 | 2.58e-01 | 0.1251 |
| Page: 1 2 3 |
| Tissue | Expression Dynamics | Abbreviation |
| Esophagus | 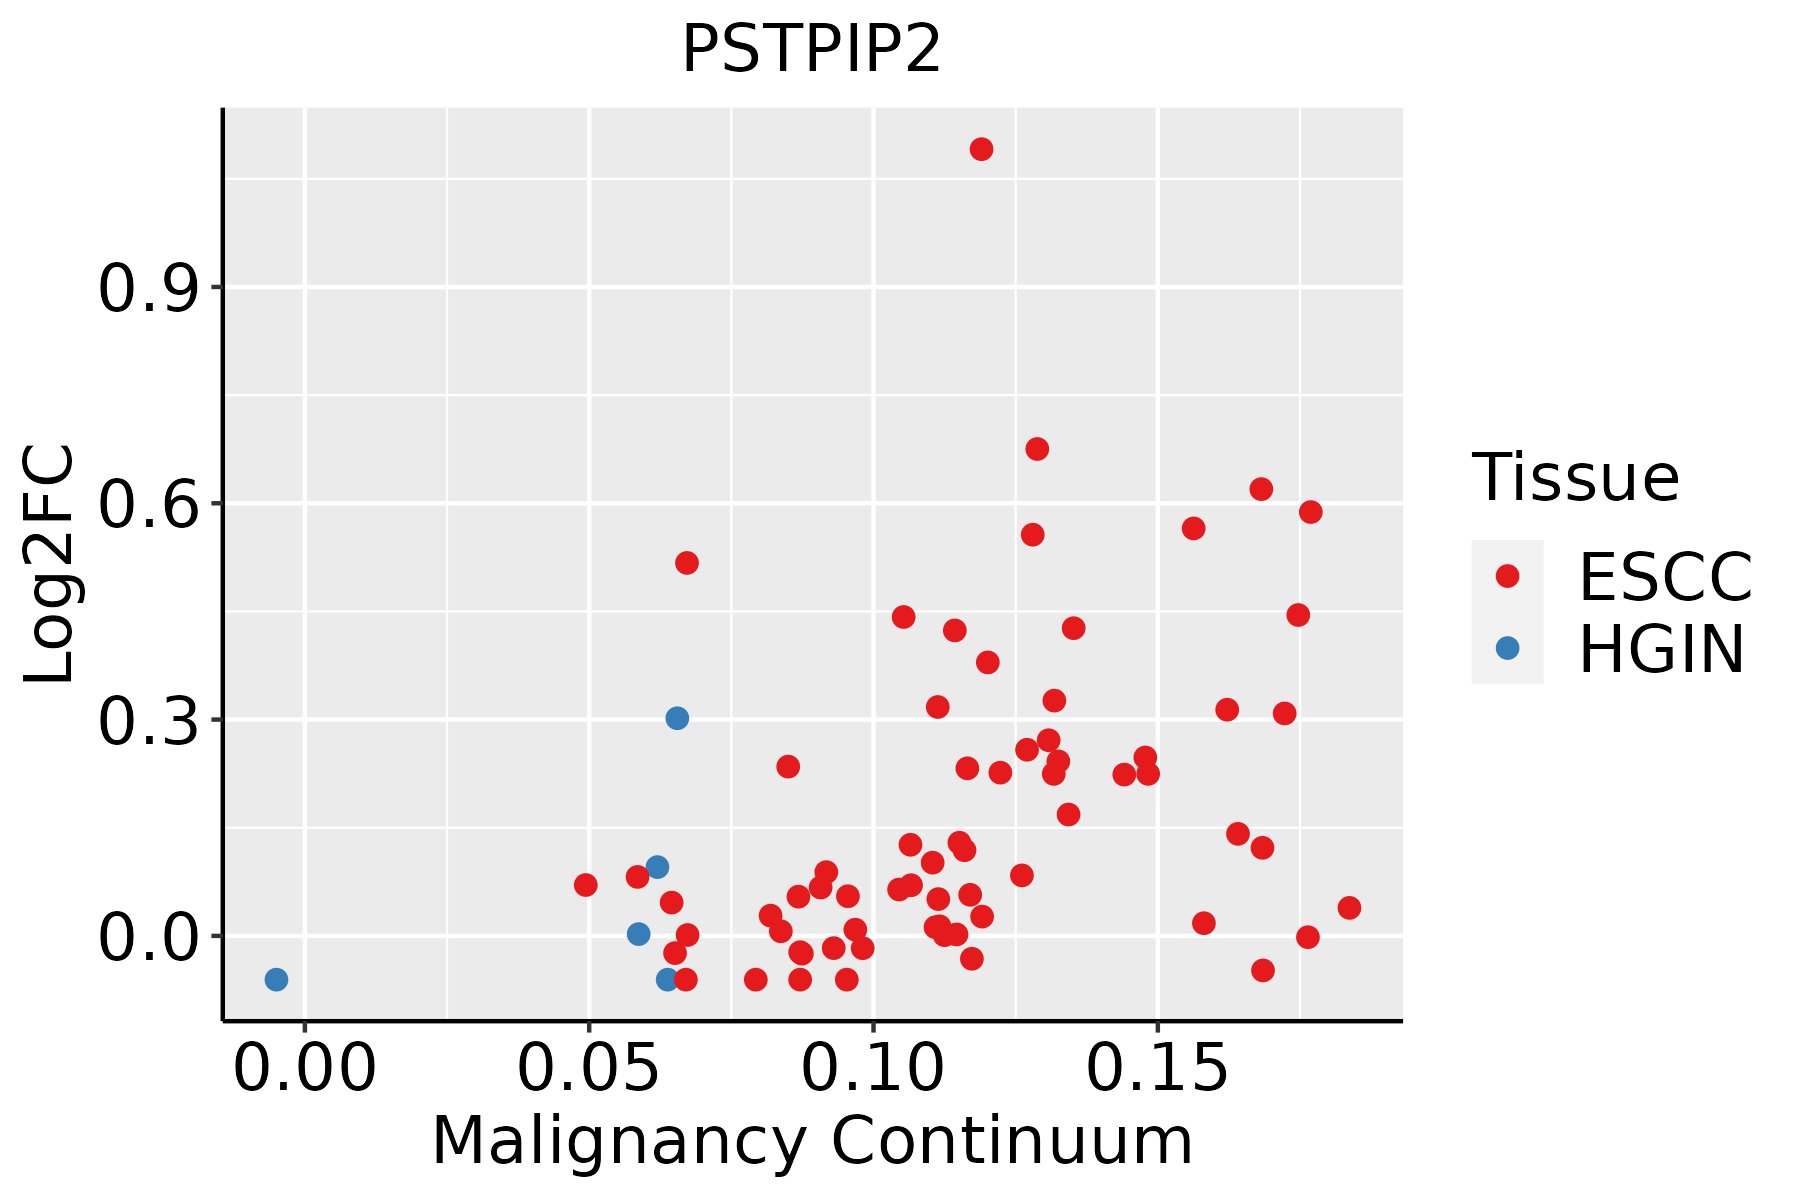 | ESCC: Esophageal squamous cell carcinoma |
| HGIN: High-grade intraepithelial neoplasias | ||
| LGIN: Low-grade intraepithelial neoplasias | ||
| Oral Cavity | 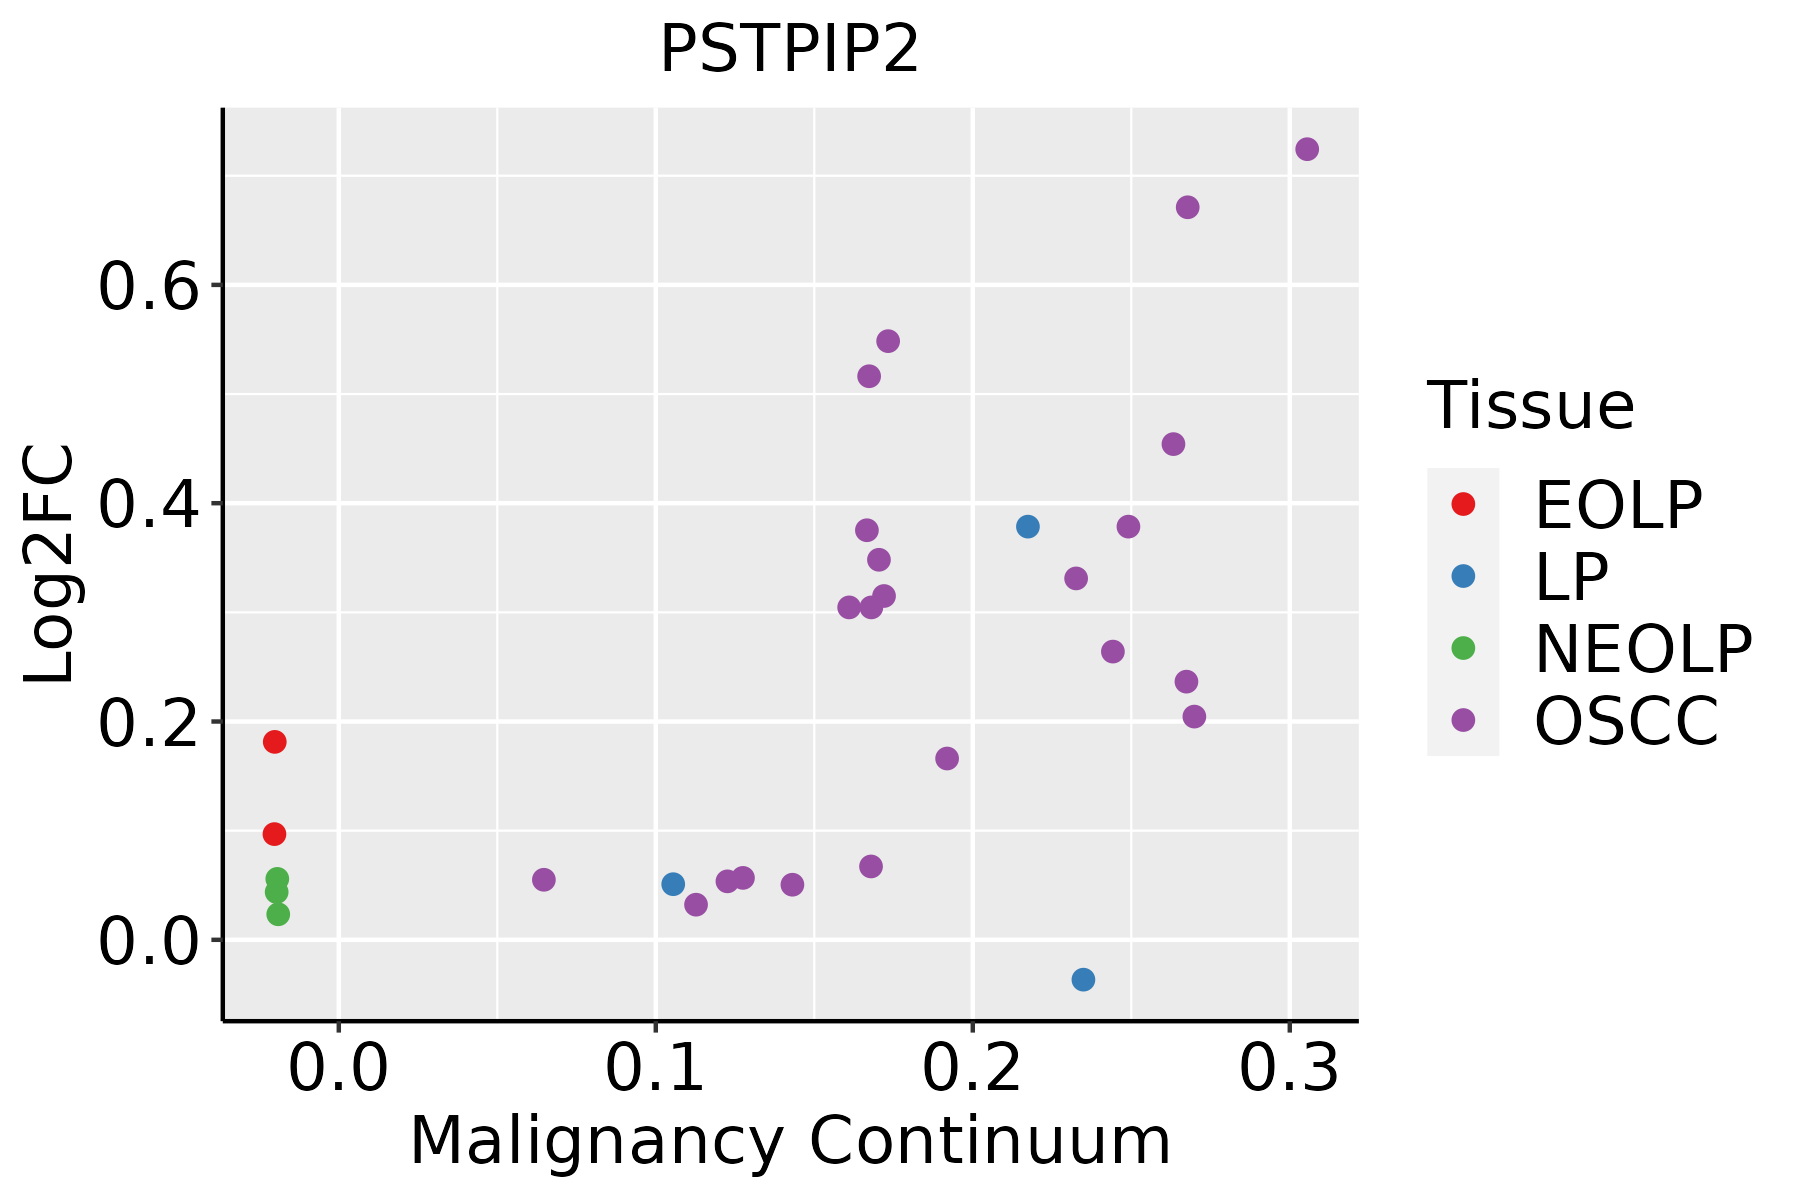 | EOLP: Erosive Oral lichen planus |
| LP: leukoplakia | ||
| NEOLP: Non-erosive oral lichen planus | ||
| OSCC: Oral squamous cell carcinoma |
| ∗log2FC in expression of this searched gene in stem-like cells from each diseased tissue sample relative to stem-like cells in normal samples in each tissue plotted against the malignancy continuum. Samples are colored based on if they are from different disease stage. |
Top |
Malignant transformation related pathway analysis |
| Find out the enriched GO biological processes and KEGG pathways involved in transition from healthy to precancer to cancer |
| Tissue | Disease Stage | Enriched GO biological Processes |
| Colorectum | AD |  |
| Colorectum | SER |  |
| Colorectum | MSS |  |
| Colorectum | MSI-H |  |
| Colorectum | FAP |  |
| ∗Top 15 enriched GO BP terms are showed in the bar plot of each disease state in each tissue. Each row represents a significant GO biological process which is colored according to the -log10(p.adjust). |
| Page: 1 2 3 4 5 6 7 8 9 |
| GO ID | Tissue | Disease Stage | Description | Gene Ratio | Bg Ratio | pvalue | p.adjust | Count |
| GO:0051258111 | Esophagus | ESCC | protein polymerization | 183/8552 | 297/18723 | 1.94e-08 | 3.75e-07 | 183 |
| GO:000701527 | Esophagus | ESCC | actin filament organization | 259/8552 | 442/18723 | 2.37e-08 | 4.50e-07 | 259 |
| GO:000815420 | Esophagus | ESCC | actin polymerization or depolymerization | 130/8552 | 218/18723 | 2.19e-05 | 1.88e-04 | 130 |
| GO:0030041110 | Esophagus | ESCC | actin filament polymerization | 114/8552 | 191/18723 | 6.46e-05 | 4.92e-04 | 114 |
| GO:005125820 | Oral cavity | OSCC | protein polymerization | 169/7305 | 297/18723 | 2.57e-10 | 7.17e-09 | 169 |
| GO:000701520 | Oral cavity | OSCC | actin filament organization | 230/7305 | 442/18723 | 1.37e-08 | 2.77e-07 | 230 |
| GO:000815418 | Oral cavity | OSCC | actin polymerization or depolymerization | 117/7305 | 218/18723 | 7.38e-06 | 8.04e-05 | 117 |
| GO:003004118 | Oral cavity | OSCC | actin filament polymerization | 103/7305 | 191/18723 | 1.94e-05 | 1.87e-04 | 103 |
| GO:000701526 | Oral cavity | EOLP | actin filament organization | 102/2218 | 442/18723 | 1.61e-11 | 2.48e-09 | 102 |
| GO:005125825 | Oral cavity | EOLP | protein polymerization | 74/2218 | 297/18723 | 2.65e-10 | 2.45e-08 | 74 |
| GO:000815424 | Oral cavity | EOLP | actin polymerization or depolymerization | 53/2218 | 218/18723 | 2.08e-07 | 6.55e-06 | 53 |
| GO:003004123 | Oral cavity | EOLP | actin filament polymerization | 48/2218 | 191/18723 | 2.68e-07 | 8.16e-06 | 48 |
| Page: 1 |
| Pathway ID | Tissue | Disease Stage | Description | Gene Ratio | Bg Ratio | pvalue | p.adjust | qvalue | Count |
| Page: 1 |
Top |
Cell-cell communication analysis |
| Identification of potential cell-cell interactions between two cell types and their ligand-receptor pairs for different disease states |
| Ligand | Receptor | LRpair | Pathway | Tissue | Disease Stage |
| Page: 1 |
Top |
Single-cell gene regulatory network inference analysis |
| Find out the significant the regulons (TFs) and the target genes of each regulon across cell types for different disease states |
| TF | Cell Type | Tissue | Disease Stage | Target Gene | RSS | Regulon Activity |
| ∗The dot plots of a searched regulon are shown for all cell subpopulations in each disease state of each tissue based on the regulon specific score inferred using pySCENIC and by calculating the average expression. |
| Page: 1 |
Top |
Somatic mutation of malignant transformation related genes |
| Annotation of somatic variants for genes involved in malignant transformation |
| Hugo Symbol | Variant Class | Variant Classification | dbSNP RS | HGVSc | HGVSp | HGVSp Short | SWISSPROT | BIOTYPE | SIFT | PolyPhen | Tumor Sample Barcode | Tissue | Histology | Sex | Age | Stage | Therapy Types | Drugs | Outcome |
| PSTPIP2 | SNV | Missense_Mutation | rs769993373 | c.925N>A | p.Gly309Arg | p.G309R | Q9H939 | protein_coding | deleterious(0.03) | possibly_damaging(0.88) | TCGA-2W-A8YY-01 | Cervix | cervical & endocervical cancer | Female | <65 | I/II | Chemotherapy | cisplatin | CR |
| PSTPIP2 | SNV | Missense_Mutation | c.82N>G | p.Leu28Val | p.L28V | Q9H939 | protein_coding | deleterious(0) | probably_damaging(0.953) | TCGA-C5-A1BQ-01 | Cervix | cervical & endocervical cancer | Female | >=65 | III/IV | Chemotherapy | cisplatin | CR | |
| PSTPIP2 | SNV | Missense_Mutation | c.82C>G | p.Leu28Val | p.L28V | Q9H939 | protein_coding | deleterious(0) | probably_damaging(0.953) | TCGA-C5-A3HL-01 | Cervix | cervical & endocervical cancer | Female | >=65 | I/II | Unknown | Unknown | SD | |
| PSTPIP2 | SNV | Missense_Mutation | c.512A>G | p.Glu171Gly | p.E171G | Q9H939 | protein_coding | deleterious(0) | possibly_damaging(0.907) | TCGA-HG-A2PA-01 | Cervix | cervical & endocervical cancer | Female | <65 | I/II | Unspecific | Taxol | PD | |
| PSTPIP2 | SNV | Missense_Mutation | rs199673954 | c.547N>A | p.Ala183Thr | p.A183T | Q9H939 | protein_coding | tolerated(0.21) | benign(0.015) | TCGA-5M-AAT6-01 | Colorectum | colon adenocarcinoma | Female | <65 | III/IV | Unknown | Unknown | PD |
| PSTPIP2 | SNV | Missense_Mutation | novel | c.658N>A | p.Glu220Lys | p.E220K | Q9H939 | protein_coding | deleterious(0.02) | benign(0.147) | TCGA-AA-A00N-01 | Colorectum | colon adenocarcinoma | Male | >=65 | I/II | Unknown | Unknown | PD |
| PSTPIP2 | SNV | Missense_Mutation | novel | c.661N>A | p.Cys221Ser | p.C221S | Q9H939 | protein_coding | tolerated(0.47) | benign(0.003) | TCGA-AM-5820-01 | Colorectum | colon adenocarcinoma | Female | <65 | I/II | Unknown | Unknown | SD |
| PSTPIP2 | SNV | Missense_Mutation | c.748N>A | p.Glu250Lys | p.E250K | Q9H939 | protein_coding | deleterious(0) | possibly_damaging(0.536) | TCGA-CA-6717-01 | Colorectum | colon adenocarcinoma | Male | <65 | I/II | Chemotherapy | oxaliplatin | CR | |
| PSTPIP2 | SNV | Missense_Mutation | c.92N>A | p.Gly31Asp | p.G31D | Q9H939 | protein_coding | deleterious(0) | probably_damaging(1) | TCGA-CM-5861-01 | Colorectum | colon adenocarcinoma | Female | <65 | I/II | Unknown | Unknown | PD | |
| PSTPIP2 | SNV | Missense_Mutation | c.971C>A | p.Ser324Tyr | p.S324Y | Q9H939 | protein_coding | deleterious(0) | possibly_damaging(0.525) | TCGA-AG-A002-01 | Colorectum | rectum adenocarcinoma | Male | <65 | I/II | Unknown | Unknown | SD |
| Page: 1 2 3 4 |
Top |
Related drugs of malignant transformation related genes |
| Identification of chemicals and drugs interact with genes involved in malignant transfromation |
| (DGIdb 4.0) |
| Entrez ID | Symbol | Category | Interaction Types | Drug Claim Name | Drug Name | PMIDs |
| Page: 1 |

Copyright 2023-Present -The University of Texas Health Science Center at Houston |