
|
|||||
|
 | |
| |
| |
| |
| |
| |
|
Gene: PSRC1 |
Gene summary for PSRC1 |
| Gene information | Species | Human | Gene symbol | PSRC1 | Gene ID | 84722 |
| Gene name | proline and serine rich coiled-coil 1 | |
| Gene Alias | DDA3 | |
| Cytomap | 1p13.3 | |
| Gene Type | protein-coding | GO ID | GO:0000070 | UniProtAcc | Q6PGN9 |
Top |
Malignant transformation analysis |
| Identification of the aberrant gene expression in precancerous and cancerous lesions by comparing the gene expression of stem-like cells in diseased tissues with normal stem cells |
| Entrez ID | Symbol | Replicates | Species | Organ | Tissue | Adj P-value | Log2FC | Malignancy |
| 84722 | PSRC1 | P2T-E | Human | Esophagus | ESCC | 8.69e-03 | 1.94e-01 | 0.1177 |
| 84722 | PSRC1 | P4T-E | Human | Esophagus | ESCC | 2.81e-07 | 1.86e-01 | 0.1323 |
| 84722 | PSRC1 | P9T-E | Human | Esophagus | ESCC | 1.11e-03 | 1.72e-01 | 0.1131 |
| 84722 | PSRC1 | P17T-E | Human | Esophagus | ESCC | 1.49e-05 | 3.11e-01 | 0.1278 |
| 84722 | PSRC1 | P20T-E | Human | Esophagus | ESCC | 1.17e-04 | 1.36e-01 | 0.1124 |
| 84722 | PSRC1 | P23T-E | Human | Esophagus | ESCC | 1.14e-03 | 1.52e-01 | 0.108 |
| 84722 | PSRC1 | P32T-E | Human | Esophagus | ESCC | 3.27e-08 | 2.58e-01 | 0.1666 |
| 84722 | PSRC1 | P37T-E | Human | Esophagus | ESCC | 6.65e-04 | 1.35e-01 | 0.1371 |
| 84722 | PSRC1 | P38T-E | Human | Esophagus | ESCC | 1.93e-04 | 2.87e-01 | 0.127 |
| 84722 | PSRC1 | P48T-E | Human | Esophagus | ESCC | 7.33e-04 | 1.12e-01 | 0.0959 |
| 84722 | PSRC1 | P52T-E | Human | Esophagus | ESCC | 8.70e-03 | 1.34e-01 | 0.1555 |
| 84722 | PSRC1 | P62T-E | Human | Esophagus | ESCC | 1.20e-02 | 1.34e-01 | 0.1302 |
| 84722 | PSRC1 | P74T-E | Human | Esophagus | ESCC | 4.85e-08 | 3.89e-01 | 0.1479 |
| 84722 | PSRC1 | P76T-E | Human | Esophagus | ESCC | 3.20e-02 | 2.11e-01 | 0.1207 |
| 84722 | PSRC1 | P83T-E | Human | Esophagus | ESCC | 2.62e-07 | 3.29e-01 | 0.1738 |
| 84722 | PSRC1 | P89T-E | Human | Esophagus | ESCC | 4.36e-04 | 4.56e-01 | 0.1752 |
| 84722 | PSRC1 | P91T-E | Human | Esophagus | ESCC | 8.74e-05 | 1.07e+00 | 0.1828 |
| 84722 | PSRC1 | P107T-E | Human | Esophagus | ESCC | 3.13e-05 | 1.54e-01 | 0.171 |
| 84722 | PSRC1 | P130T-E | Human | Esophagus | ESCC | 6.24e-10 | 5.05e-01 | 0.1676 |
| 84722 | PSRC1 | HCC1_Meng | Human | Liver | HCC | 1.32e-02 | 3.87e-03 | 0.0246 |
| Page: 1 2 |
| Tissue | Expression Dynamics | Abbreviation |
| Esophagus | 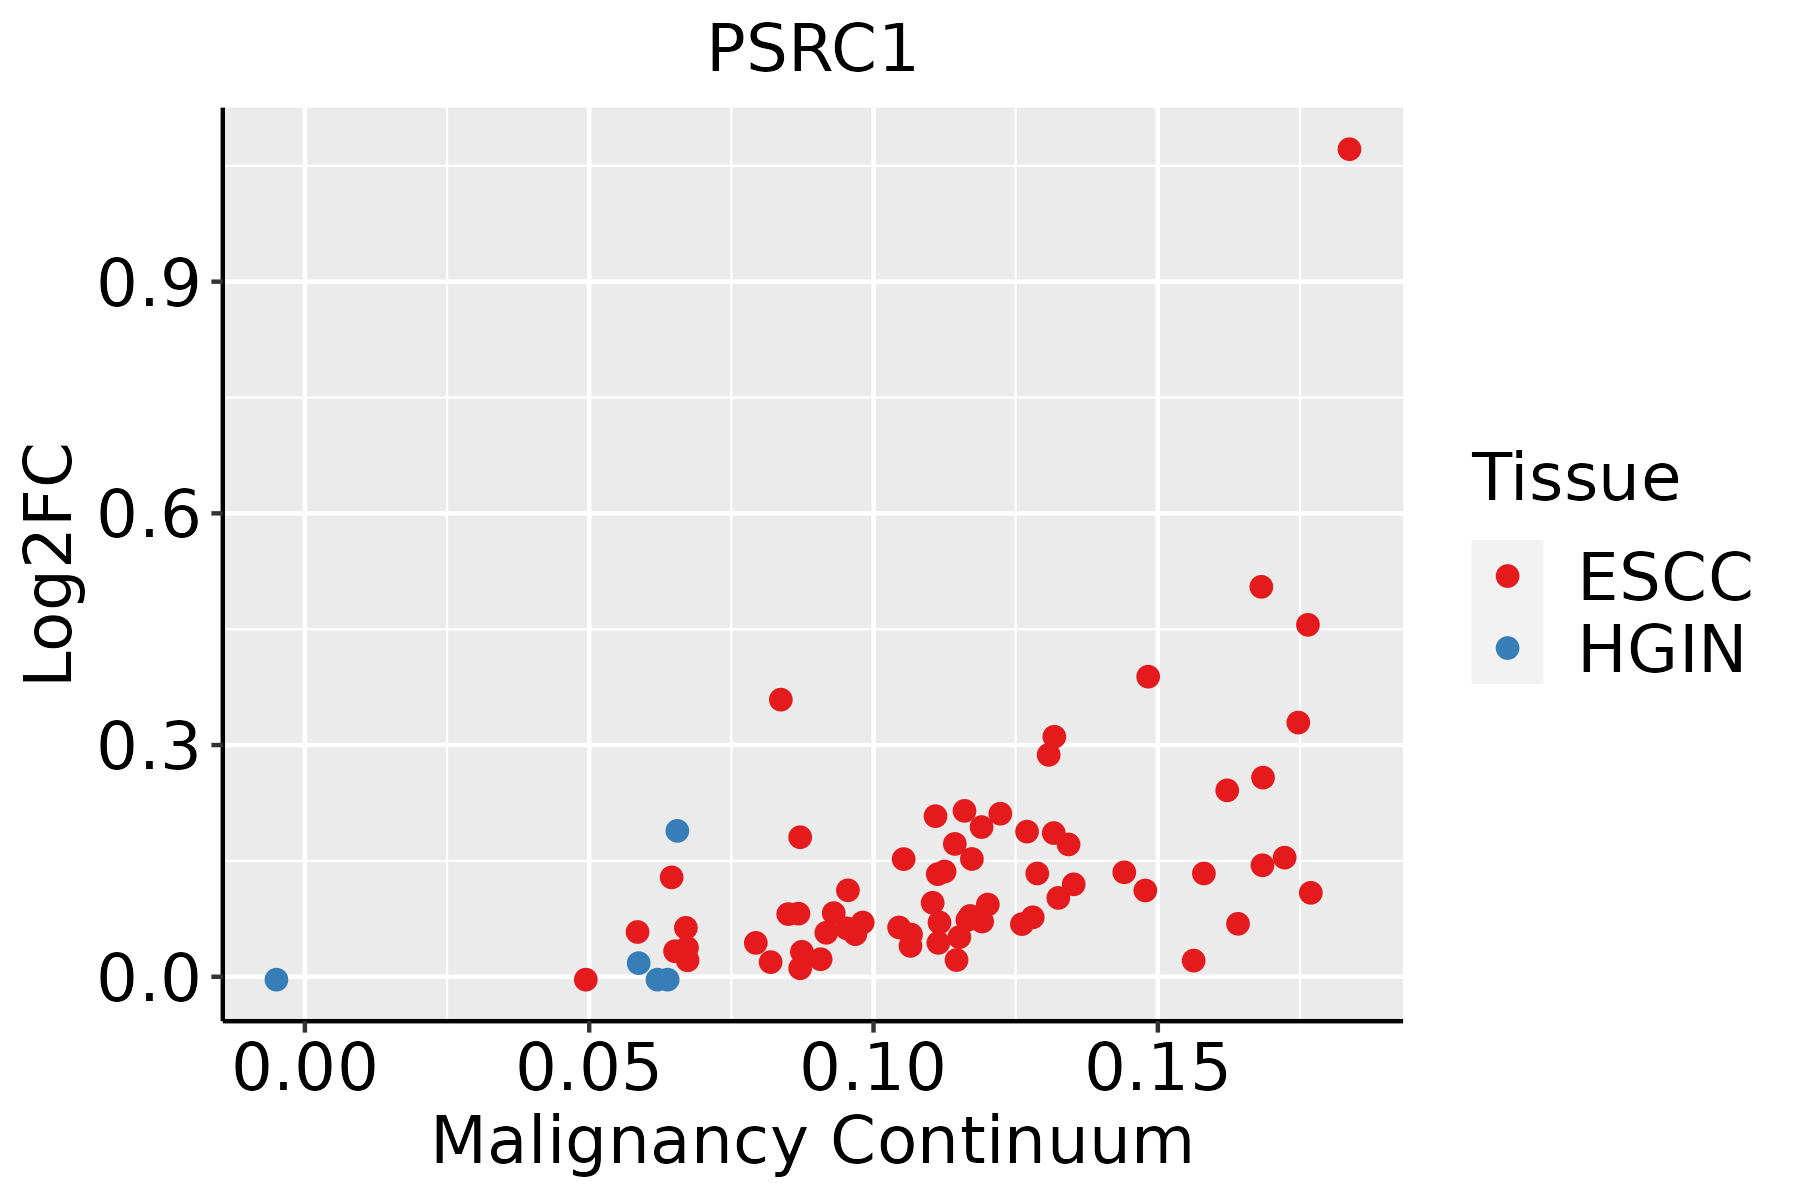 | ESCC: Esophageal squamous cell carcinoma |
| HGIN: High-grade intraepithelial neoplasias | ||
| LGIN: Low-grade intraepithelial neoplasias | ||
| Liver |  | HCC: Hepatocellular carcinoma |
| NAFLD: Non-alcoholic fatty liver disease |
| ∗log2FC in expression of this searched gene in stem-like cells from each diseased tissue sample relative to stem-like cells in normal samples in each tissue plotted against the malignancy continuum. Samples are colored based on if they are from different disease stage. |
Top |
Malignant transformation related pathway analysis |
| Find out the enriched GO biological processes and KEGG pathways involved in transition from healthy to precancer to cancer |
| Tissue | Disease Stage | Enriched GO biological Processes |
| Colorectum | AD |  |
| Colorectum | SER |  |
| Colorectum | MSS |  |
| Colorectum | MSI-H |  |
| Colorectum | FAP |  |
| ∗Top 15 enriched GO BP terms are showed in the bar plot of each disease state in each tissue. Each row represents a significant GO biological process which is colored according to the -log10(p.adjust). |
| Page: 1 2 3 4 5 6 7 8 9 |
| GO ID | Tissue | Disease Stage | Description | Gene Ratio | Bg Ratio | pvalue | p.adjust | Count |
| GO:014001414 | Esophagus | ESCC | mitotic nuclear division | 218/8552 | 287/18723 | 6.17e-26 | 1.78e-23 | 218 |
| GO:005165617 | Esophagus | ESCC | establishment of organelle localization | 273/8552 | 390/18723 | 9.13e-23 | 1.81e-20 | 273 |
| GO:000007011 | Esophagus | ESCC | mitotic sister chromatid segregation | 138/8552 | 168/18723 | 1.37e-22 | 2.63e-20 | 138 |
| GO:00008194 | Esophagus | ESCC | sister chromatid segregation | 157/8552 | 202/18723 | 8.41e-21 | 1.33e-18 | 157 |
| GO:000705911 | Esophagus | ESCC | chromosome segregation | 238/8552 | 346/18723 | 1.72e-18 | 1.82e-16 | 238 |
| GO:190285015 | Esophagus | ESCC | microtubule cytoskeleton organization involved in mitosis | 116/8552 | 147/18723 | 1.25e-16 | 9.91e-15 | 116 |
| GO:0043254111 | Esophagus | ESCC | regulation of protein-containing complex assembly | 278/8552 | 428/18723 | 3.81e-16 | 2.77e-14 | 278 |
| GO:000705214 | Esophagus | ESCC | mitotic spindle organization | 97/8552 | 120/18723 | 2.17e-15 | 1.33e-13 | 97 |
| GO:0031334111 | Esophagus | ESCC | positive regulation of protein-containing complex assembly | 166/8552 | 237/18723 | 2.06e-14 | 1.07e-12 | 166 |
| GO:000705114 | Esophagus | ESCC | spindle organization | 134/8552 | 184/18723 | 5.70e-14 | 2.87e-12 | 134 |
| GO:005131011 | Esophagus | ESCC | metaphase plate congression | 58/8552 | 65/18723 | 1.81e-13 | 8.63e-12 | 58 |
| GO:000708011 | Esophagus | ESCC | mitotic metaphase plate congression | 47/8552 | 50/18723 | 3.15e-13 | 1.47e-11 | 47 |
| GO:00482853 | Esophagus | ESCC | organelle fission | 301/8552 | 488/18723 | 4.64e-13 | 2.12e-11 | 301 |
| GO:00988133 | Esophagus | ESCC | nuclear chromosome segregation | 187/8552 | 281/18723 | 1.00e-12 | 4.36e-11 | 187 |
| GO:005130311 | Esophagus | ESCC | establishment of chromosome localization | 67/8552 | 80/18723 | 1.92e-12 | 8.09e-11 | 67 |
| GO:005000011 | Esophagus | ESCC | chromosome localization | 68/8552 | 82/18723 | 3.37e-12 | 1.32e-10 | 68 |
| GO:007190016 | Esophagus | ESCC | regulation of protein serine/threonine kinase activity | 227/8552 | 359/18723 | 1.12e-11 | 4.10e-10 | 227 |
| GO:00002802 | Esophagus | ESCC | nuclear division | 270/8552 | 439/18723 | 1.17e-11 | 4.24e-10 | 270 |
| GO:1902905111 | Esophagus | ESCC | positive regulation of supramolecular fiber organization | 142/8552 | 209/18723 | 5.51e-11 | 1.76e-09 | 142 |
| GO:1902903111 | Esophagus | ESCC | regulation of supramolecular fiber organization | 237/8552 | 383/18723 | 9.06e-11 | 2.75e-09 | 237 |
| Page: 1 2 3 4 5 |
| Pathway ID | Tissue | Disease Stage | Description | Gene Ratio | Bg Ratio | pvalue | p.adjust | qvalue | Count |
| Page: 1 |
Top |
Cell-cell communication analysis |
| Identification of potential cell-cell interactions between two cell types and their ligand-receptor pairs for different disease states |
| Ligand | Receptor | LRpair | Pathway | Tissue | Disease Stage |
| Page: 1 |
Top |
Single-cell gene regulatory network inference analysis |
| Find out the significant the regulons (TFs) and the target genes of each regulon across cell types for different disease states |
| TF | Cell Type | Tissue | Disease Stage | Target Gene | RSS | Regulon Activity |
| ∗The dot plots of a searched regulon are shown for all cell subpopulations in each disease state of each tissue based on the regulon specific score inferred using pySCENIC and by calculating the average expression. |
| Page: 1 |
Top |
Somatic mutation of malignant transformation related genes |
| Annotation of somatic variants for genes involved in malignant transformation |
| Hugo Symbol | Variant Class | Variant Classification | dbSNP RS | HGVSc | HGVSp | HGVSp Short | SWISSPROT | BIOTYPE | SIFT | PolyPhen | Tumor Sample Barcode | Tissue | Histology | Sex | Age | Stage | Therapy Types | Drugs | Outcome |
| PSRC1 | SNV | Missense_Mutation | c.214N>C | p.Glu72Gln | p.E72Q | Q6PGN9 | protein_coding | deleterious(0.01) | possibly_damaging(0.466) | TCGA-AO-A0J9-01 | Breast | breast invasive carcinoma | Female | <65 | III/IV | Chemotherapy | cyclophosphamide | PD | |
| PSRC1 | insertion | Frame_Shift_Ins | novel | c.640_641insTCTGT | p.Pro214LeufsTer97 | p.P214Lfs*97 | Q6PGN9 | protein_coding | TCGA-A8-A08X-01 | Breast | breast invasive carcinoma | Female | <65 | III/IV | Chemotherapy | doxorubicin | PD | ||
| PSRC1 | deletion | Frame_Shift_Del | novel | c.732delC | p.Ser245ValfsTer64 | p.S245Vfs*64 | Q6PGN9 | protein_coding | TCGA-D8-A27V-01 | Breast | breast invasive carcinoma | Female | <65 | I/II | Hormone Therapy | tamoxiphen | SD | ||
| PSRC1 | SNV | Missense_Mutation | rs760943124 | c.707C>T | p.Pro236Leu | p.P236L | Q6PGN9 | protein_coding | tolerated(0.25) | benign(0.095) | TCGA-AA-3494-01 | Colorectum | colon adenocarcinoma | Male | <65 | III/IV | Chemotherapy | folinic | PR |
| PSRC1 | SNV | Missense_Mutation | c.193N>T | p.Ser65Cys | p.S65C | Q6PGN9 | protein_coding | tolerated(0.11) | probably_damaging(0.998) | TCGA-AA-3663-01 | Colorectum | colon adenocarcinoma | Male | <65 | I/II | Unknown | Unknown | SD | |
| PSRC1 | SNV | Missense_Mutation | rs141272790 | c.340N>T | p.Arg114Trp | p.R114W | Q6PGN9 | protein_coding | deleterious(0) | probably_damaging(0.999) | TCGA-AA-3715-01 | Colorectum | colon adenocarcinoma | Male | >=65 | I/II | Unknown | Unknown | PD |
| PSRC1 | SNV | Missense_Mutation | rs754495062 | c.256N>A | p.Ala86Thr | p.A86T | Q6PGN9 | protein_coding | tolerated(0.18) | benign(0.012) | TCGA-AA-A01P-01 | Colorectum | colon adenocarcinoma | Female | >=65 | III/IV | Unknown | Unknown | PD |
| PSRC1 | SNV | Missense_Mutation | c.965C>A | p.Pro322His | p.P322H | Q6PGN9 | protein_coding | deleterious(0) | possibly_damaging(0.847) | TCGA-CK-4951-01 | Colorectum | colon adenocarcinoma | Female | >=65 | I/II | Unknown | Unknown | PD | |
| PSRC1 | SNV | Missense_Mutation | rs148605172 | c.434N>T | p.Thr145Met | p.T145M | Q6PGN9 | protein_coding | deleterious(0.02) | probably_damaging(0.951) | TCGA-CK-6746-01 | Colorectum | colon adenocarcinoma | Female | >=65 | I/II | Unknown | Unknown | SD |
| PSRC1 | SNV | Missense_Mutation | rs201557600 | c.886N>T | p.Arg296Trp | p.R296W | Q6PGN9 | protein_coding | deleterious(0.04) | possibly_damaging(0.76) | TCGA-A5-A0G1-01 | Endometrium | uterine corpus endometrioid carcinoma | Female | >=65 | I/II | Unknown | Unknown | SD |
| Page: 1 2 3 |
Top |
Related drugs of malignant transformation related genes |
| Identification of chemicals and drugs interact with genes involved in malignant transfromation |
| (DGIdb 4.0) |
| Entrez ID | Symbol | Category | Interaction Types | Drug Claim Name | Drug Name | PMIDs |
| Page: 1 |

Copyright 2023-Present -The University of Texas Health Science Center at Houston |