
|
|||||
|
 | |
| |
| |
| |
| |
| |
|
Gene: PSPH |
Gene summary for PSPH |
| Gene information | Species | Human | Gene symbol | PSPH | Gene ID | 5723 |
| Gene name | phosphoserine phosphatase | |
| Gene Alias | PSP | |
| Cytomap | 7p11.2 | |
| Gene Type | protein-coding | GO ID | GO:0001701 | UniProtAcc | A0A024RDL3 |
Top |
Malignant transformation analysis |
| Identification of the aberrant gene expression in precancerous and cancerous lesions by comparing the gene expression of stem-like cells in diseased tissues with normal stem cells |
| Entrez ID | Symbol | Replicates | Species | Organ | Tissue | Adj P-value | Log2FC | Malignancy |
| 5723 | PSPH | LZE4T | Human | Esophagus | ESCC | 5.36e-04 | 2.05e-01 | 0.0811 |
| 5723 | PSPH | LZE24T | Human | Esophagus | ESCC | 8.43e-03 | 1.15e-01 | 0.0596 |
| 5723 | PSPH | LZE6T | Human | Esophagus | ESCC | 2.32e-03 | 1.92e-01 | 0.0845 |
| 5723 | PSPH | P1T-E | Human | Esophagus | ESCC | 8.59e-06 | 2.32e-01 | 0.0875 |
| 5723 | PSPH | P2T-E | Human | Esophagus | ESCC | 1.13e-48 | 1.02e+00 | 0.1177 |
| 5723 | PSPH | P4T-E | Human | Esophagus | ESCC | 3.15e-29 | 6.78e-01 | 0.1323 |
| 5723 | PSPH | P5T-E | Human | Esophagus | ESCC | 1.17e-07 | 8.93e-02 | 0.1327 |
| 5723 | PSPH | P8T-E | Human | Esophagus | ESCC | 6.78e-07 | 1.58e-01 | 0.0889 |
| 5723 | PSPH | P9T-E | Human | Esophagus | ESCC | 1.54e-06 | 1.21e-01 | 0.1131 |
| 5723 | PSPH | P10T-E | Human | Esophagus | ESCC | 1.55e-22 | 4.08e-01 | 0.116 |
| 5723 | PSPH | P12T-E | Human | Esophagus | ESCC | 7.82e-24 | 4.52e-01 | 0.1122 |
| 5723 | PSPH | P15T-E | Human | Esophagus | ESCC | 1.04e-15 | 4.35e-01 | 0.1149 |
| 5723 | PSPH | P16T-E | Human | Esophagus | ESCC | 1.45e-36 | 6.48e-01 | 0.1153 |
| 5723 | PSPH | P17T-E | Human | Esophagus | ESCC | 3.17e-02 | 1.63e-01 | 0.1278 |
| 5723 | PSPH | P19T-E | Human | Esophagus | ESCC | 3.41e-04 | 4.63e-01 | 0.1662 |
| 5723 | PSPH | P20T-E | Human | Esophagus | ESCC | 4.30e-09 | 1.44e-01 | 0.1124 |
| 5723 | PSPH | P21T-E | Human | Esophagus | ESCC | 4.60e-16 | 3.52e-01 | 0.1617 |
| 5723 | PSPH | P22T-E | Human | Esophagus | ESCC | 3.69e-19 | 3.62e-01 | 0.1236 |
| 5723 | PSPH | P23T-E | Human | Esophagus | ESCC | 6.12e-18 | 4.93e-01 | 0.108 |
| 5723 | PSPH | P24T-E | Human | Esophagus | ESCC | 1.50e-13 | 1.51e-01 | 0.1287 |
| Page: 1 2 3 4 |
| Tissue | Expression Dynamics | Abbreviation |
| Esophagus | 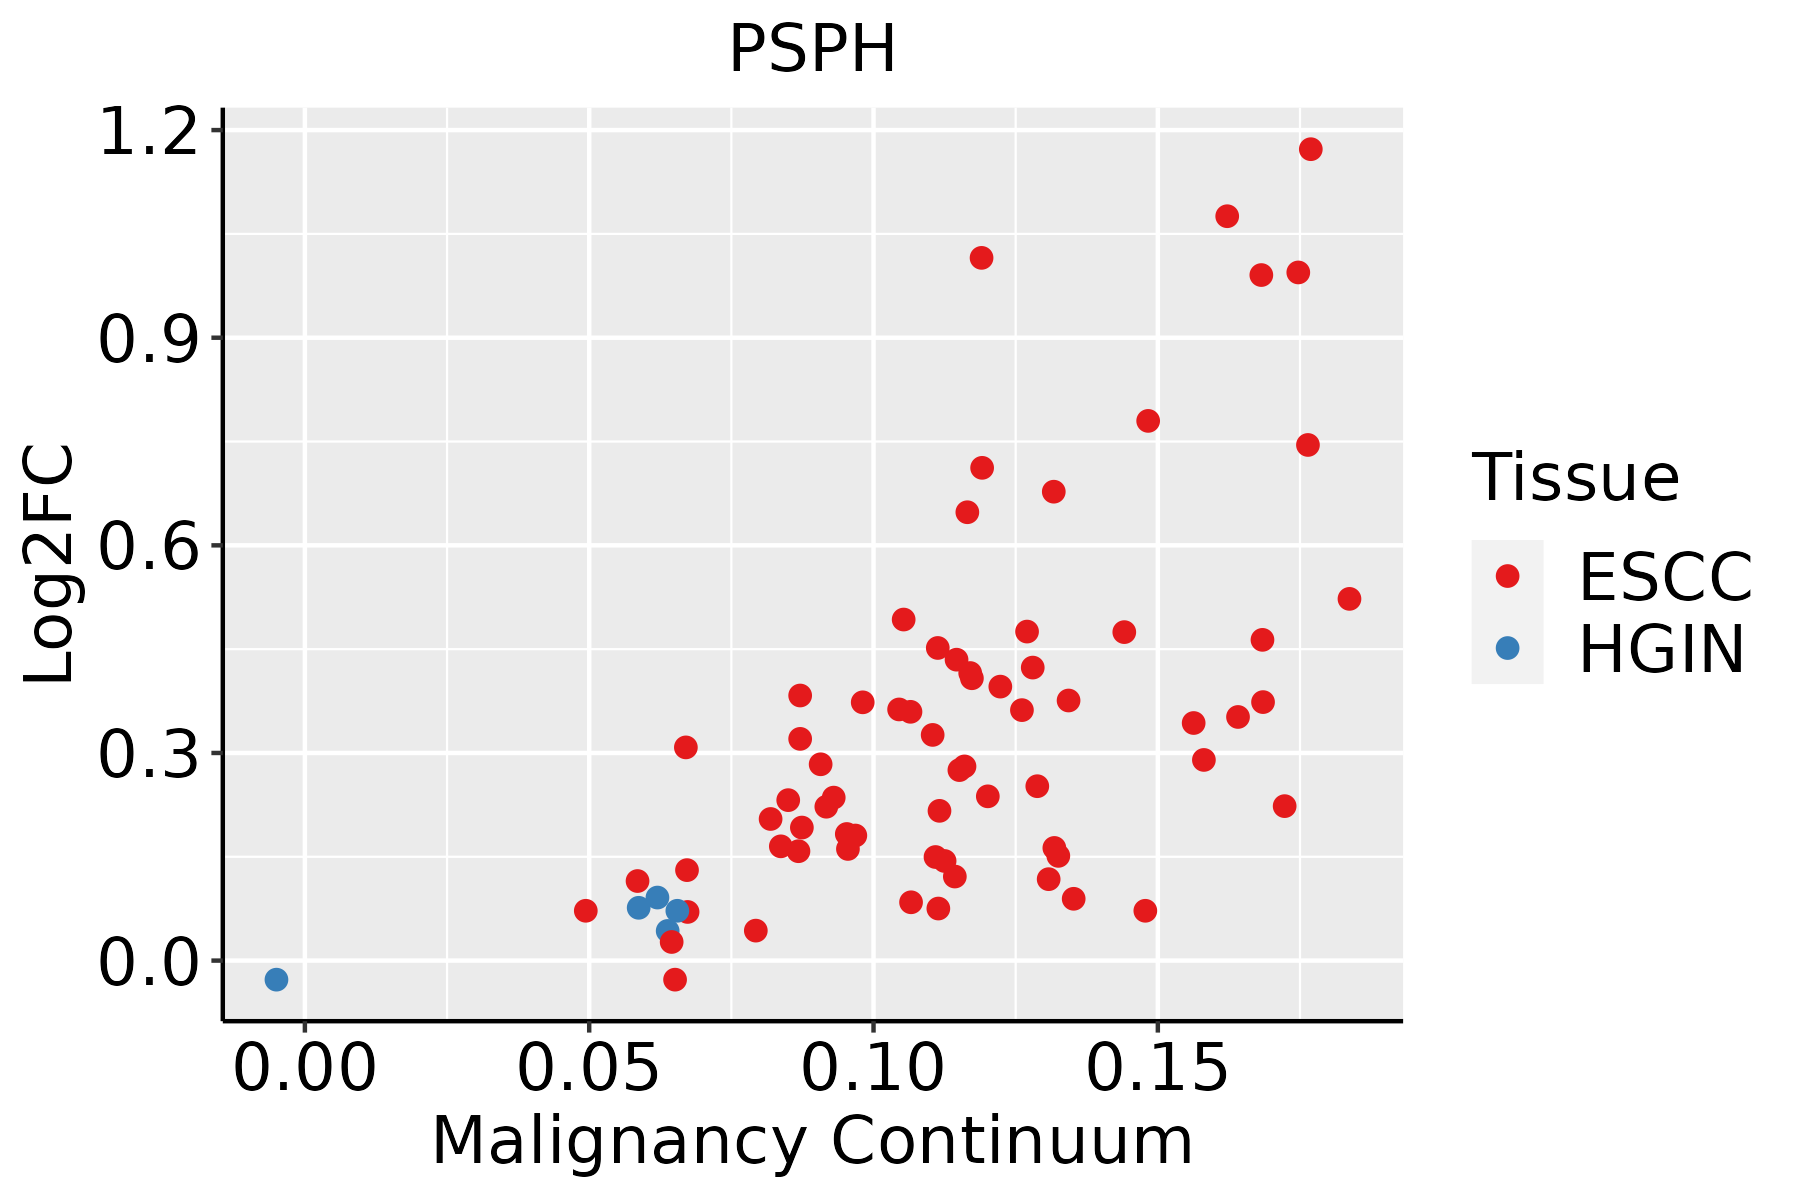 | ESCC: Esophageal squamous cell carcinoma |
| HGIN: High-grade intraepithelial neoplasias | ||
| LGIN: Low-grade intraepithelial neoplasias | ||
| Liver | 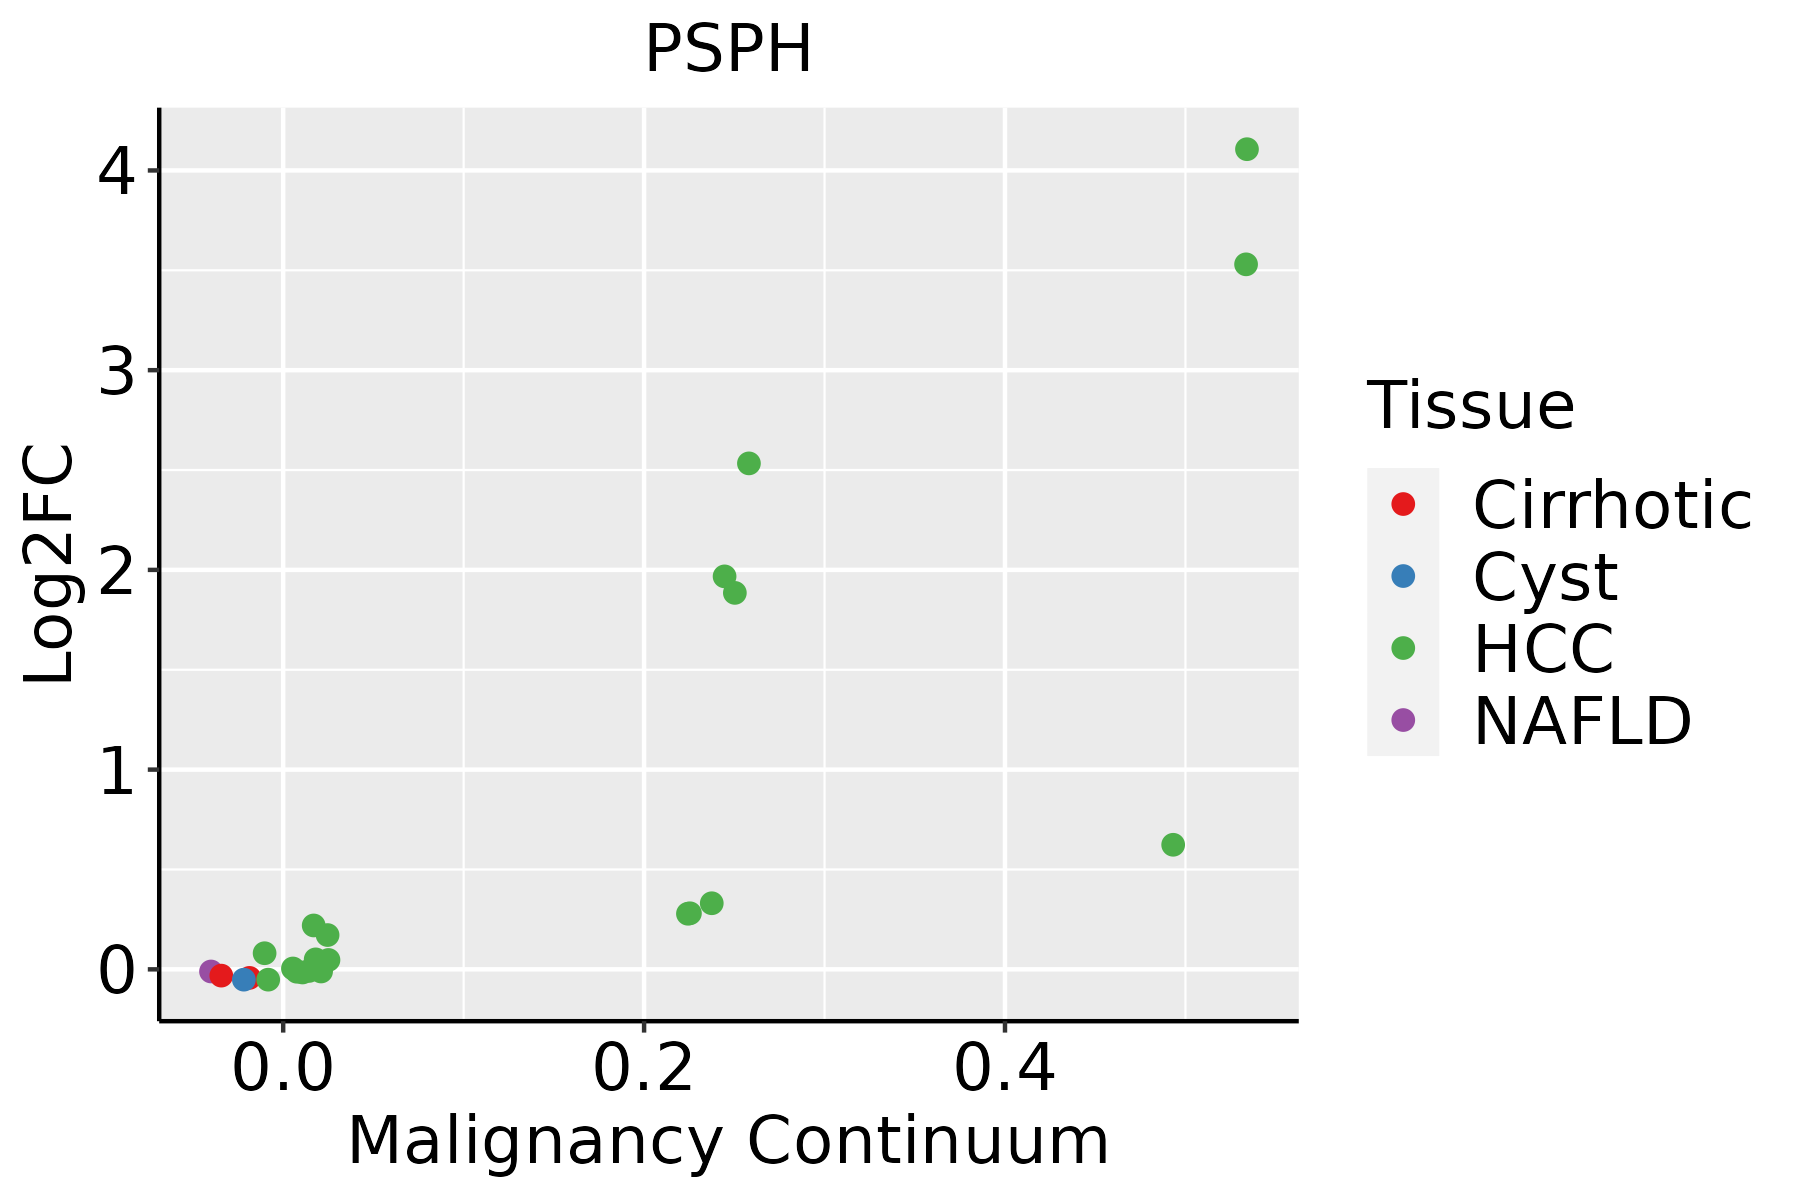 | HCC: Hepatocellular carcinoma |
| NAFLD: Non-alcoholic fatty liver disease | ||
| Oral Cavity | 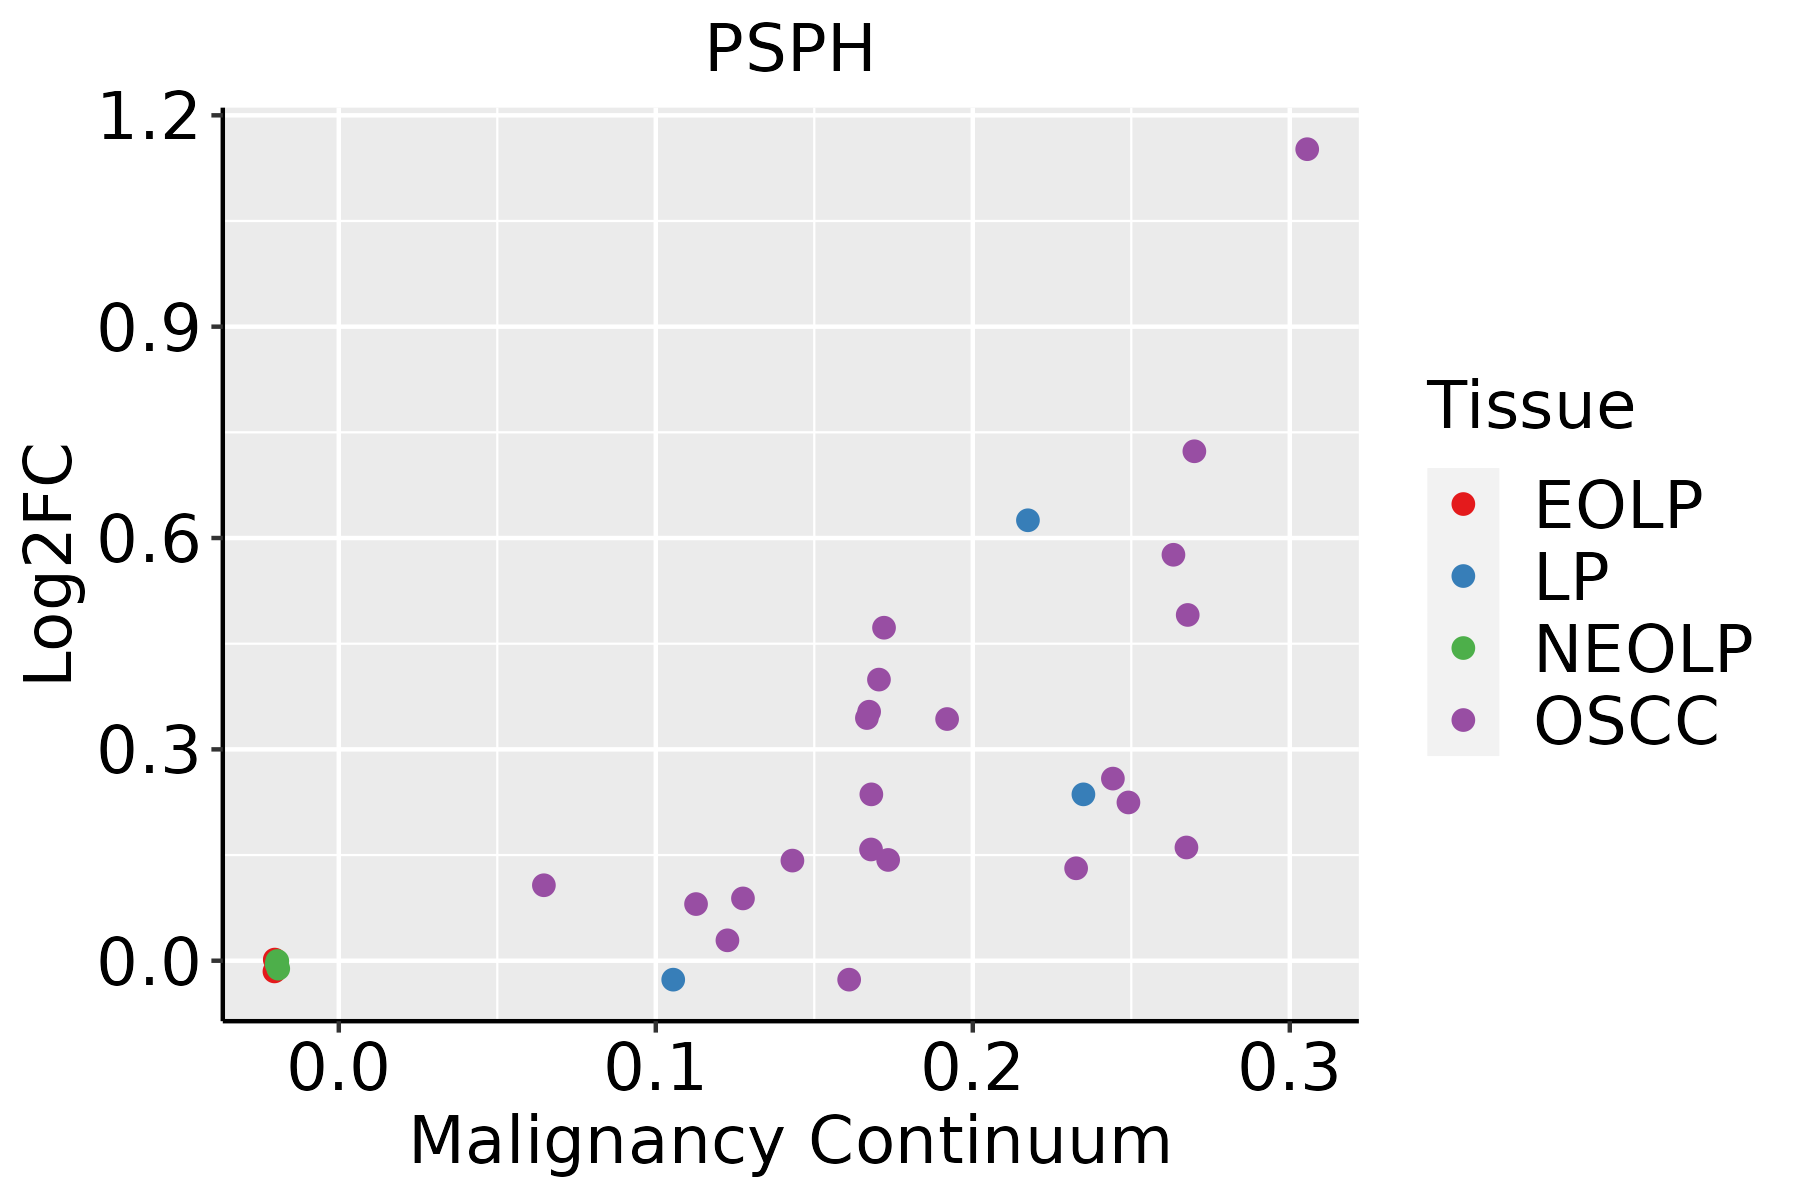 | EOLP: Erosive Oral lichen planus |
| LP: leukoplakia | ||
| NEOLP: Non-erosive oral lichen planus | ||
| OSCC: Oral squamous cell carcinoma |
| ∗log2FC in expression of this searched gene in stem-like cells from each diseased tissue sample relative to stem-like cells in normal samples in each tissue plotted against the malignancy continuum. Samples are colored based on if they are from different disease stage. |
Top |
Malignant transformation related pathway analysis |
| Find out the enriched GO biological processes and KEGG pathways involved in transition from healthy to precancer to cancer |
| Tissue | Disease Stage | Enriched GO biological Processes |
| Colorectum | AD |  |
| Colorectum | SER |  |
| Colorectum | MSS |  |
| Colorectum | MSI-H |  |
| Colorectum | FAP |  |
| ∗Top 15 enriched GO BP terms are showed in the bar plot of each disease state in each tissue. Each row represents a significant GO biological process which is colored according to the -log10(p.adjust). |
| Page: 1 2 3 4 5 6 7 8 9 |
| GO ID | Tissue | Disease Stage | Description | Gene Ratio | Bg Ratio | pvalue | p.adjust | Count |
| GO:000170119 | Esophagus | ESCC | in utero embryonic development | 243/8552 | 367/18723 | 1.00e-15 | 6.86e-14 | 243 |
| GO:0031667111 | Esophagus | ESCC | response to nutrient levels | 289/8552 | 474/18723 | 9.25e-12 | 3.47e-10 | 289 |
| GO:001631110 | Esophagus | ESCC | dephosphorylation | 251/8552 | 417/18723 | 1.26e-09 | 2.99e-08 | 251 |
| GO:1901654111 | Esophagus | ESCC | response to ketone | 118/8552 | 194/18723 | 1.45e-05 | 1.31e-04 | 118 |
| GO:00086525 | Esophagus | ESCC | cellular amino acid biosynthetic process | 51/8552 | 76/18723 | 1.30e-04 | 8.88e-04 | 51 |
| GO:00463948 | Esophagus | ESCC | carboxylic acid biosynthetic process | 175/8552 | 314/18723 | 1.98e-04 | 1.26e-03 | 175 |
| GO:00160538 | Esophagus | ESCC | organic acid biosynthetic process | 175/8552 | 316/18723 | 3.04e-04 | 1.82e-03 | 175 |
| GO:000961216 | Esophagus | ESCC | response to mechanical stimulus | 124/8552 | 216/18723 | 3.30e-04 | 1.94e-03 | 124 |
| GO:19016075 | Esophagus | ESCC | alpha-amino acid biosynthetic process | 45/8552 | 68/18723 | 5.13e-04 | 2.84e-03 | 45 |
| GO:003357415 | Esophagus | ESCC | response to testosterone | 29/8552 | 42/18723 | 1.87e-03 | 8.46e-03 | 29 |
| GO:001605321 | Liver | HCC | organic acid biosynthetic process | 200/7958 | 316/18723 | 5.24e-14 | 3.22e-12 | 200 |
| GO:004639421 | Liver | HCC | carboxylic acid biosynthetic process | 198/7958 | 314/18723 | 1.19e-13 | 6.78e-12 | 198 |
| GO:003166722 | Liver | HCC | response to nutrient levels | 276/7958 | 474/18723 | 2.30e-12 | 1.08e-10 | 276 |
| GO:00086522 | Liver | HCC | cellular amino acid biosynthetic process | 58/7958 | 76/18723 | 1.98e-09 | 5.63e-08 | 58 |
| GO:19016052 | Liver | HCC | alpha-amino acid metabolic process | 124/7958 | 195/18723 | 2.07e-09 | 5.79e-08 | 124 |
| GO:19016072 | Liver | HCC | alpha-amino acid biosynthetic process | 53/7958 | 68/18723 | 2.62e-09 | 7.16e-08 | 53 |
| GO:00065202 | Liver | HCC | cellular amino acid metabolic process | 167/7958 | 284/18723 | 1.91e-08 | 4.56e-07 | 167 |
| GO:190165422 | Liver | HCC | response to ketone | 119/7958 | 194/18723 | 8.65e-08 | 1.72e-06 | 119 |
| GO:001631121 | Liver | HCC | dephosphorylation | 230/7958 | 417/18723 | 1.00e-07 | 1.96e-06 | 230 |
| GO:000170111 | Liver | HCC | in utero embryonic development | 204/7958 | 367/18723 | 2.44e-07 | 4.30e-06 | 204 |
| Page: 1 2 |
| Pathway ID | Tissue | Disease Stage | Description | Gene Ratio | Bg Ratio | pvalue | p.adjust | qvalue | Count |
| hsa0120023 | Esophagus | ESCC | Carbon metabolism | 79/4205 | 115/8465 | 2.50e-05 | 1.21e-04 | 6.22e-05 | 79 |
| hsa0123023 | Esophagus | ESCC | Biosynthesis of amino acids | 49/4205 | 75/8465 | 4.35e-03 | 1.12e-02 | 5.74e-03 | 49 |
| hsa0120033 | Esophagus | ESCC | Carbon metabolism | 79/4205 | 115/8465 | 2.50e-05 | 1.21e-04 | 6.22e-05 | 79 |
| hsa0123033 | Esophagus | ESCC | Biosynthesis of amino acids | 49/4205 | 75/8465 | 4.35e-03 | 1.12e-02 | 5.74e-03 | 49 |
| hsa0120041 | Liver | HCC | Carbon metabolism | 89/4020 | 115/8465 | 3.92e-11 | 6.56e-10 | 3.65e-10 | 89 |
| hsa0123021 | Liver | HCC | Biosynthesis of amino acids | 53/4020 | 75/8465 | 3.79e-05 | 2.11e-04 | 1.18e-04 | 53 |
| hsa002602 | Liver | HCC | Glycine, serine and threonine metabolism | 28/4020 | 40/8465 | 3.28e-03 | 1.07e-02 | 5.93e-03 | 28 |
| hsa0120051 | Liver | HCC | Carbon metabolism | 89/4020 | 115/8465 | 3.92e-11 | 6.56e-10 | 3.65e-10 | 89 |
| hsa0123031 | Liver | HCC | Biosynthesis of amino acids | 53/4020 | 75/8465 | 3.79e-05 | 2.11e-04 | 1.18e-04 | 53 |
| hsa002603 | Liver | HCC | Glycine, serine and threonine metabolism | 28/4020 | 40/8465 | 3.28e-03 | 1.07e-02 | 5.93e-03 | 28 |
| hsa0120014 | Oral cavity | OSCC | Carbon metabolism | 74/3704 | 115/8465 | 6.10e-06 | 3.05e-05 | 1.55e-05 | 74 |
| hsa012305 | Oral cavity | OSCC | Biosynthesis of amino acids | 45/3704 | 75/8465 | 3.27e-03 | 8.23e-03 | 4.19e-03 | 45 |
| hsa0120015 | Oral cavity | OSCC | Carbon metabolism | 74/3704 | 115/8465 | 6.10e-06 | 3.05e-05 | 1.55e-05 | 74 |
| hsa0123012 | Oral cavity | OSCC | Biosynthesis of amino acids | 45/3704 | 75/8465 | 3.27e-03 | 8.23e-03 | 4.19e-03 | 45 |
| hsa0120022 | Oral cavity | LP | Carbon metabolism | 62/2418 | 115/8465 | 8.38e-09 | 1.39e-07 | 8.99e-08 | 62 |
| hsa0123022 | Oral cavity | LP | Biosynthesis of amino acids | 36/2418 | 75/8465 | 2.68e-04 | 1.51e-03 | 9.74e-04 | 36 |
| hsa0120032 | Oral cavity | LP | Carbon metabolism | 62/2418 | 115/8465 | 8.38e-09 | 1.39e-07 | 8.99e-08 | 62 |
| hsa0123032 | Oral cavity | LP | Biosynthesis of amino acids | 36/2418 | 75/8465 | 2.68e-04 | 1.51e-03 | 9.74e-04 | 36 |
| Page: 1 |
Top |
Cell-cell communication analysis |
| Identification of potential cell-cell interactions between two cell types and their ligand-receptor pairs for different disease states |
| Ligand | Receptor | LRpair | Pathway | Tissue | Disease Stage |
| Page: 1 |
Top |
Single-cell gene regulatory network inference analysis |
| Find out the significant the regulons (TFs) and the target genes of each regulon across cell types for different disease states |
| TF | Cell Type | Tissue | Disease Stage | Target Gene | RSS | Regulon Activity |
| ∗The dot plots of a searched regulon are shown for all cell subpopulations in each disease state of each tissue based on the regulon specific score inferred using pySCENIC and by calculating the average expression. |
| Page: 1 |
Top |
Somatic mutation of malignant transformation related genes |
| Annotation of somatic variants for genes involved in malignant transformation |
| Hugo Symbol | Variant Class | Variant Classification | dbSNP RS | HGVSc | HGVSp | HGVSp Short | SWISSPROT | BIOTYPE | SIFT | PolyPhen | Tumor Sample Barcode | Tissue | Histology | Sex | Age | Stage | Therapy Types | Drugs | Outcome |
| PSPH | SNV | Missense_Mutation | novel | c.161N>T | p.Gly54Val | p.G54V | P78330 | protein_coding | deleterious(0) | probably_damaging(0.997) | TCGA-EW-A6SB-01 | Breast | breast invasive carcinoma | Female | <65 | I/II | Unknown | Unknown | SD |
| PSPH | SNV | Missense_Mutation | c.547N>A | p.Asp183Asn | p.D183N | P78330 | protein_coding | deleterious(0) | probably_damaging(0.987) | TCGA-DS-A0VM-01 | Cervix | cervical & endocervical cancer | Female | <65 | I/II | Chemotherapy | cisplatin | PD | |
| PSPH | SNV | Missense_Mutation | rs201419960 | c.128C>T | p.Ala43Val | p.A43V | P78330 | protein_coding | tolerated(0.07) | benign(0.062) | TCGA-A6-6653-01 | Colorectum | colon adenocarcinoma | Male | >=65 | I/II | Unknown | Unknown | SD |
| PSPH | SNV | Missense_Mutation | c.184C>G | p.Leu62Val | p.L62V | P78330 | protein_coding | deleterious(0.02) | possibly_damaging(0.618) | TCGA-AA-3949-01 | Colorectum | colon adenocarcinoma | Female | >=65 | III/IV | Unknown | Unknown | SD | |
| PSPH | SNV | Missense_Mutation | novel | c.522A>G | p.Ile174Met | p.I174M | P78330 | protein_coding | tolerated(0.2) | benign(0.227) | TCGA-A5-A0G2-01 | Endometrium | uterine corpus endometrioid carcinoma | Female | <65 | III/IV | Unknown | Unknown | SD |
| PSPH | SNV | Missense_Mutation | novel | c.170C>A | p.Pro57His | p.P57H | P78330 | protein_coding | tolerated(0.12) | possibly_damaging(0.666) | TCGA-A5-A0G2-01 | Endometrium | uterine corpus endometrioid carcinoma | Female | <65 | III/IV | Unknown | Unknown | SD |
| PSPH | SNV | Missense_Mutation | c.547G>T | p.Asp183Tyr | p.D183Y | P78330 | protein_coding | deleterious(0.01) | probably_damaging(0.999) | TCGA-A5-A1OF-01 | Endometrium | uterine corpus endometrioid carcinoma | Female | <65 | I/II | Unknown | Unknown | SD | |
| PSPH | SNV | Missense_Mutation | rs763503885 | c.182N>T | p.Ala61Val | p.A61V | P78330 | protein_coding | deleterious(0) | possibly_damaging(0.503) | TCGA-AX-A1CE-01 | Endometrium | uterine corpus endometrioid carcinoma | Female | <65 | I/II | Unspecific | Paclitaxel | SD |
| PSPH | SNV | Missense_Mutation | c.53N>A | p.Cys18Tyr | p.C18Y | P78330 | protein_coding | deleterious(0) | probably_damaging(0.986) | TCGA-AX-A1CE-01 | Endometrium | uterine corpus endometrioid carcinoma | Female | <65 | I/II | Unspecific | Paclitaxel | SD | |
| PSPH | SNV | Missense_Mutation | novel | c.160G>A | p.Gly54Arg | p.G54R | P78330 | protein_coding | deleterious(0.02) | probably_damaging(0.962) | TCGA-E6-A2P9-01 | Endometrium | uterine corpus endometrioid carcinoma | Female | >=65 | I/II | Unknown | Unknown | SD |
| Page: 1 2 3 |
Top |
Related drugs of malignant transformation related genes |
| Identification of chemicals and drugs interact with genes involved in malignant transfromation |
| (DGIdb 4.0) |
| Entrez ID | Symbol | Category | Interaction Types | Drug Claim Name | Drug Name | PMIDs |
| 5723 | PSPH | ENZYME | l-methionine | METHIONINE | 24651765 |
| Page: 1 |

Copyright 2023-Present -The University of Texas Health Science Center at Houston |