
|
|||||
|
 | |
| |
| |
| |
| |
| |
|
Gene: PSPC1 |
Gene summary for PSPC1 |
| Gene information | Species | Human | Gene symbol | PSPC1 | Gene ID | 55269 |
| Gene name | paraspeckle component 1 | |
| Gene Alias | PSP1 | |
| Cytomap | 13q12.11 | |
| Gene Type | protein-coding | GO ID | GO:0002218 | UniProtAcc | Q8WXF1 |
Top |
Malignant transformation analysis |
| Identification of the aberrant gene expression in precancerous and cancerous lesions by comparing the gene expression of stem-like cells in diseased tissues with normal stem cells |
| Entrez ID | Symbol | Replicates | Species | Organ | Tissue | Adj P-value | Log2FC | Malignancy |
| 55269 | PSPC1 | CCI_1 | Human | Cervix | CC | 2.38e-03 | 5.89e-01 | 0.528 |
| 55269 | PSPC1 | CCI_2 | Human | Cervix | CC | 4.21e-13 | 1.37e+00 | 0.5249 |
| 55269 | PSPC1 | CCI_3 | Human | Cervix | CC | 5.38e-11 | 8.17e-01 | 0.516 |
| 55269 | PSPC1 | HTA11_3410_2000001011 | Human | Colorectum | AD | 2.92e-13 | -5.15e-01 | 0.0155 |
| 55269 | PSPC1 | HTA11_2487_2000001011 | Human | Colorectum | SER | 7.06e-04 | -3.71e-01 | -0.1808 |
| 55269 | PSPC1 | HTA11_3361_2000001011 | Human | Colorectum | AD | 2.64e-02 | -3.73e-01 | -0.1207 |
| 55269 | PSPC1 | HTA11_866_2000001011 | Human | Colorectum | AD | 1.09e-02 | -3.12e-01 | -0.1001 |
| 55269 | PSPC1 | HTA11_5212_2000001011 | Human | Colorectum | AD | 2.80e-02 | -5.80e-01 | -0.2061 |
| 55269 | PSPC1 | HTA11_866_3004761011 | Human | Colorectum | AD | 7.27e-07 | -4.31e-01 | 0.096 |
| 55269 | PSPC1 | HTA11_10711_2000001011 | Human | Colorectum | AD | 1.43e-03 | -4.18e-01 | 0.0338 |
| 55269 | PSPC1 | HTA11_7696_3000711011 | Human | Colorectum | AD | 1.93e-03 | -3.62e-01 | 0.0674 |
| 55269 | PSPC1 | HTA11_99999974143_84620 | Human | Colorectum | MSS | 1.23e-06 | -4.25e-01 | 0.3005 |
| 55269 | PSPC1 | A001-C-207 | Human | Colorectum | FAP | 3.42e-06 | -3.13e-01 | 0.1278 |
| 55269 | PSPC1 | A015-C-203 | Human | Colorectum | FAP | 6.51e-25 | -4.43e-01 | -0.1294 |
| 55269 | PSPC1 | A015-C-204 | Human | Colorectum | FAP | 6.70e-07 | -3.40e-01 | -0.0228 |
| 55269 | PSPC1 | A014-C-040 | Human | Colorectum | FAP | 7.38e-04 | -3.96e-01 | -0.1184 |
| 55269 | PSPC1 | A002-C-201 | Human | Colorectum | FAP | 3.03e-16 | -3.64e-01 | 0.0324 |
| 55269 | PSPC1 | A002-C-203 | Human | Colorectum | FAP | 1.53e-03 | -1.90e-01 | 0.2786 |
| 55269 | PSPC1 | A001-C-119 | Human | Colorectum | FAP | 3.52e-05 | -1.78e-01 | -0.1557 |
| 55269 | PSPC1 | A001-C-108 | Human | Colorectum | FAP | 2.55e-13 | -3.32e-01 | -0.0272 |
| Page: 1 2 3 4 5 6 7 8 9 |
| Tissue | Expression Dynamics | Abbreviation |
| Cervix | 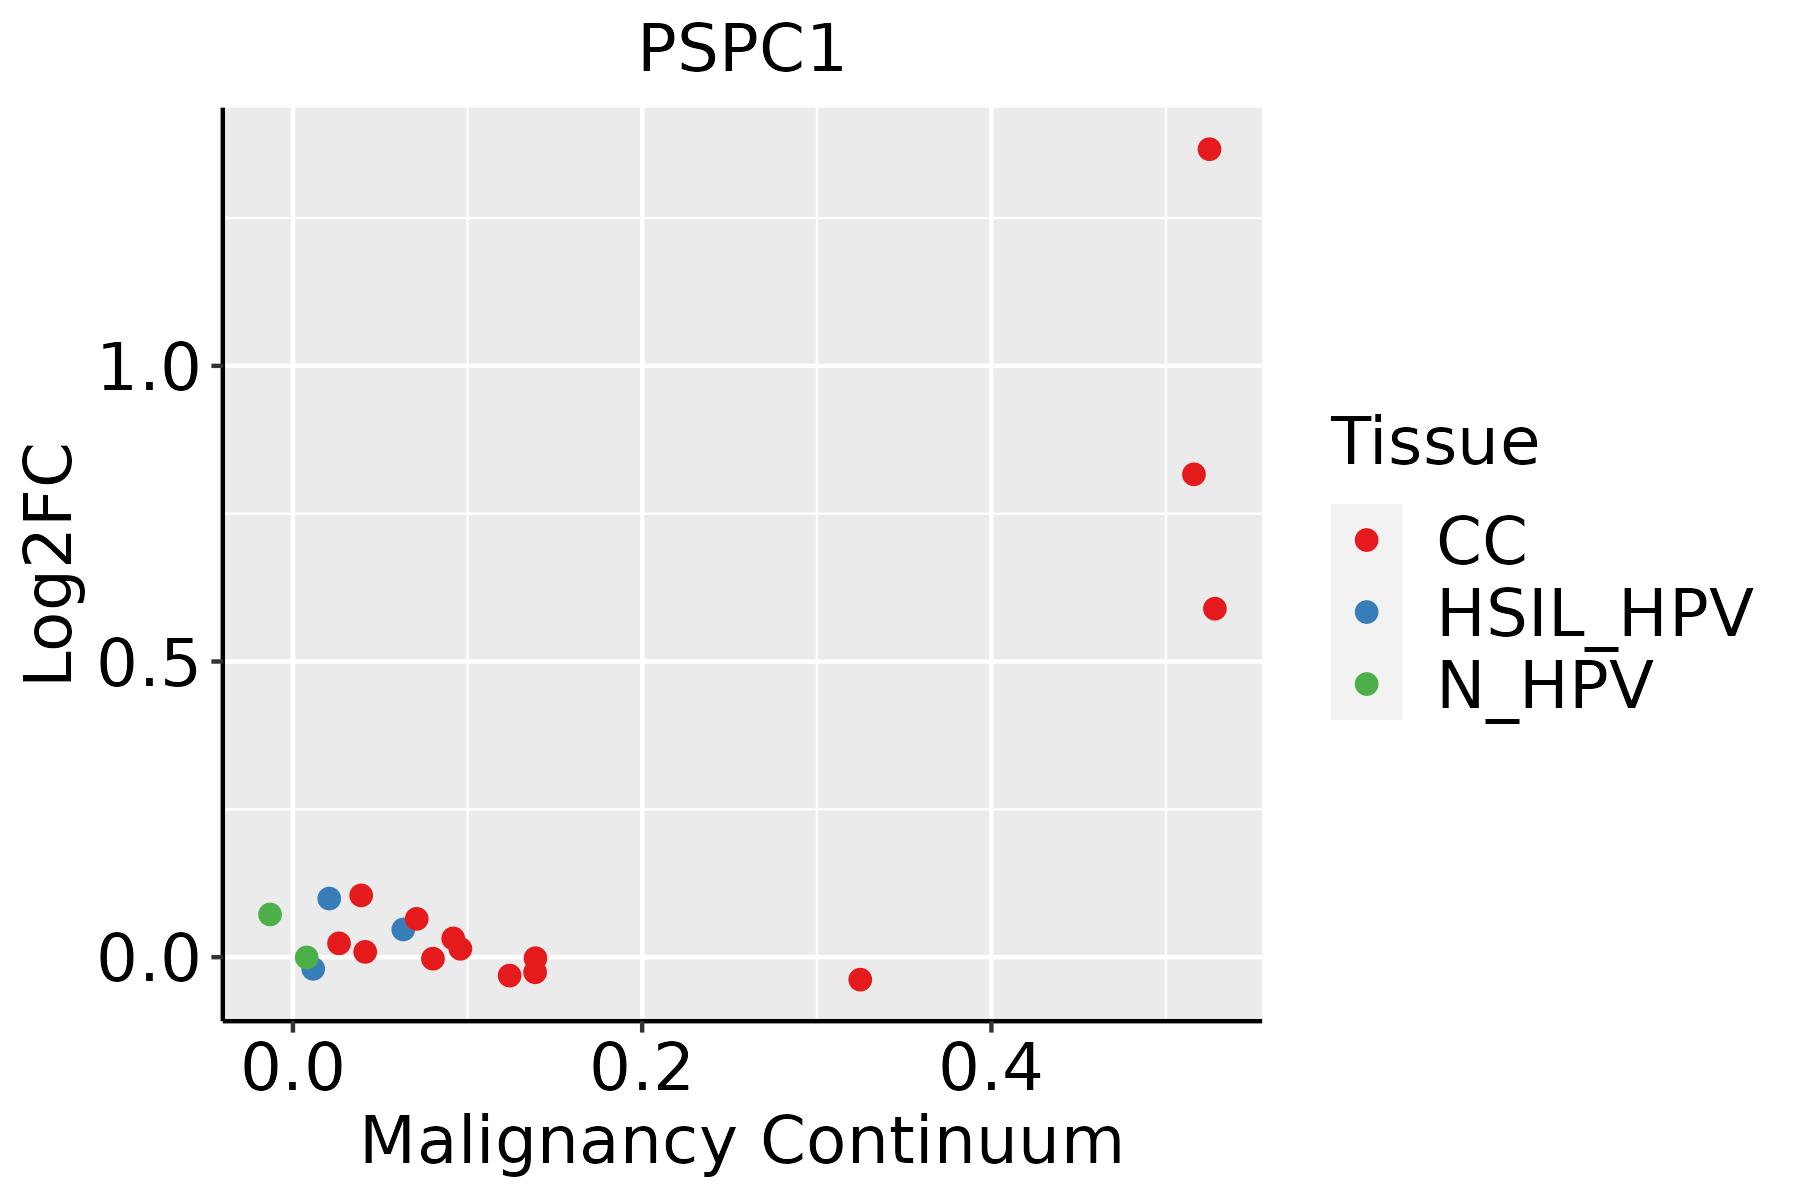 | CC: Cervix cancer |
| HSIL_HPV: HPV-infected high-grade squamous intraepithelial lesions | ||
| N_HPV: HPV-infected normal cervix | ||
| Colorectum (GSE201348) | 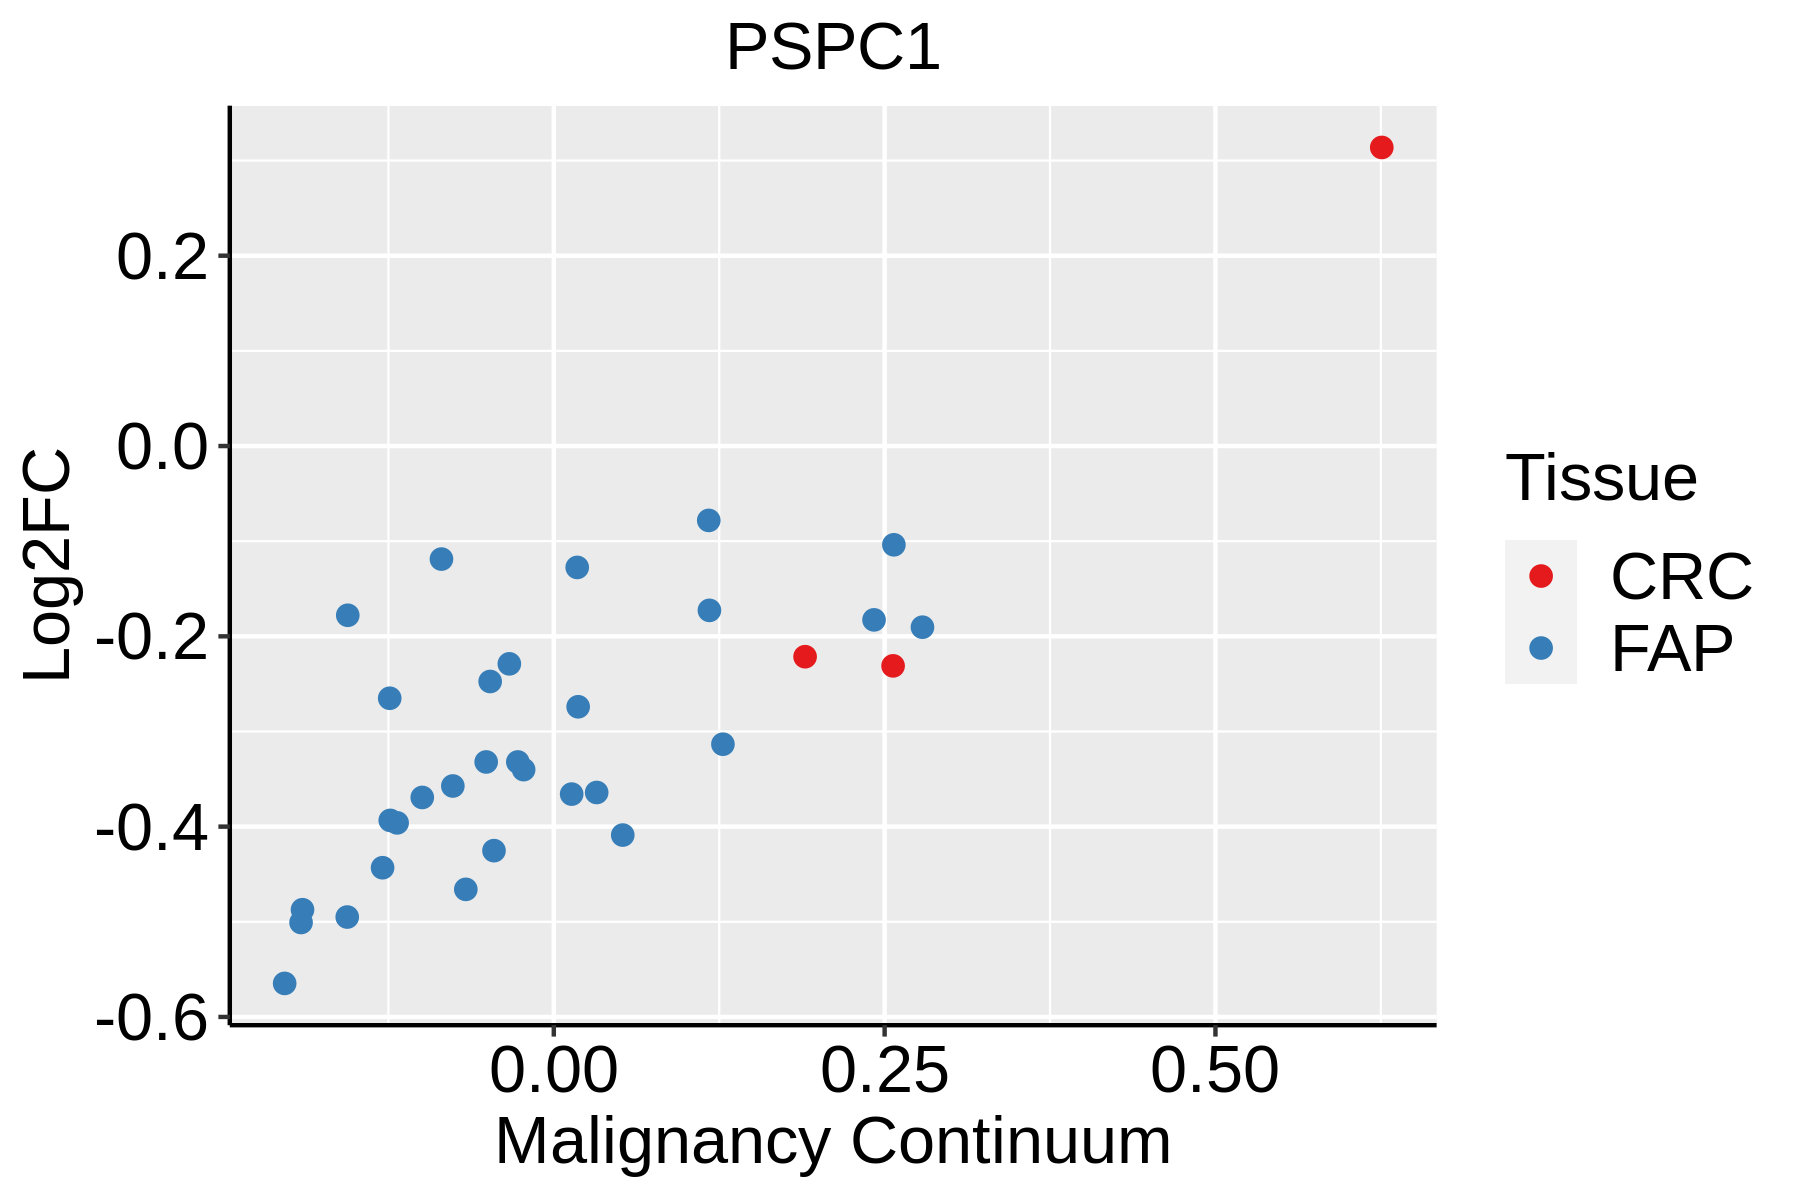 | FAP: Familial adenomatous polyposis |
| CRC: Colorectal cancer | ||
| Colorectum (HTA11) |  | AD: Adenomas |
| SER: Sessile serrated lesions | ||
| MSI-H: Microsatellite-high colorectal cancer | ||
| MSS: Microsatellite stable colorectal cancer | ||
| Endometrium |  | AEH: Atypical endometrial hyperplasia |
| EEC: Endometrioid Cancer | ||
| Esophagus |  | ESCC: Esophageal squamous cell carcinoma |
| HGIN: High-grade intraepithelial neoplasias | ||
| LGIN: Low-grade intraepithelial neoplasias | ||
| Liver | 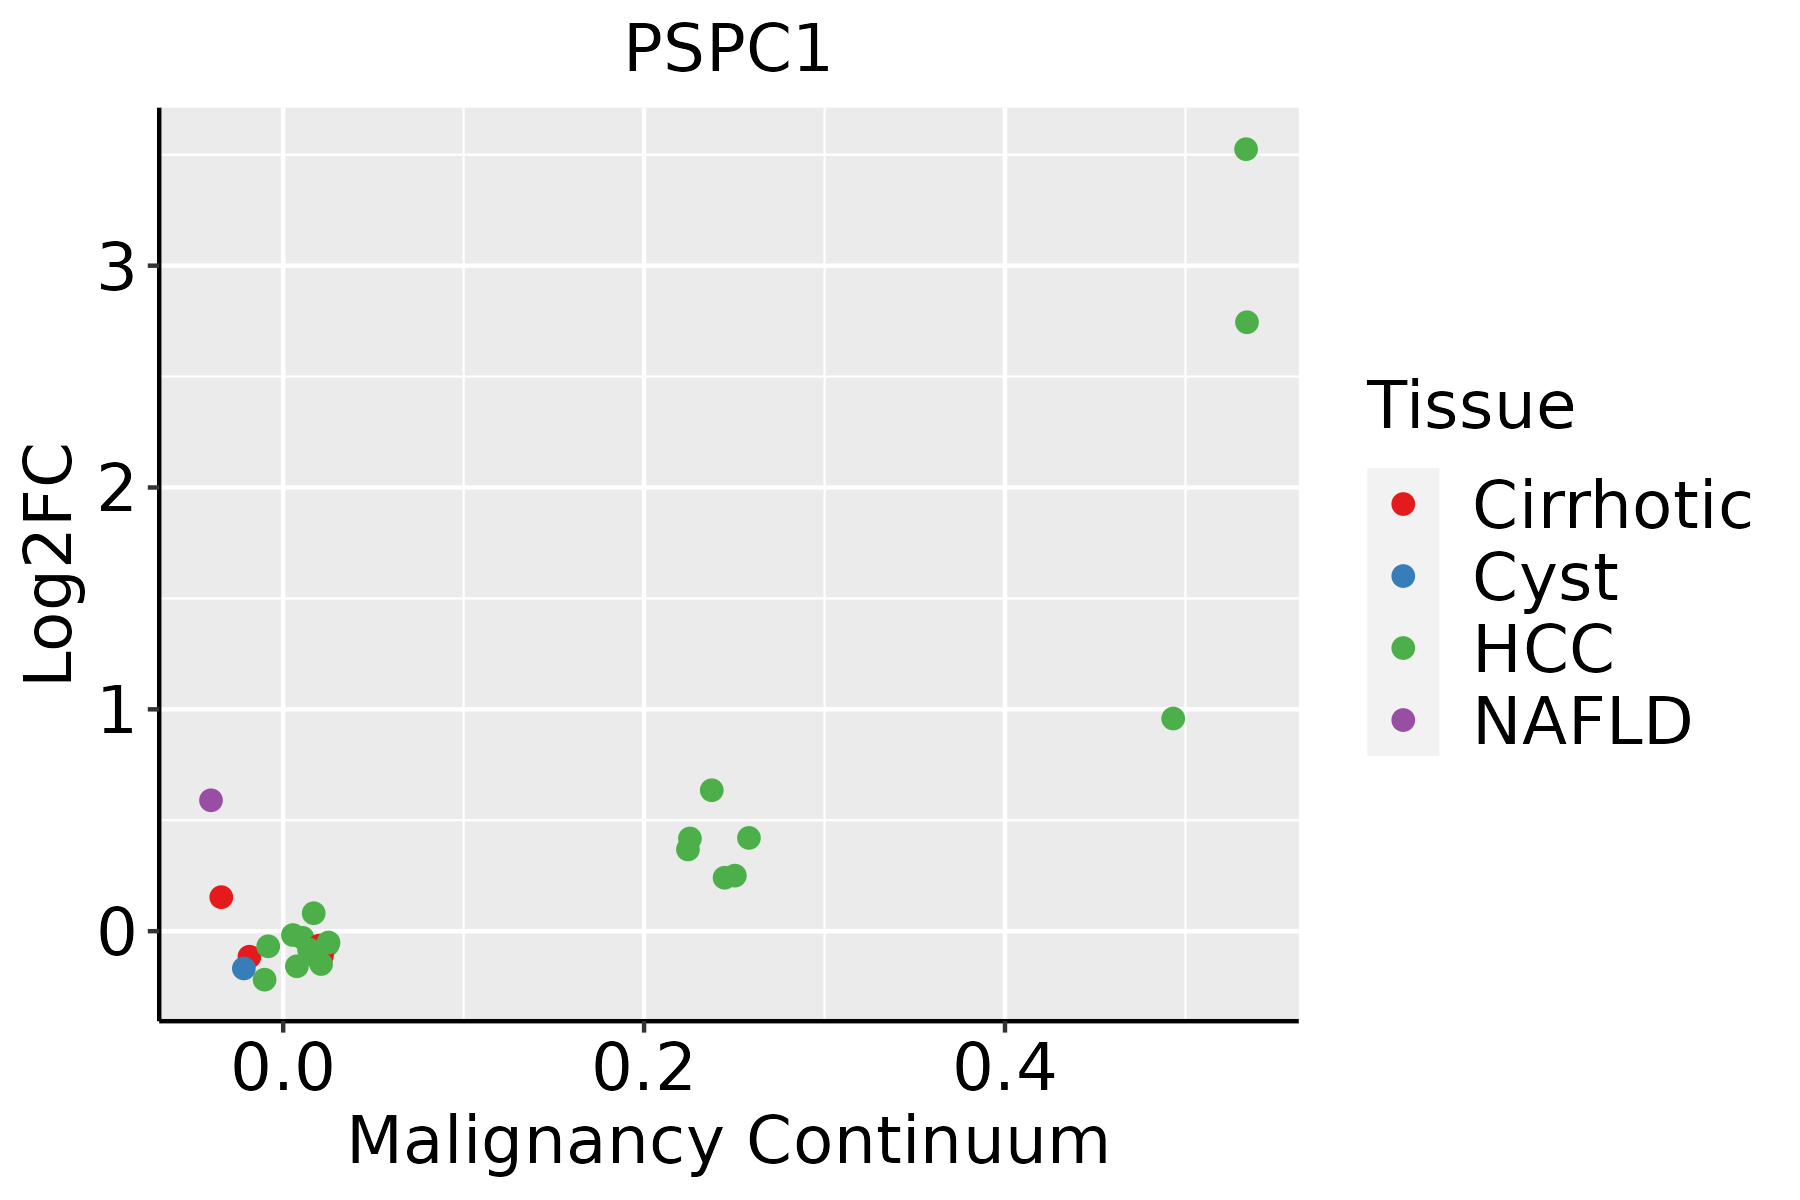 | HCC: Hepatocellular carcinoma |
| NAFLD: Non-alcoholic fatty liver disease | ||
| Lung | 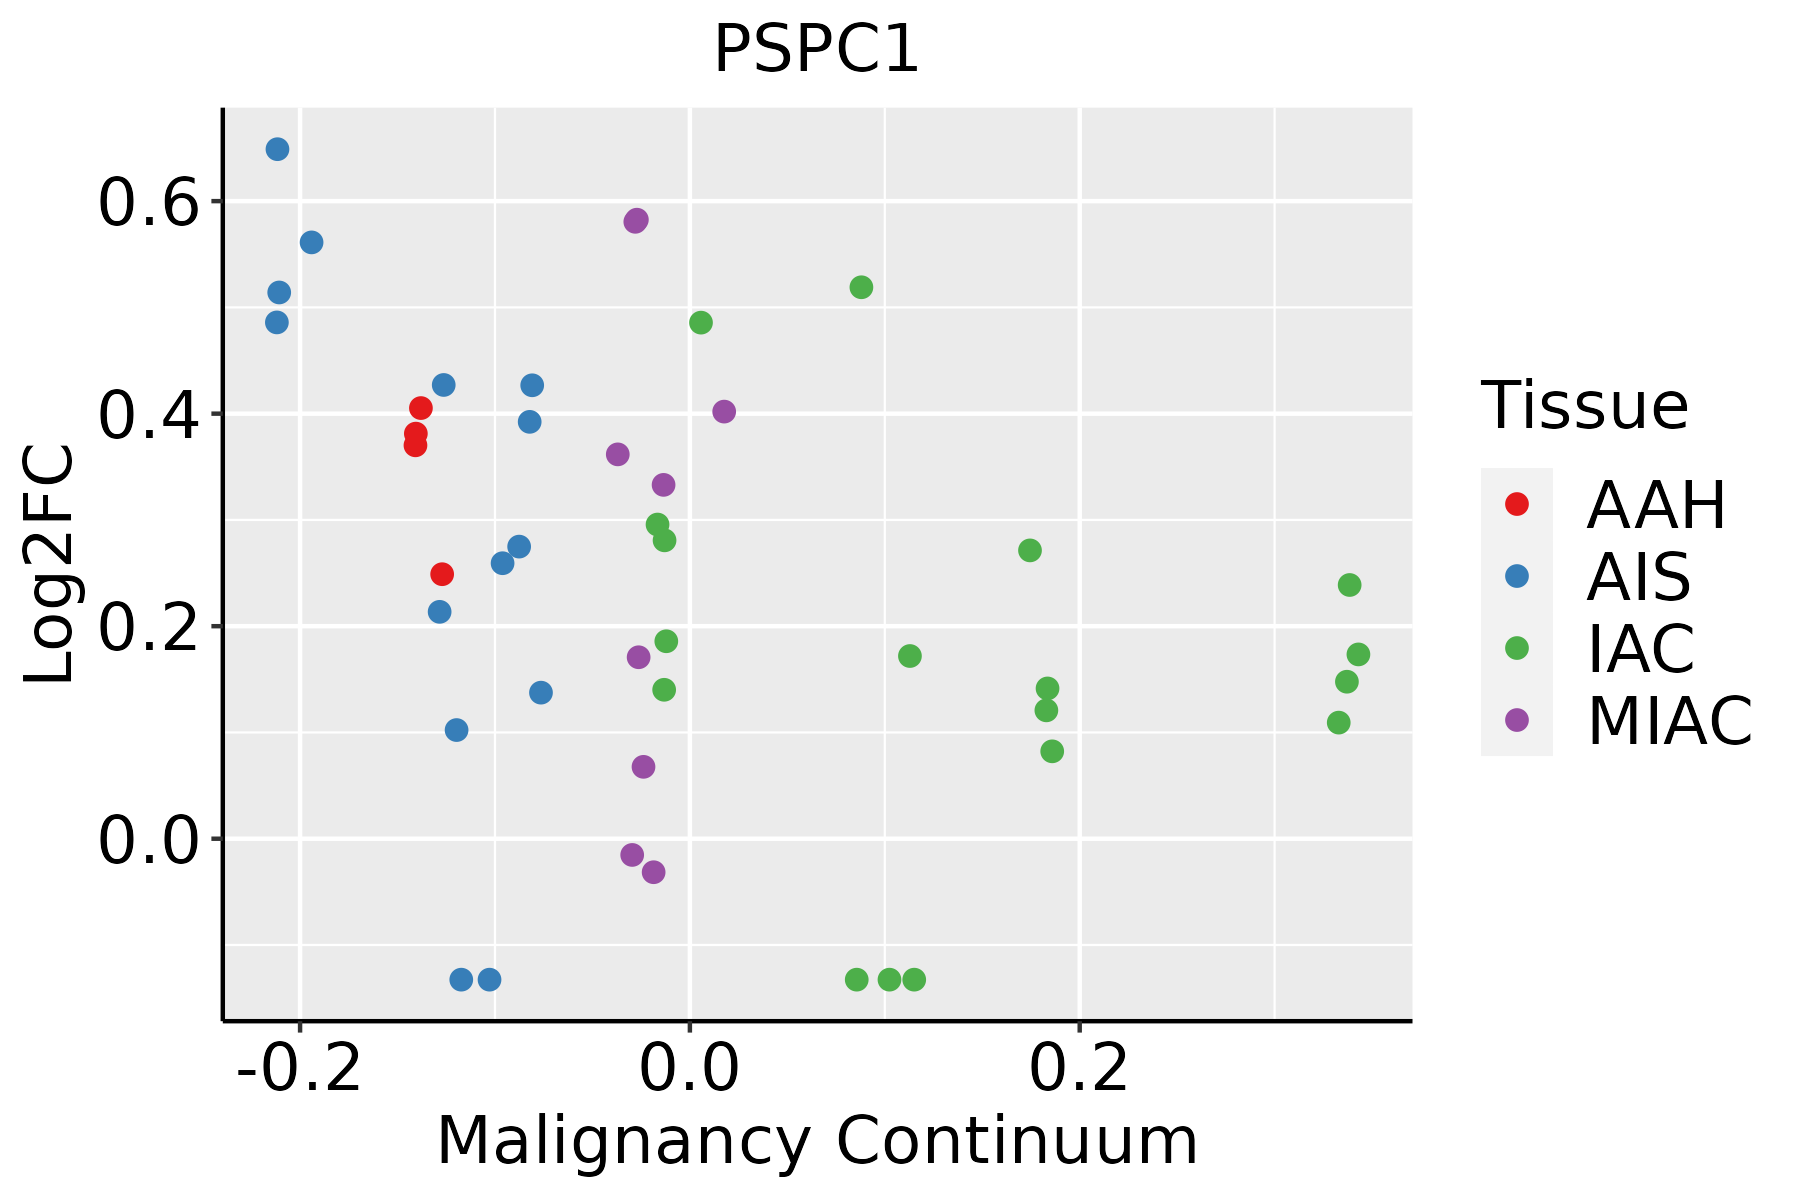 | AAH: Atypical adenomatous hyperplasia |
| AIS: Adenocarcinoma in situ | ||
| IAC: Invasive lung adenocarcinoma | ||
| MIA: Minimally invasive adenocarcinoma | ||
| Oral Cavity | 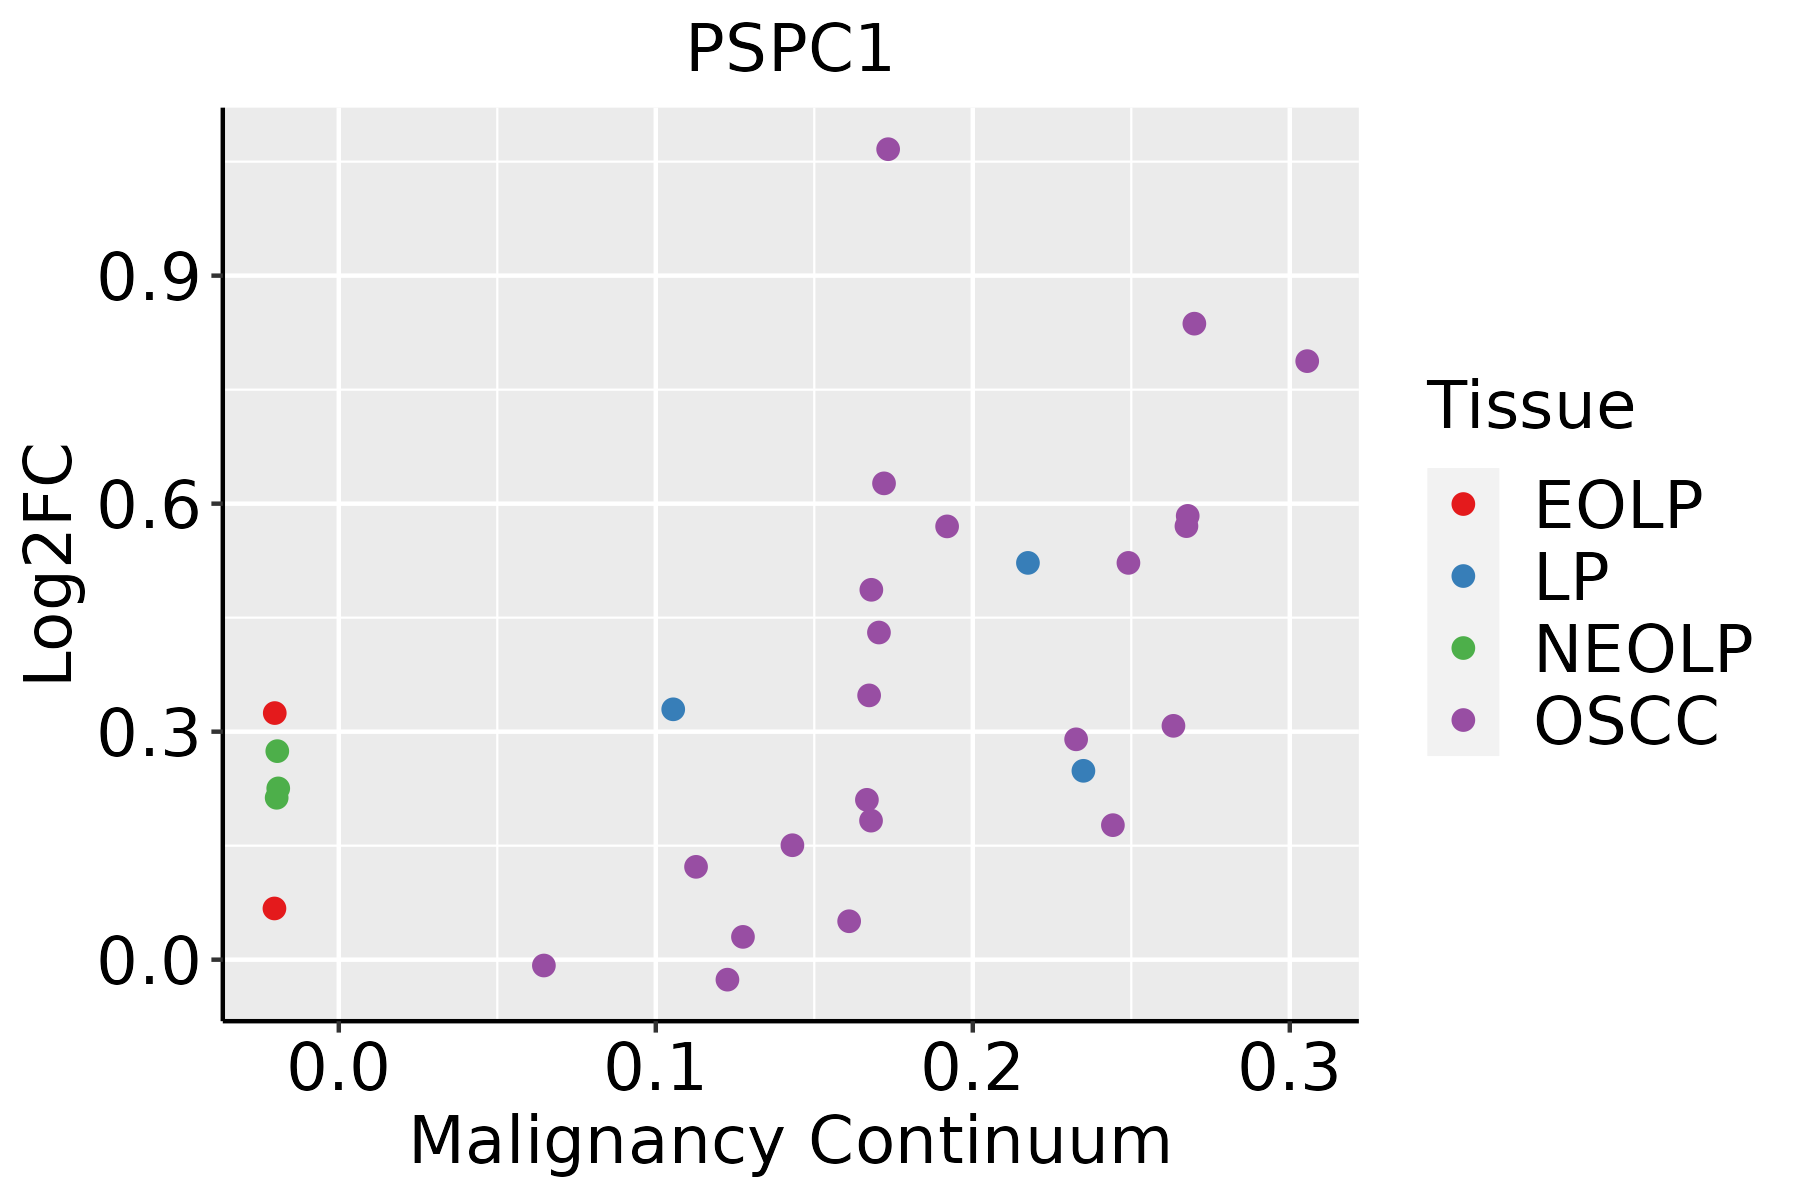 | EOLP: Erosive Oral lichen planus |
| LP: leukoplakia | ||
| NEOLP: Non-erosive oral lichen planus | ||
| OSCC: Oral squamous cell carcinoma | ||
| Skin | 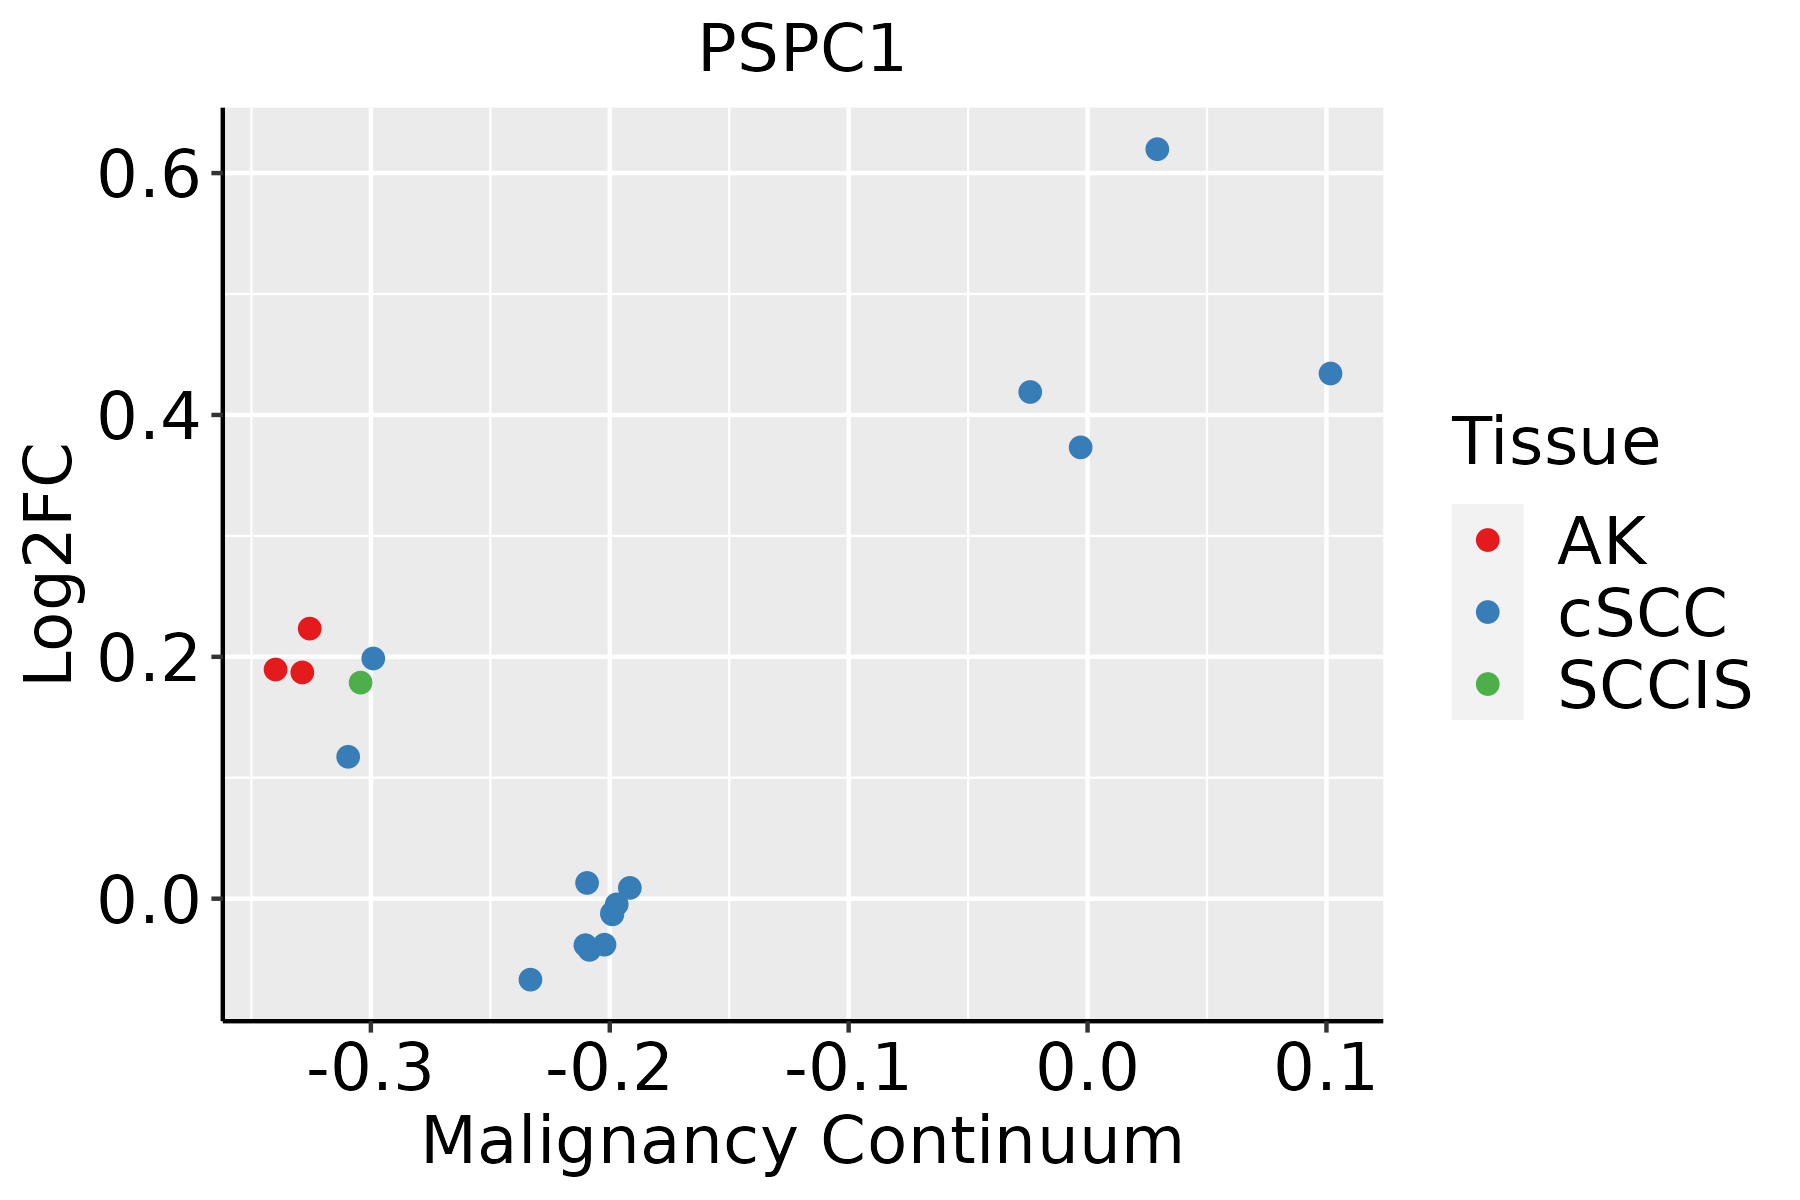 | AK: Actinic keratosis |
| cSCC: Cutaneous squamous cell carcinoma | ||
| SCCIS:squamous cell carcinoma in situ | ||
| Thyroid |  | ATC: Anaplastic thyroid cancer |
| HT: Hashimoto's thyroiditis | ||
| PTC: Papillary thyroid cancer |
| ∗log2FC in expression of this searched gene in stem-like cells from each diseased tissue sample relative to stem-like cells in normal samples in each tissue plotted against the malignancy continuum. Samples are colored based on if they are from different disease stage. |
Top |
Malignant transformation related pathway analysis |
| Find out the enriched GO biological processes and KEGG pathways involved in transition from healthy to precancer to cancer |
| Tissue | Disease Stage | Enriched GO biological Processes |
| Colorectum | AD |  |
| Colorectum | SER |  |
| Colorectum | MSS |  |
| Colorectum | MSI-H |  |
| Colorectum | FAP |  |
| ∗Top 15 enriched GO BP terms are showed in the bar plot of each disease state in each tissue. Each row represents a significant GO biological process which is colored according to the -log10(p.adjust). |
| Page: 1 2 3 4 5 6 7 8 9 |
| GO ID | Tissue | Disease Stage | Description | Gene Ratio | Bg Ratio | pvalue | p.adjust | Count |
| GO:00321035 | Cervix | CC | positive regulation of response to external stimulus | 95/2311 | 427/18723 | 5.44e-09 | 5.03e-07 | 95 |
| GO:00485118 | Cervix | CC | rhythmic process | 65/2311 | 298/18723 | 2.79e-06 | 8.04e-05 | 65 |
| GO:00313494 | Cervix | CC | positive regulation of defense response | 60/2311 | 278/18723 | 9.38e-06 | 2.11e-04 | 60 |
| GO:00028315 | Cervix | CC | regulation of response to biotic stimulus | 67/2311 | 327/18723 | 1.79e-05 | 3.36e-04 | 67 |
| GO:00076238 | Cervix | CC | circadian rhythm | 46/2311 | 210/18723 | 6.76e-05 | 9.60e-04 | 46 |
| GO:00022533 | Cervix | CC | activation of immune response | 72/2311 | 375/18723 | 8.26e-05 | 1.11e-03 | 72 |
| GO:00022183 | Cervix | CC | activation of innate immune response | 16/2311 | 52/18723 | 3.61e-04 | 3.75e-03 | 16 |
| GO:00450882 | Cervix | CC | regulation of innate immune response | 44/2311 | 218/18723 | 6.40e-04 | 5.97e-03 | 44 |
| GO:00028331 | Cervix | CC | positive regulation of response to biotic stimulus | 35/2311 | 168/18723 | 1.23e-03 | 9.87e-03 | 35 |
| GO:0045089 | Cervix | CC | positive regulation of innate immune response | 26/2311 | 131/18723 | 9.33e-03 | 4.66e-02 | 26 |
| GO:0007623 | Colorectum | AD | circadian rhythm | 72/3918 | 210/18723 | 4.50e-06 | 1.21e-04 | 72 |
| GO:0048511 | Colorectum | AD | rhythmic process | 94/3918 | 298/18723 | 1.00e-05 | 2.34e-04 | 94 |
| GO:0042752 | Colorectum | AD | regulation of circadian rhythm | 40/3918 | 121/18723 | 1.24e-03 | 1.09e-02 | 40 |
| GO:00076231 | Colorectum | SER | circadian rhythm | 54/2897 | 210/18723 | 7.98e-05 | 1.77e-03 | 54 |
| GO:00485111 | Colorectum | SER | rhythmic process | 65/2897 | 298/18723 | 2.18e-03 | 2.11e-02 | 65 |
| GO:00427521 | Colorectum | SER | regulation of circadian rhythm | 30/2897 | 121/18723 | 5.03e-03 | 3.88e-02 | 30 |
| GO:00076232 | Colorectum | MSS | circadian rhythm | 69/3467 | 210/18723 | 4.22e-07 | 1.67e-05 | 69 |
| GO:00485112 | Colorectum | MSS | rhythmic process | 89/3467 | 298/18723 | 1.17e-06 | 3.96e-05 | 89 |
| GO:00427522 | Colorectum | MSS | regulation of circadian rhythm | 38/3467 | 121/18723 | 4.33e-04 | 5.23e-03 | 38 |
| GO:00076233 | Colorectum | FAP | circadian rhythm | 56/2622 | 210/18723 | 9.12e-07 | 4.14e-05 | 56 |
| Page: 1 2 3 4 5 |
| Pathway ID | Tissue | Disease Stage | Description | Gene Ratio | Bg Ratio | pvalue | p.adjust | qvalue | Count |
| Page: 1 |
Top |
Cell-cell communication analysis |
| Identification of potential cell-cell interactions between two cell types and their ligand-receptor pairs for different disease states |
| Ligand | Receptor | LRpair | Pathway | Tissue | Disease Stage |
| Page: 1 |
Top |
Single-cell gene regulatory network inference analysis |
| Find out the significant the regulons (TFs) and the target genes of each regulon across cell types for different disease states |
| TF | Cell Type | Tissue | Disease Stage | Target Gene | RSS | Regulon Activity |
| ∗The dot plots of a searched regulon are shown for all cell subpopulations in each disease state of each tissue based on the regulon specific score inferred using pySCENIC and by calculating the average expression. |
| Page: 1 |
Top |
Somatic mutation of malignant transformation related genes |
| Annotation of somatic variants for genes involved in malignant transformation |
| Hugo Symbol | Variant Class | Variant Classification | dbSNP RS | HGVSc | HGVSp | HGVSp Short | SWISSPROT | BIOTYPE | SIFT | PolyPhen | Tumor Sample Barcode | Tissue | Histology | Sex | Age | Stage | Therapy Types | Drugs | Outcome |
| PSPC1 | SNV | Missense_Mutation | c.1244N>G | p.Asn415Ser | p.N415S | Q8WXF1 | protein_coding | tolerated(0.2) | benign(0.037) | TCGA-BH-A18G-01 | Breast | breast invasive carcinoma | Female | >=65 | I/II | Unknown | Unknown | SD | |
| PSPC1 | SNV | Missense_Mutation | novel | c.1414N>A | p.Pro472Thr | p.P472T | Q8WXF1 | protein_coding | deleterious(0.02) | probably_damaging(0.981) | TCGA-D8-A1XQ-01 | Breast | breast invasive carcinoma | Female | >=65 | I/II | Unknown | Unknown | SD |
| PSPC1 | SNV | Missense_Mutation | c.1003N>A | p.Glu335Lys | p.E335K | Q8WXF1 | protein_coding | deleterious(0.03) | probably_damaging(0.997) | TCGA-D8-A1Y1-01 | Breast | breast invasive carcinoma | Female | >=65 | III/IV | Hormone Therapy | tamoxiphen | PD | |
| PSPC1 | SNV | Missense_Mutation | c.1360C>G | p.Pro454Ala | p.P454A | Q8WXF1 | protein_coding | tolerated(0.12) | benign(0.01) | TCGA-IR-A3LA-01 | Cervix | cervical & endocervical cancer | Female | <65 | I/II | Chemotherapy | cisplatin | CR | |
| PSPC1 | SNV | Missense_Mutation | c.241N>T | p.Arg81Cys | p.R81C | Q8WXF1 | protein_coding | deleterious(0.01) | benign(0.188) | TCGA-IR-A3LK-01 | Cervix | cervical & endocervical cancer | Female | >=65 | I/II | Chemotherapy | cisplatin | PD | |
| PSPC1 | SNV | Missense_Mutation | rs780662375 | c.1220C>T | p.Ala407Val | p.A407V | Q8WXF1 | protein_coding | tolerated(0.15) | benign(0.028) | TCGA-MU-A5YI-01 | Cervix | cervical & endocervical cancer | Female | <65 | I/II | Unknown | Unknown | PD |
| PSPC1 | SNV | Missense_Mutation | c.1033C>T | p.Arg345Trp | p.R345W | Q8WXF1 | protein_coding | deleterious(0) | probably_damaging(0.991) | TCGA-A6-6653-01 | Colorectum | colon adenocarcinoma | Male | >=65 | I/II | Unknown | Unknown | SD | |
| PSPC1 | SNV | Missense_Mutation | c.951N>C | p.Leu317Phe | p.L317F | Q8WXF1 | protein_coding | deleterious(0.02) | benign(0.434) | TCGA-AA-3510-01 | Colorectum | colon adenocarcinoma | Male | >=65 | I/II | Unknown | Unknown | SD | |
| PSPC1 | SNV | Missense_Mutation | rs776499795 | c.1267N>A | p.Gly423Ser | p.G423S | Q8WXF1 | protein_coding | deleterious(0.02) | probably_damaging(0.986) | TCGA-AA-3713-01 | Colorectum | colon adenocarcinoma | Male | >=65 | III/IV | Chemotherapy | 5-fluorouracil | PR |
| PSPC1 | SNV | Missense_Mutation | novel | c.695N>C | p.Val232Ala | p.V232A | Q8WXF1 | protein_coding | deleterious(0.02) | benign(0.257) | TCGA-AA-3811-01 | Colorectum | colon adenocarcinoma | Female | >=65 | III/IV | Unknown | Unknown | PD |
| Page: 1 2 3 4 5 6 7 8 9 |
Top |
Related drugs of malignant transformation related genes |
| Identification of chemicals and drugs interact with genes involved in malignant transfromation |
| (DGIdb 4.0) |
| Entrez ID | Symbol | Category | Interaction Types | Drug Claim Name | Drug Name | PMIDs |
| Page: 1 |

Copyright 2023-Present -The University of Texas Health Science Center at Houston |