
|
|||||
|
 | |
| |
| |
| |
| |
| |
|
Gene: PSORS1C1 |
Gene summary for PSORS1C1 |
| Gene information | Species | Human | Gene symbol | PSORS1C1 | Gene ID | 170679 |
| Gene name | psoriasis susceptibility 1 candidate 1 | |
| Gene Alias | C6orf16 | |
| Cytomap | 6p21.33 | |
| Gene Type | protein-coding | GO ID | NA | UniProtAcc | D2IYL0 |
Top |
Malignant transformation analysis |
| Identification of the aberrant gene expression in precancerous and cancerous lesions by comparing the gene expression of stem-like cells in diseased tissues with normal stem cells |
| Entrez ID | Symbol | Replicates | Species | Organ | Tissue | Adj P-value | Log2FC | Malignancy |
| 170679 | PSORS1C1 | C04 | Human | Oral cavity | OSCC | 3.37e-16 | 5.69e-01 | 0.2633 |
| 170679 | PSORS1C1 | C21 | Human | Oral cavity | OSCC | 3.90e-35 | 8.08e-01 | 0.2678 |
| 170679 | PSORS1C1 | C30 | Human | Oral cavity | OSCC | 1.70e-29 | 1.03e+00 | 0.3055 |
| 170679 | PSORS1C1 | C51 | Human | Oral cavity | OSCC | 2.14e-06 | 3.28e-01 | 0.2674 |
| 170679 | PSORS1C1 | C06 | Human | Oral cavity | OSCC | 6.22e-04 | 3.38e-01 | 0.2699 |
| 170679 | PSORS1C1 | C07 | Human | Oral cavity | OSCC | 4.58e-04 | 5.05e-01 | 0.2491 |
| 170679 | PSORS1C1 | C08 | Human | Oral cavity | OSCC | 4.24e-06 | 1.58e-01 | 0.1919 |
| 170679 | PSORS1C1 | LP15 | Human | Oral cavity | LP | 9.93e-03 | 3.53e-01 | 0.2174 |
| 170679 | PSORS1C1 | SYSMH2 | Human | Oral cavity | OSCC | 4.32e-07 | 1.82e-01 | 0.2326 |
| 170679 | PSORS1C1 | SYSMH3 | Human | Oral cavity | OSCC | 7.39e-19 | 3.69e-01 | 0.2442 |
| 170679 | PSORS1C1 | SYSMH5 | Human | Oral cavity | OSCC | 4.24e-06 | 1.20e-01 | 0.0647 |
| Page: 1 |
| Tissue | Expression Dynamics | Abbreviation |
| Oral Cavity | 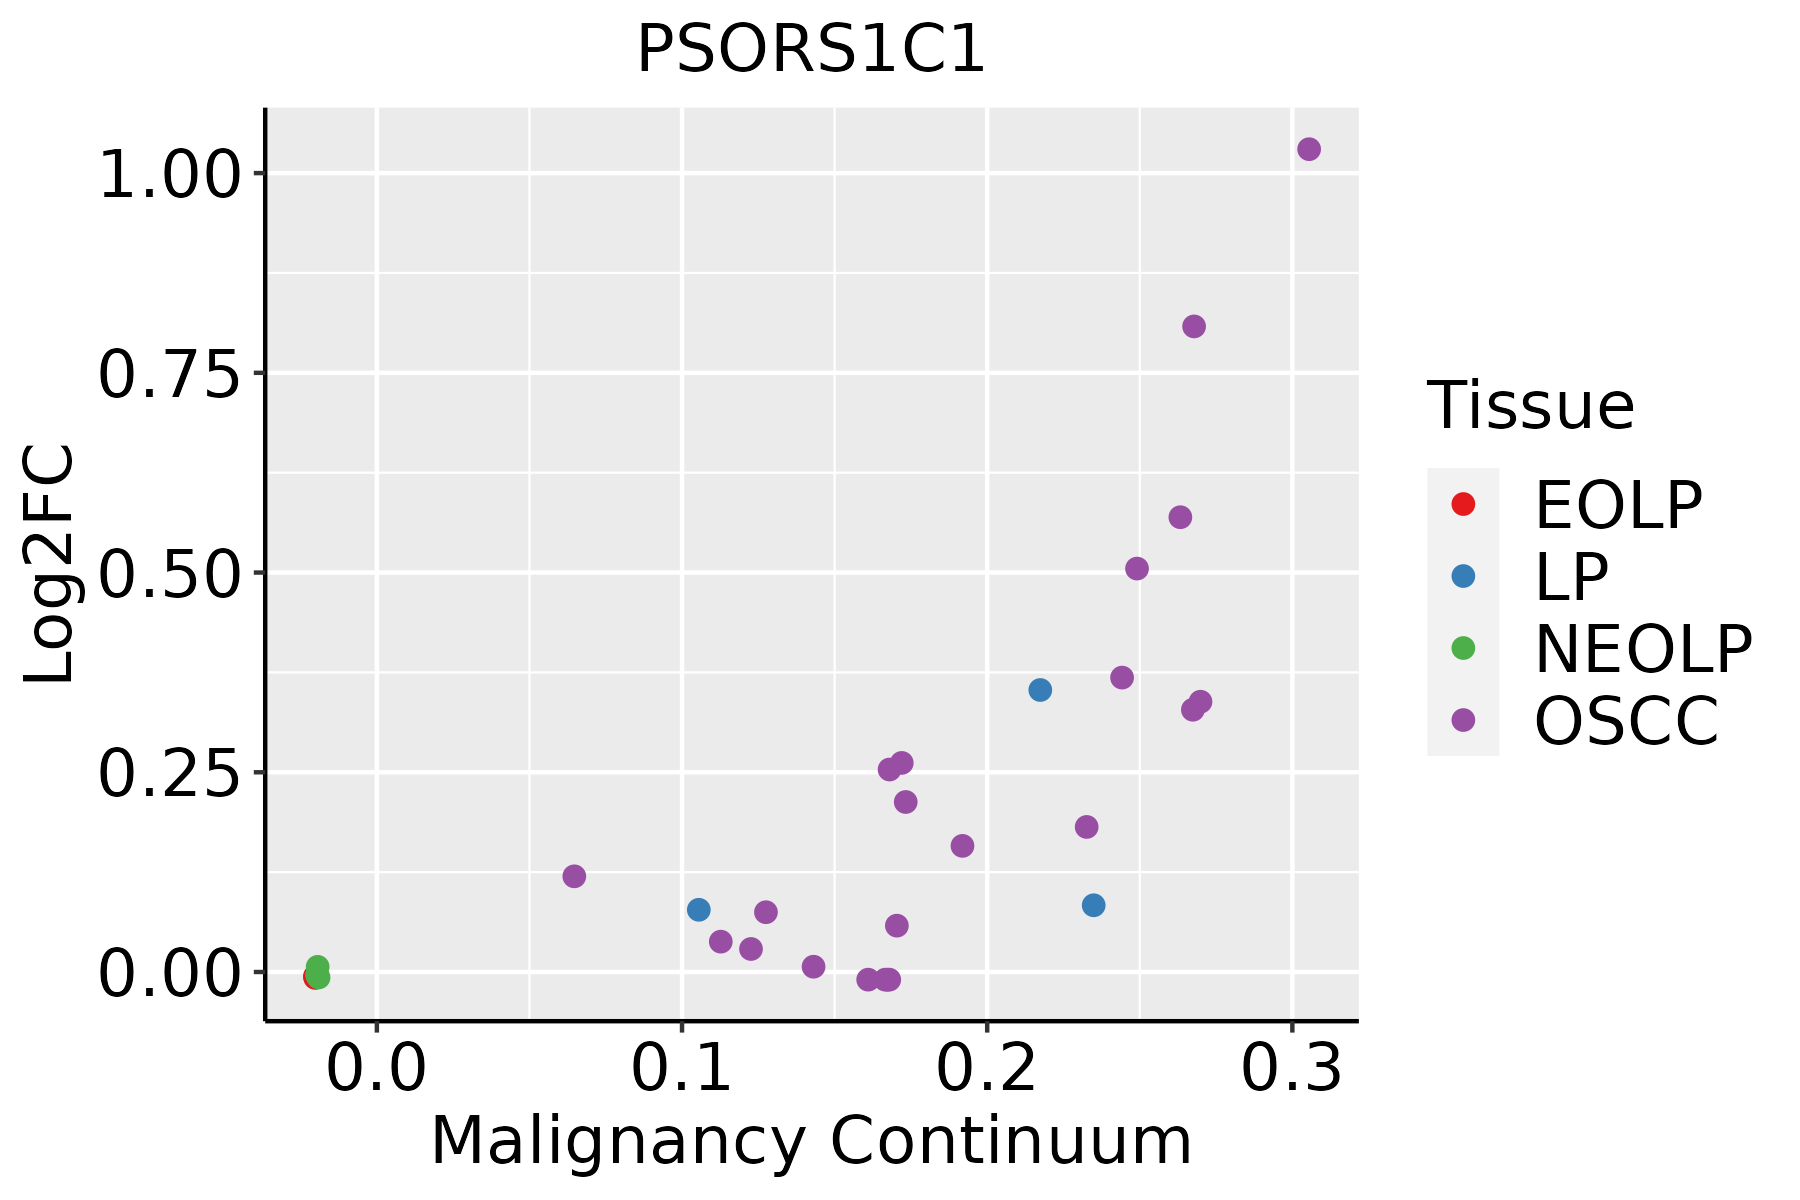 | EOLP: Erosive Oral lichen planus |
| LP: leukoplakia | ||
| NEOLP: Non-erosive oral lichen planus | ||
| OSCC: Oral squamous cell carcinoma |
| ∗log2FC in expression of this searched gene in stem-like cells from each diseased tissue sample relative to stem-like cells in normal samples in each tissue plotted against the malignancy continuum. Samples are colored based on if they are from different disease stage. |
Top |
Malignant transformation related pathway analysis |
| Find out the enriched GO biological processes and KEGG pathways involved in transition from healthy to precancer to cancer |
| Tissue | Disease Stage | Enriched GO biological Processes |
| Colorectum | AD |  |
| Colorectum | SER |  |
| Colorectum | MSS |  |
| Colorectum | MSI-H |  |
| Colorectum | FAP |  |
| ∗Top 15 enriched GO BP terms are showed in the bar plot of each disease state in each tissue. Each row represents a significant GO biological process which is colored according to the -log10(p.adjust). |
| Page: 1 2 3 4 5 6 7 8 9 |
| GO ID | Tissue | Disease Stage | Description | Gene Ratio | Bg Ratio | pvalue | p.adjust | Count |
| Page: 1 |
| Pathway ID | Tissue | Disease Stage | Description | Gene Ratio | Bg Ratio | pvalue | p.adjust | qvalue | Count |
| Page: 1 |
Top |
Cell-cell communication analysis |
| Identification of potential cell-cell interactions between two cell types and their ligand-receptor pairs for different disease states |
| Ligand | Receptor | LRpair | Pathway | Tissue | Disease Stage |
| Page: 1 |
Top |
Single-cell gene regulatory network inference analysis |
| Find out the significant the regulons (TFs) and the target genes of each regulon across cell types for different disease states |
| TF | Cell Type | Tissue | Disease Stage | Target Gene | RSS | Regulon Activity |
| ∗The dot plots of a searched regulon are shown for all cell subpopulations in each disease state of each tissue based on the regulon specific score inferred using pySCENIC and by calculating the average expression. |
| Page: 1 |
Top |
Somatic mutation of malignant transformation related genes |
| Annotation of somatic variants for genes involved in malignant transformation |
| Hugo Symbol | Variant Class | Variant Classification | dbSNP RS | HGVSc | HGVSp | HGVSp Short | SWISSPROT | BIOTYPE | SIFT | PolyPhen | Tumor Sample Barcode | Tissue | Histology | Sex | Age | Stage | Therapy Types | Drugs | Outcome |
| PSORS1C1 | SNV | Missense_Mutation | novel | c.63N>T | p.Leu21Phe | p.L21F | Q9UIG5 | protein_coding | deleterious_low_confidence(0) | possibly_damaging(0.865) | TCGA-LL-A6FQ-01 | Breast | breast invasive carcinoma | Female | >=65 | III/IV | Unknown | Unknown | SD |
| PSORS1C1 | SNV | Missense_Mutation | novel | c.272N>A | p.Ser91Tyr | p.S91Y | Q9UIG5 | protein_coding | deleterious_low_confidence(0) | possibly_damaging(0.813) | TCGA-CA-6717-01 | Colorectum | colon adenocarcinoma | Male | <65 | I/II | Chemotherapy | oxaliplatin | CR |
| PSORS1C1 | SNV | Missense_Mutation | novel | c.76N>T | p.Leu26Phe | p.L26F | Q9UIG5 | protein_coding | deleterious_low_confidence(0) | possibly_damaging(0.899) | TCGA-D5-6928-01 | Colorectum | colon adenocarcinoma | Male | >=65 | I/II | Unknown | Unknown | SD |
| PSORS1C1 | SNV | Missense_Mutation | novel | c.4A>G | p.Thr2Ala | p.T2A | Q9UIG5 | protein_coding | benign(0.052) | TCGA-F5-6814-01 | Colorectum | rectum adenocarcinoma | Male | <65 | I/II | Unknown | Unknown | SD | |
| PSORS1C1 | SNV | Missense_Mutation | novel | c.115N>T | p.Pro39Ser | p.P39S | Q9UIG5 | protein_coding | benign(0.003) | TCGA-A5-A0G1-01 | Endometrium | uterine corpus endometrioid carcinoma | Female | >=65 | I/II | Unknown | Unknown | SD | |
| PSORS1C1 | SNV | Missense_Mutation | novel | c.409T>C | p.Tyr137His | p.Y137H | Q9UIG5 | protein_coding | tolerated_low_confidence(0.38) | benign(0) | TCGA-AJ-A3EL-01 | Endometrium | uterine corpus endometrioid carcinoma | Female | <65 | I/II | Unknown | Unknown | SD |
| PSORS1C1 | SNV | Missense_Mutation | novel | c.147G>A | p.Met49Ile | p.M49I | Q9UIG5 | protein_coding | tolerated_low_confidence(0.2) | benign(0.159) | TCGA-B5-A1MX-01 | Endometrium | uterine corpus endometrioid carcinoma | Female | <65 | I/II | Hormone Therapy | megace | SD |
| PSORS1C1 | SNV | Missense_Mutation | novel | c.455N>A | p.Ile152Asn | p.I152N | Q9UIG5 | protein_coding | deleterious_low_confidence(0) | benign(0.065) | TCGA-FI-A2F4-01 | Endometrium | uterine corpus endometrioid carcinoma | Female | <65 | I/II | Unknown | Unknown | SD |
| PSORS1C1 | SNV | Missense_Mutation | rs540640358 | c.109N>T | p.Arg37Cys | p.R37C | Q9UIG5 | protein_coding | tolerated_low_confidence(0.08) | benign(0) | TCGA-56-A62T-01 | Lung | lung squamous cell carcinoma | Male | >=65 | I/II | Chemotherapy | carboplatin | CR |
| PSORS1C1 | deletion | Frame_Shift_Del | novel | c.434delC | p.Pro145LeufsTer7 | p.P145Lfs*7 | Q9UIG5 | protein_coding | TCGA-66-2744-01 | Lung | lung squamous cell carcinoma | Male | >=65 | I/II | Unknown | Unknown | SD |
| Page: 1 |
Top |
Related drugs of malignant transformation related genes |
| Identification of chemicals and drugs interact with genes involved in malignant transfromation |
| (DGIdb 4.0) |
| Entrez ID | Symbol | Category | Interaction Types | Drug Claim Name | Drug Name | PMIDs |
| 170679 | PSORS1C1 | NA | carboplatin | CARBOPLATIN | 31616045 | |
| 170679 | PSORS1C1 | NA | etanercept | ETANERCEPT | ||
| 170679 | PSORS1C1 | NA | gemcitabine | GEMCITABINE | 31616045 | |
| 170679 | PSORS1C1 | NA | allopurinol | ALLOPURINOL | 21801394,29193002 |
| Page: 1 |

Copyright 2023-Present -The University of Texas Health Science Center at Houston |