
|
|||||
|
 | |
| |
| |
| |
| |
| |
|
Gene: PSMG4 |
Gene summary for PSMG4 |
| Gene information | Species | Human | Gene symbol | PSMG4 | Gene ID | 389362 |
| Gene name | proteasome assembly chaperone 4 | |
| Gene Alias | C6orf86 | |
| Cytomap | 6p25.2 | |
| Gene Type | protein-coding | GO ID | GO:0008150 | UniProtAcc | Q5JS54 |
Top |
Malignant transformation analysis |
| Identification of the aberrant gene expression in precancerous and cancerous lesions by comparing the gene expression of stem-like cells in diseased tissues with normal stem cells |
| Entrez ID | Symbol | Replicates | Species | Organ | Tissue | Adj P-value | Log2FC | Malignancy |
| 389362 | PSMG4 | LZE4T | Human | Esophagus | ESCC | 6.18e-05 | 1.10e-01 | 0.0811 |
| 389362 | PSMG4 | LZE5T | Human | Esophagus | ESCC | 1.50e-05 | 5.05e-01 | 0.0514 |
| 389362 | PSMG4 | LZE7T | Human | Esophagus | ESCC | 3.07e-16 | 8.33e-01 | 0.0667 |
| 389362 | PSMG4 | LZE20T | Human | Esophagus | ESCC | 1.01e-06 | 3.70e-01 | 0.0662 |
| 389362 | PSMG4 | LZE22D1 | Human | Esophagus | HGIN | 1.40e-03 | 1.16e-01 | 0.0595 |
| 389362 | PSMG4 | LZE22T | Human | Esophagus | ESCC | 1.08e-04 | 5.92e-01 | 0.068 |
| 389362 | PSMG4 | LZE24T | Human | Esophagus | ESCC | 6.45e-19 | 5.41e-01 | 0.0596 |
| 389362 | PSMG4 | LZE21T | Human | Esophagus | ESCC | 3.56e-09 | 2.63e-01 | 0.0655 |
| 389362 | PSMG4 | LZE6T | Human | Esophagus | ESCC | 2.52e-03 | 2.80e-01 | 0.0845 |
| 389362 | PSMG4 | P1T-E | Human | Esophagus | ESCC | 7.21e-11 | 5.11e-01 | 0.0875 |
| 389362 | PSMG4 | P2T-E | Human | Esophagus | ESCC | 7.53e-29 | 5.52e-01 | 0.1177 |
| 389362 | PSMG4 | P4T-E | Human | Esophagus | ESCC | 1.24e-25 | 7.55e-01 | 0.1323 |
| 389362 | PSMG4 | P5T-E | Human | Esophagus | ESCC | 5.18e-18 | 3.64e-01 | 0.1327 |
| 389362 | PSMG4 | P8T-E | Human | Esophagus | ESCC | 3.58e-23 | 4.14e-01 | 0.0889 |
| 389362 | PSMG4 | P9T-E | Human | Esophagus | ESCC | 2.97e-30 | 7.35e-01 | 0.1131 |
| 389362 | PSMG4 | P10T-E | Human | Esophagus | ESCC | 9.59e-27 | 3.17e-01 | 0.116 |
| 389362 | PSMG4 | P11T-E | Human | Esophagus | ESCC | 3.28e-15 | 1.08e+00 | 0.1426 |
| 389362 | PSMG4 | P12T-E | Human | Esophagus | ESCC | 2.07e-26 | 4.61e-01 | 0.1122 |
| 389362 | PSMG4 | P15T-E | Human | Esophagus | ESCC | 6.02e-16 | 4.76e-01 | 0.1149 |
| 389362 | PSMG4 | P16T-E | Human | Esophagus | ESCC | 8.84e-23 | 4.20e-01 | 0.1153 |
| Page: 1 2 3 4 5 6 |
| Tissue | Expression Dynamics | Abbreviation |
| Esophagus |  | ESCC: Esophageal squamous cell carcinoma |
| HGIN: High-grade intraepithelial neoplasias | ||
| LGIN: Low-grade intraepithelial neoplasias | ||
| Liver |  | HCC: Hepatocellular carcinoma |
| NAFLD: Non-alcoholic fatty liver disease | ||
| Oral Cavity |  | EOLP: Erosive Oral lichen planus |
| LP: leukoplakia | ||
| NEOLP: Non-erosive oral lichen planus | ||
| OSCC: Oral squamous cell carcinoma | ||
| Skin | 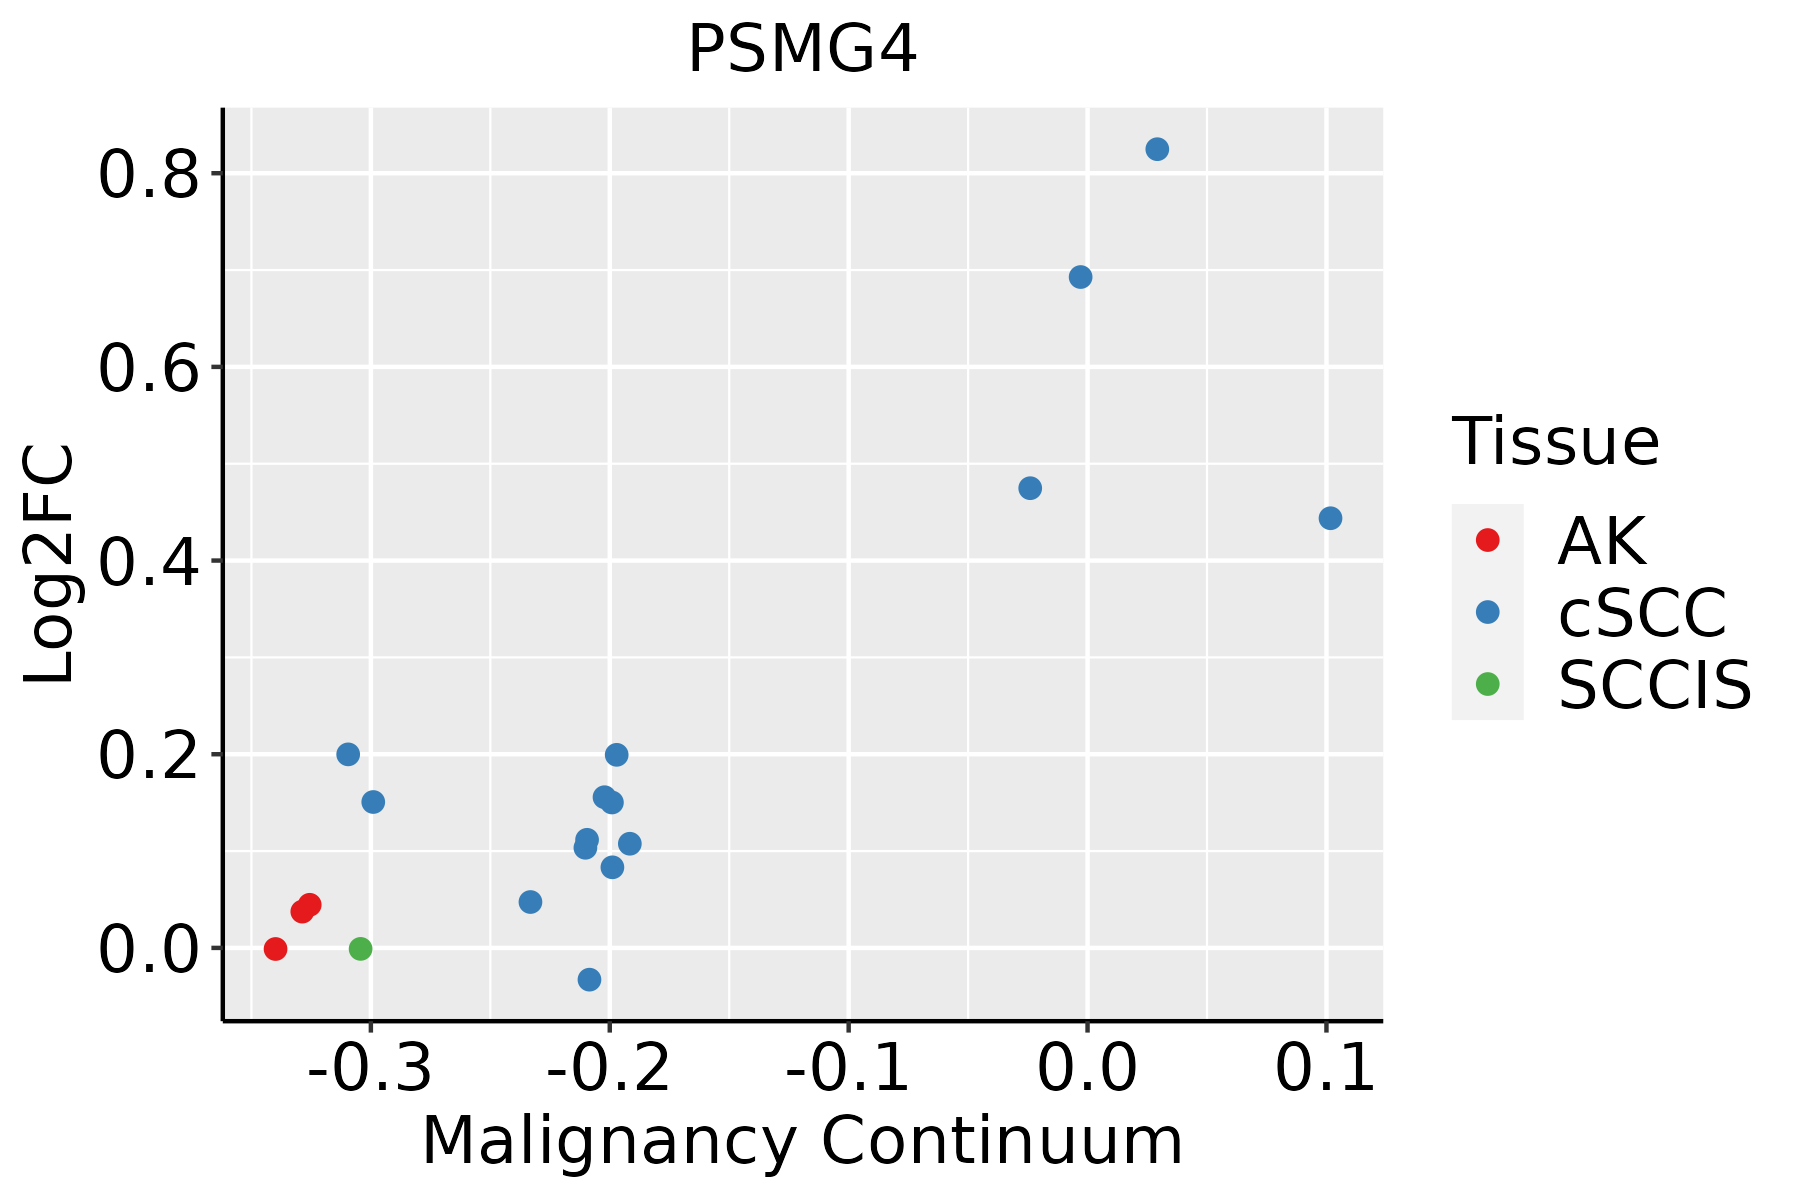 | AK: Actinic keratosis |
| cSCC: Cutaneous squamous cell carcinoma | ||
| SCCIS:squamous cell carcinoma in situ | ||
| Thyroid | 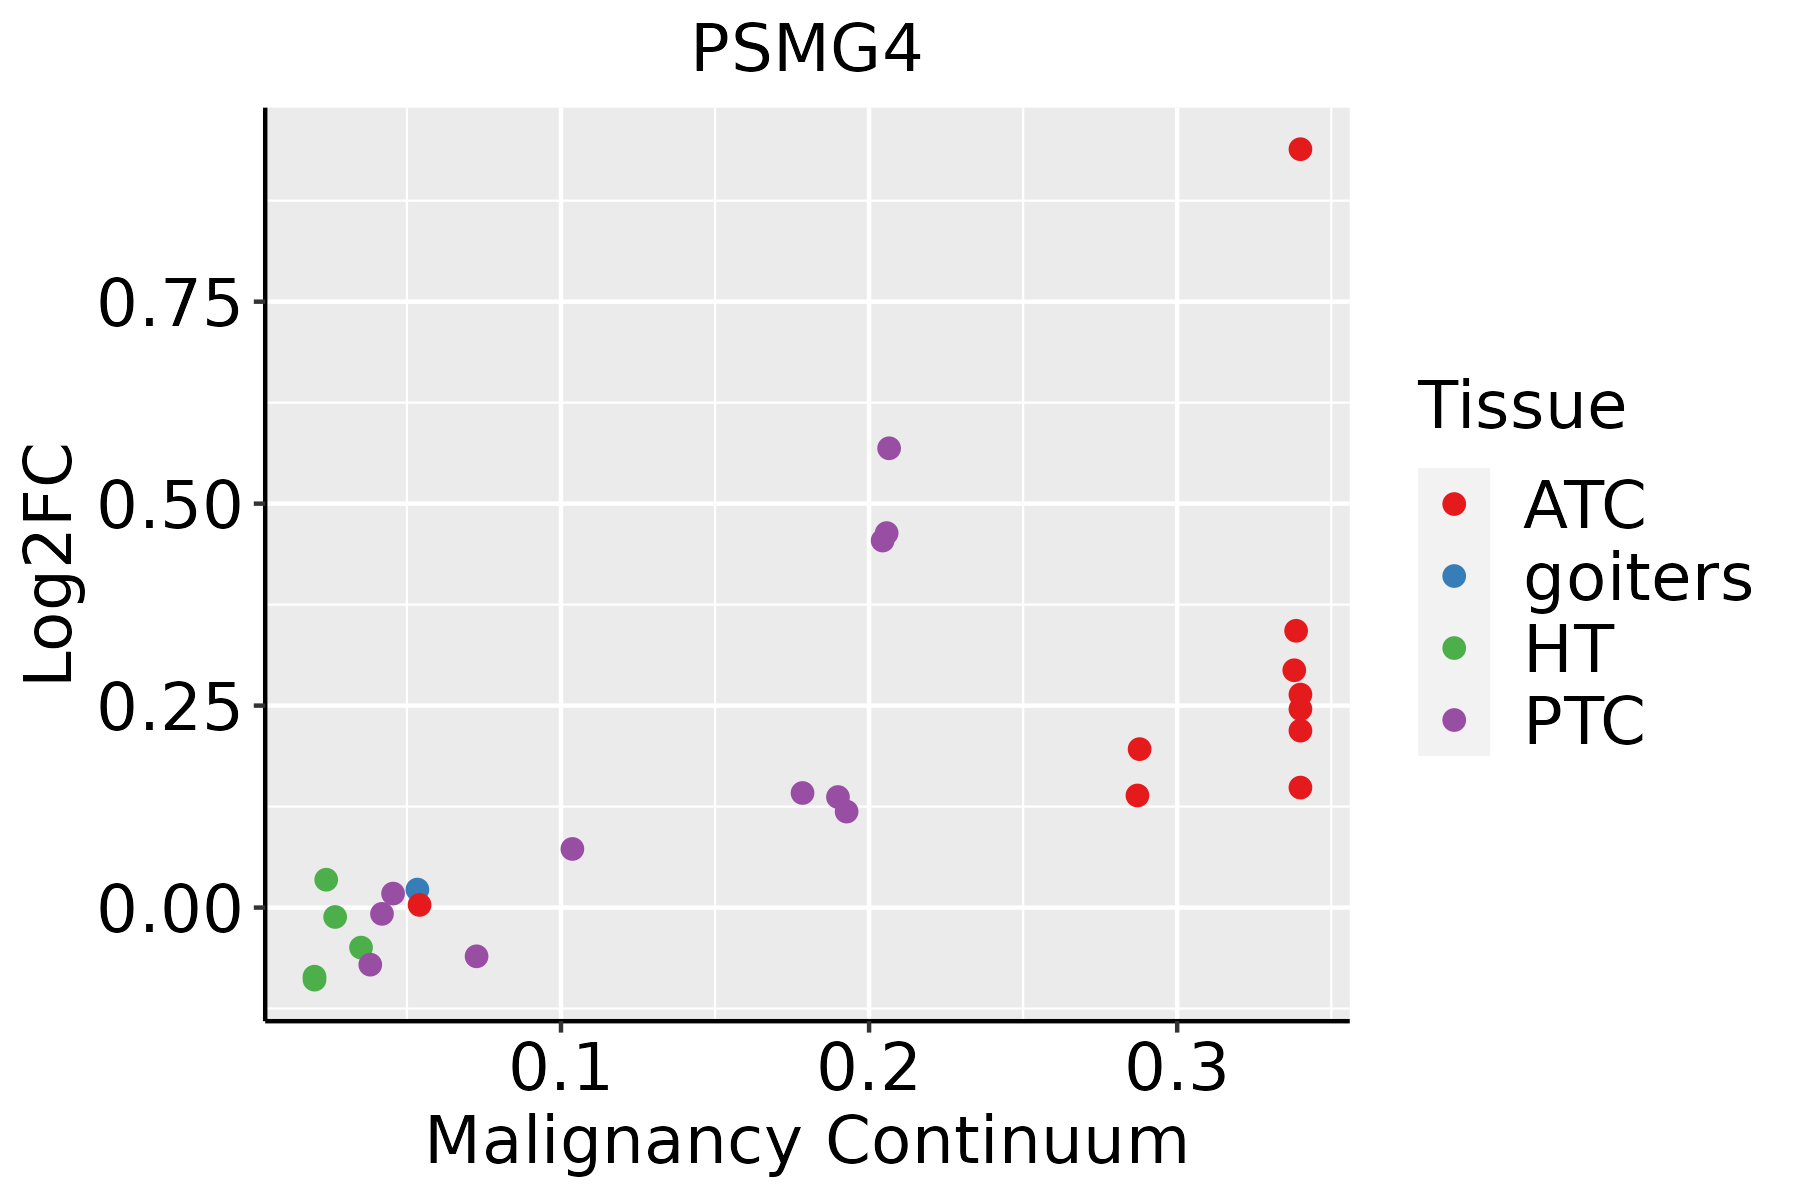 | ATC: Anaplastic thyroid cancer |
| HT: Hashimoto's thyroiditis | ||
| PTC: Papillary thyroid cancer |
| ∗log2FC in expression of this searched gene in stem-like cells from each diseased tissue sample relative to stem-like cells in normal samples in each tissue plotted against the malignancy continuum. Samples are colored based on if they are from different disease stage. |
Top |
Malignant transformation related pathway analysis |
| Find out the enriched GO biological processes and KEGG pathways involved in transition from healthy to precancer to cancer |
| Tissue | Disease Stage | Enriched GO biological Processes |
| Colorectum | AD |  |
| Colorectum | SER |  |
| Colorectum | MSS |  |
| Colorectum | MSI-H |  |
| Colorectum | FAP |  |
| ∗Top 15 enriched GO BP terms are showed in the bar plot of each disease state in each tissue. Each row represents a significant GO biological process which is colored according to the -log10(p.adjust). |
| Page: 1 2 3 4 5 6 7 8 9 |
| GO ID | Tissue | Disease Stage | Description | Gene Ratio | Bg Ratio | pvalue | p.adjust | Count |
| GO:00432483 | Esophagus | HGIN | proteasome assembly | 6/2587 | 12/18723 | 3.03e-03 | 2.88e-02 | 6 |
| GO:004324811 | Esophagus | ESCC | proteasome assembly | 11/8552 | 12/18723 | 1.26e-03 | 6.06e-03 | 11 |
| GO:0043248 | Liver | Cirrhotic | proteasome assembly | 9/4634 | 12/18723 | 3.59e-04 | 3.03e-03 | 9 |
| GO:00432481 | Liver | HCC | proteasome assembly | 12/7958 | 12/18723 | 3.46e-05 | 3.45e-04 | 12 |
| GO:00432482 | Oral cavity | OSCC | proteasome assembly | 11/7305 | 12/18723 | 2.45e-04 | 1.57e-03 | 11 |
| GO:00432484 | Skin | cSCC | proteasome assembly | 10/4864 | 12/18723 | 5.36e-05 | 5.38e-04 | 10 |
| Page: 1 |
| Pathway ID | Tissue | Disease Stage | Description | Gene Ratio | Bg Ratio | pvalue | p.adjust | qvalue | Count |
| Page: 1 |
Top |
Cell-cell communication analysis |
| Identification of potential cell-cell interactions between two cell types and their ligand-receptor pairs for different disease states |
| Ligand | Receptor | LRpair | Pathway | Tissue | Disease Stage |
| Page: 1 |
Top |
Single-cell gene regulatory network inference analysis |
| Find out the significant the regulons (TFs) and the target genes of each regulon across cell types for different disease states |
| TF | Cell Type | Tissue | Disease Stage | Target Gene | RSS | Regulon Activity |
| ∗The dot plots of a searched regulon are shown for all cell subpopulations in each disease state of each tissue based on the regulon specific score inferred using pySCENIC and by calculating the average expression. |
| Page: 1 |
Top |
Somatic mutation of malignant transformation related genes |
| Annotation of somatic variants for genes involved in malignant transformation |
| Hugo Symbol | Variant Class | Variant Classification | dbSNP RS | HGVSc | HGVSp | HGVSp Short | SWISSPROT | BIOTYPE | SIFT | PolyPhen | Tumor Sample Barcode | Tissue | Histology | Sex | Age | Stage | Therapy Types | Drugs | Outcome |
| PSMG4 | SNV | Missense_Mutation | novel | c.375G>T | p.Lys125Asn | p.K125N | Q5JS54 | protein_coding | deleterious(0) | benign(0.139) | TCGA-2W-A8YY-01 | Cervix | cervical & endocervical cancer | Female | <65 | I/II | Chemotherapy | cisplatin | CR |
| PSMG4 | SNV | Missense_Mutation | novel | c.482N>T | p.Lys161Met | p.K161M | Q5JS54 | protein_coding | tolerated(0.05) | probably_damaging(0.991) | TCGA-AA-A010-01 | Colorectum | colon adenocarcinoma | Female | <65 | I/II | Chemotherapy | folinic | CR |
| PSMG4 | SNV | Missense_Mutation | novel | c.115C>A | p.Leu39Met | p.L39M | Q5JS54 | protein_coding | deleterious(0.04) | probably_damaging(0.999) | TCGA-D5-6930-01 | Colorectum | colon adenocarcinoma | Male | >=65 | I/II | Unknown | Unknown | SD |
| PSMG4 | SNV | Missense_Mutation | c.430G>A | p.Ala144Thr | p.A144T | Q5JS54 | protein_coding | tolerated(0.77) | benign(0.011) | TCGA-AP-A1DV-01 | Endometrium | uterine corpus endometrioid carcinoma | Female | <65 | I/II | Unknown | Unknown | SD | |
| PSMG4 | SNV | Missense_Mutation | c.223A>G | p.Thr75Ala | p.T75A | Q5JS54 | protein_coding | tolerated(0.3) | benign(0.039) | TCGA-B5-A11E-01 | Endometrium | uterine corpus endometrioid carcinoma | Female | <65 | I/II | Unknown | Unknown | SD | |
| PSMG4 | SNV | Missense_Mutation | c.245N>A | p.Arg82His | p.R82H | Q5JS54 | protein_coding | deleterious(0.05) | probably_damaging(0.999) | TCGA-D1-A0ZO-01 | Endometrium | uterine corpus endometrioid carcinoma | Female | >=65 | I/II | Unknown | Unknown | SD | |
| PSMG4 | SNV | Missense_Mutation | c.245N>A | p.Arg82His | p.R82H | Q5JS54 | protein_coding | deleterious(0.05) | probably_damaging(0.999) | TCGA-D1-A167-01 | Endometrium | uterine corpus endometrioid carcinoma | Female | >=65 | I/II | Unknown | Unknown | SD | |
| PSMG4 | SNV | Missense_Mutation | novel | c.478N>A | p.Glu160Lys | p.E160K | Q5JS54 | protein_coding | deleterious(0.04) | possibly_damaging(0.587) | TCGA-E6-A1LX-01 | Endometrium | uterine corpus endometrioid carcinoma | Female | <65 | I/II | Unknown | Unknown | SD |
| Page: 1 |
Top |
Related drugs of malignant transformation related genes |
| Identification of chemicals and drugs interact with genes involved in malignant transfromation |
| (DGIdb 4.0) |
| Entrez ID | Symbol | Category | Interaction Types | Drug Claim Name | Drug Name | PMIDs |
| Page: 1 |

Copyright 2023-Present -The University of Texas Health Science Center at Houston |