
|
|||||
|
 | |
| |
| |
| |
| |
| |
|
Gene: PSMG3 |
Gene summary for PSMG3 |
| Gene information | Species | Human | Gene symbol | PSMG3 | Gene ID | 84262 |
| Gene name | proteasome assembly chaperone 3 | |
| Gene Alias | C7orf48 | |
| Cytomap | 7p22.3 | |
| Gene Type | protein-coding | GO ID | GO:0008150 | UniProtAcc | A0A024R806 |
Top |
Malignant transformation analysis |
| Identification of the aberrant gene expression in precancerous and cancerous lesions by comparing the gene expression of stem-like cells in diseased tissues with normal stem cells |
| Entrez ID | Symbol | Replicates | Species | Organ | Tissue | Adj P-value | Log2FC | Malignancy |
| 84262 | PSMG3 | Tumor | Human | Cervix | CC | 1.47e-26 | 6.24e-01 | 0.1241 |
| 84262 | PSMG3 | sample3 | Human | Cervix | CC | 1.27e-21 | 5.28e-01 | 0.1387 |
| 84262 | PSMG3 | T3 | Human | Cervix | CC | 2.19e-20 | 5.33e-01 | 0.1389 |
| 84262 | PSMG3 | LZE2T | Human | Esophagus | ESCC | 2.46e-03 | 7.92e-01 | 0.082 |
| 84262 | PSMG3 | LZE4T | Human | Esophagus | ESCC | 4.95e-11 | 3.35e-01 | 0.0811 |
| 84262 | PSMG3 | LZE5T | Human | Esophagus | ESCC | 2.57e-02 | 2.17e-01 | 0.0514 |
| 84262 | PSMG3 | LZE7T | Human | Esophagus | ESCC | 1.83e-07 | 4.28e-01 | 0.0667 |
| 84262 | PSMG3 | LZE8T | Human | Esophagus | ESCC | 6.41e-06 | 3.33e-01 | 0.067 |
| 84262 | PSMG3 | LZE20T | Human | Esophagus | ESCC | 2.06e-10 | 4.36e-01 | 0.0662 |
| 84262 | PSMG3 | LZE22D1 | Human | Esophagus | HGIN | 1.52e-08 | 2.80e-01 | 0.0595 |
| 84262 | PSMG3 | LZE22T | Human | Esophagus | ESCC | 3.77e-09 | 7.54e-01 | 0.068 |
| 84262 | PSMG3 | LZE24T | Human | Esophagus | ESCC | 1.31e-13 | 4.76e-01 | 0.0596 |
| 84262 | PSMG3 | LZE21T | Human | Esophagus | ESCC | 1.08e-02 | 3.45e-01 | 0.0655 |
| 84262 | PSMG3 | LZE6T | Human | Esophagus | ESCC | 2.63e-14 | 4.53e-01 | 0.0845 |
| 84262 | PSMG3 | P1T-E | Human | Esophagus | ESCC | 2.26e-20 | 8.58e-01 | 0.0875 |
| 84262 | PSMG3 | P2T-E | Human | Esophagus | ESCC | 5.16e-40 | 7.68e-01 | 0.1177 |
| 84262 | PSMG3 | P4T-E | Human | Esophagus | ESCC | 5.39e-44 | 1.07e+00 | 0.1323 |
| 84262 | PSMG3 | P5T-E | Human | Esophagus | ESCC | 1.18e-52 | 1.03e+00 | 0.1327 |
| 84262 | PSMG3 | P8T-E | Human | Esophagus | ESCC | 5.22e-20 | 4.57e-01 | 0.0889 |
| 84262 | PSMG3 | P9T-E | Human | Esophagus | ESCC | 9.61e-38 | 8.28e-01 | 0.1131 |
| Page: 1 2 3 4 5 6 7 |
| Tissue | Expression Dynamics | Abbreviation |
| Cervix |  | CC: Cervix cancer |
| HSIL_HPV: HPV-infected high-grade squamous intraepithelial lesions | ||
| N_HPV: HPV-infected normal cervix | ||
| Esophagus | 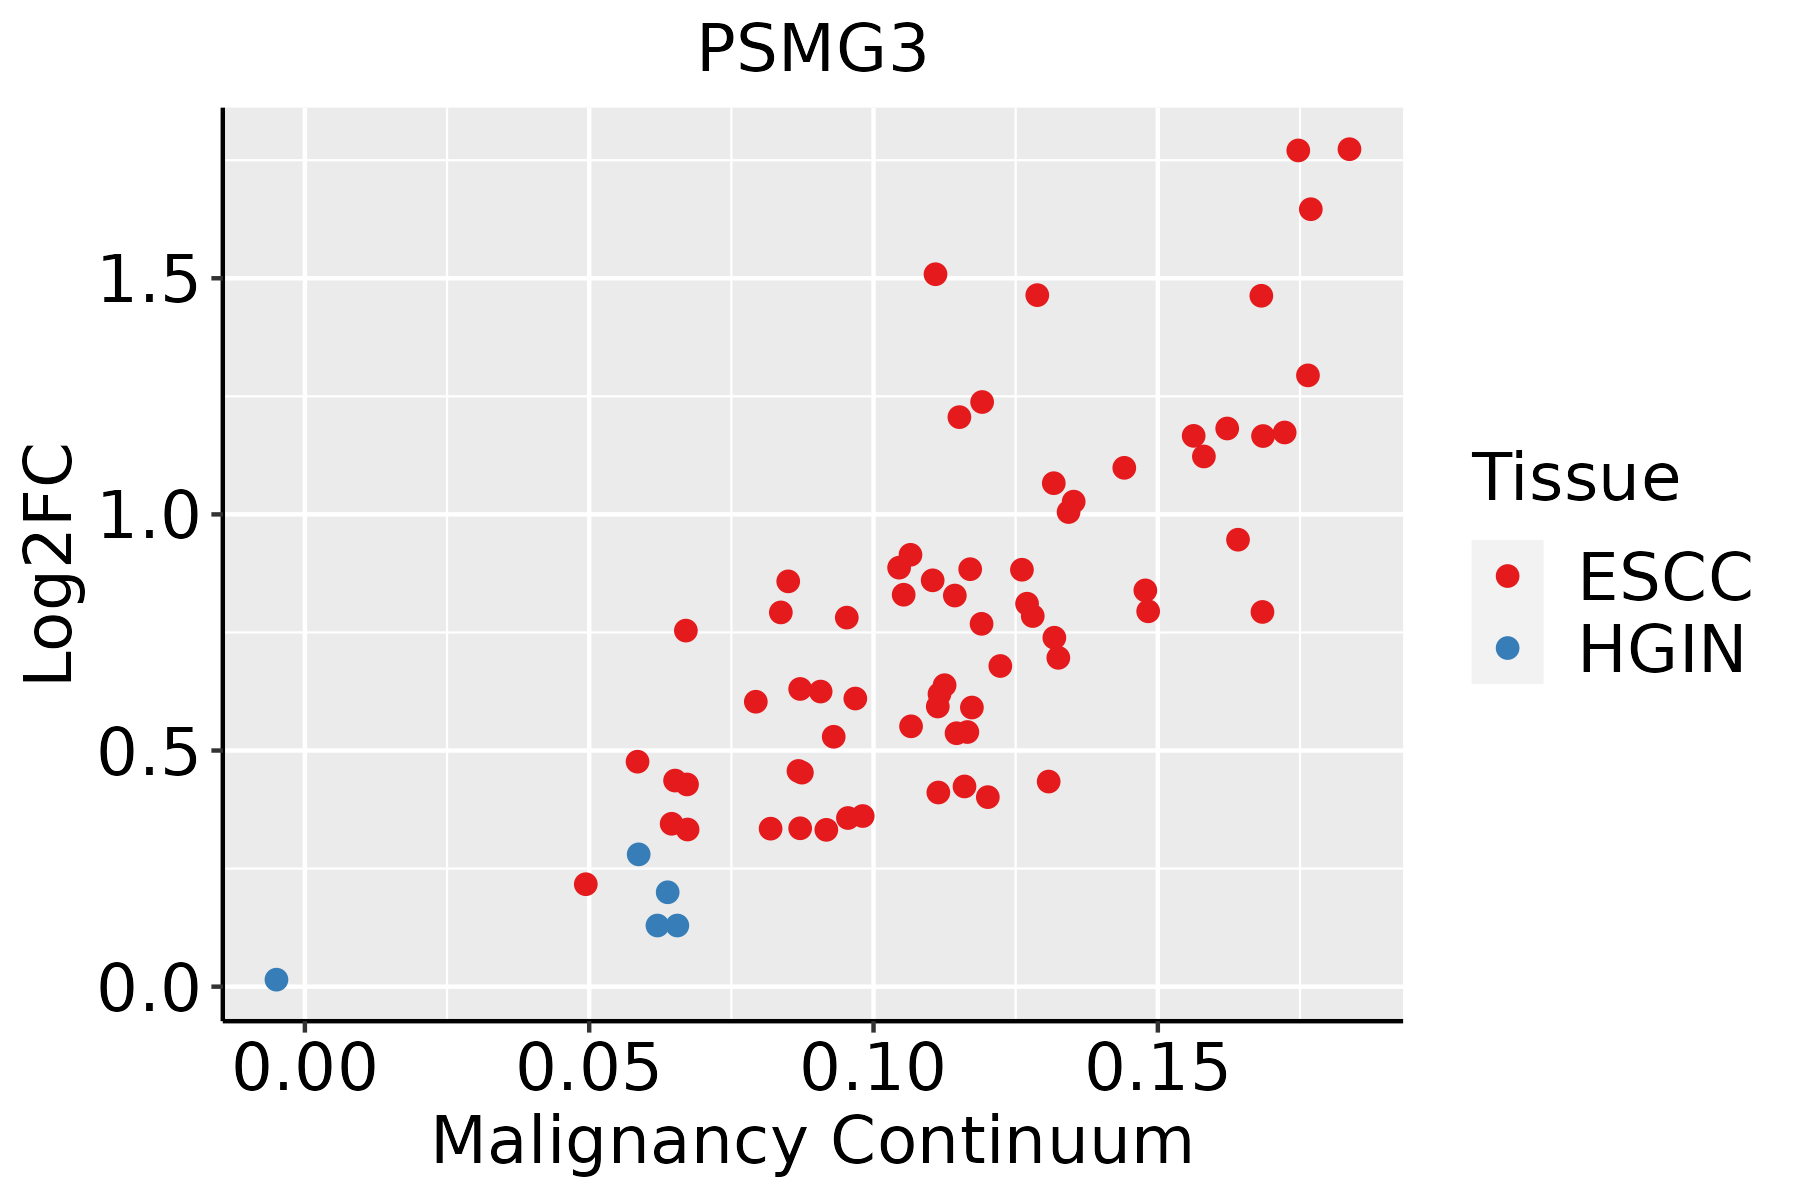 | ESCC: Esophageal squamous cell carcinoma |
| HGIN: High-grade intraepithelial neoplasias | ||
| LGIN: Low-grade intraepithelial neoplasias | ||
| Liver | 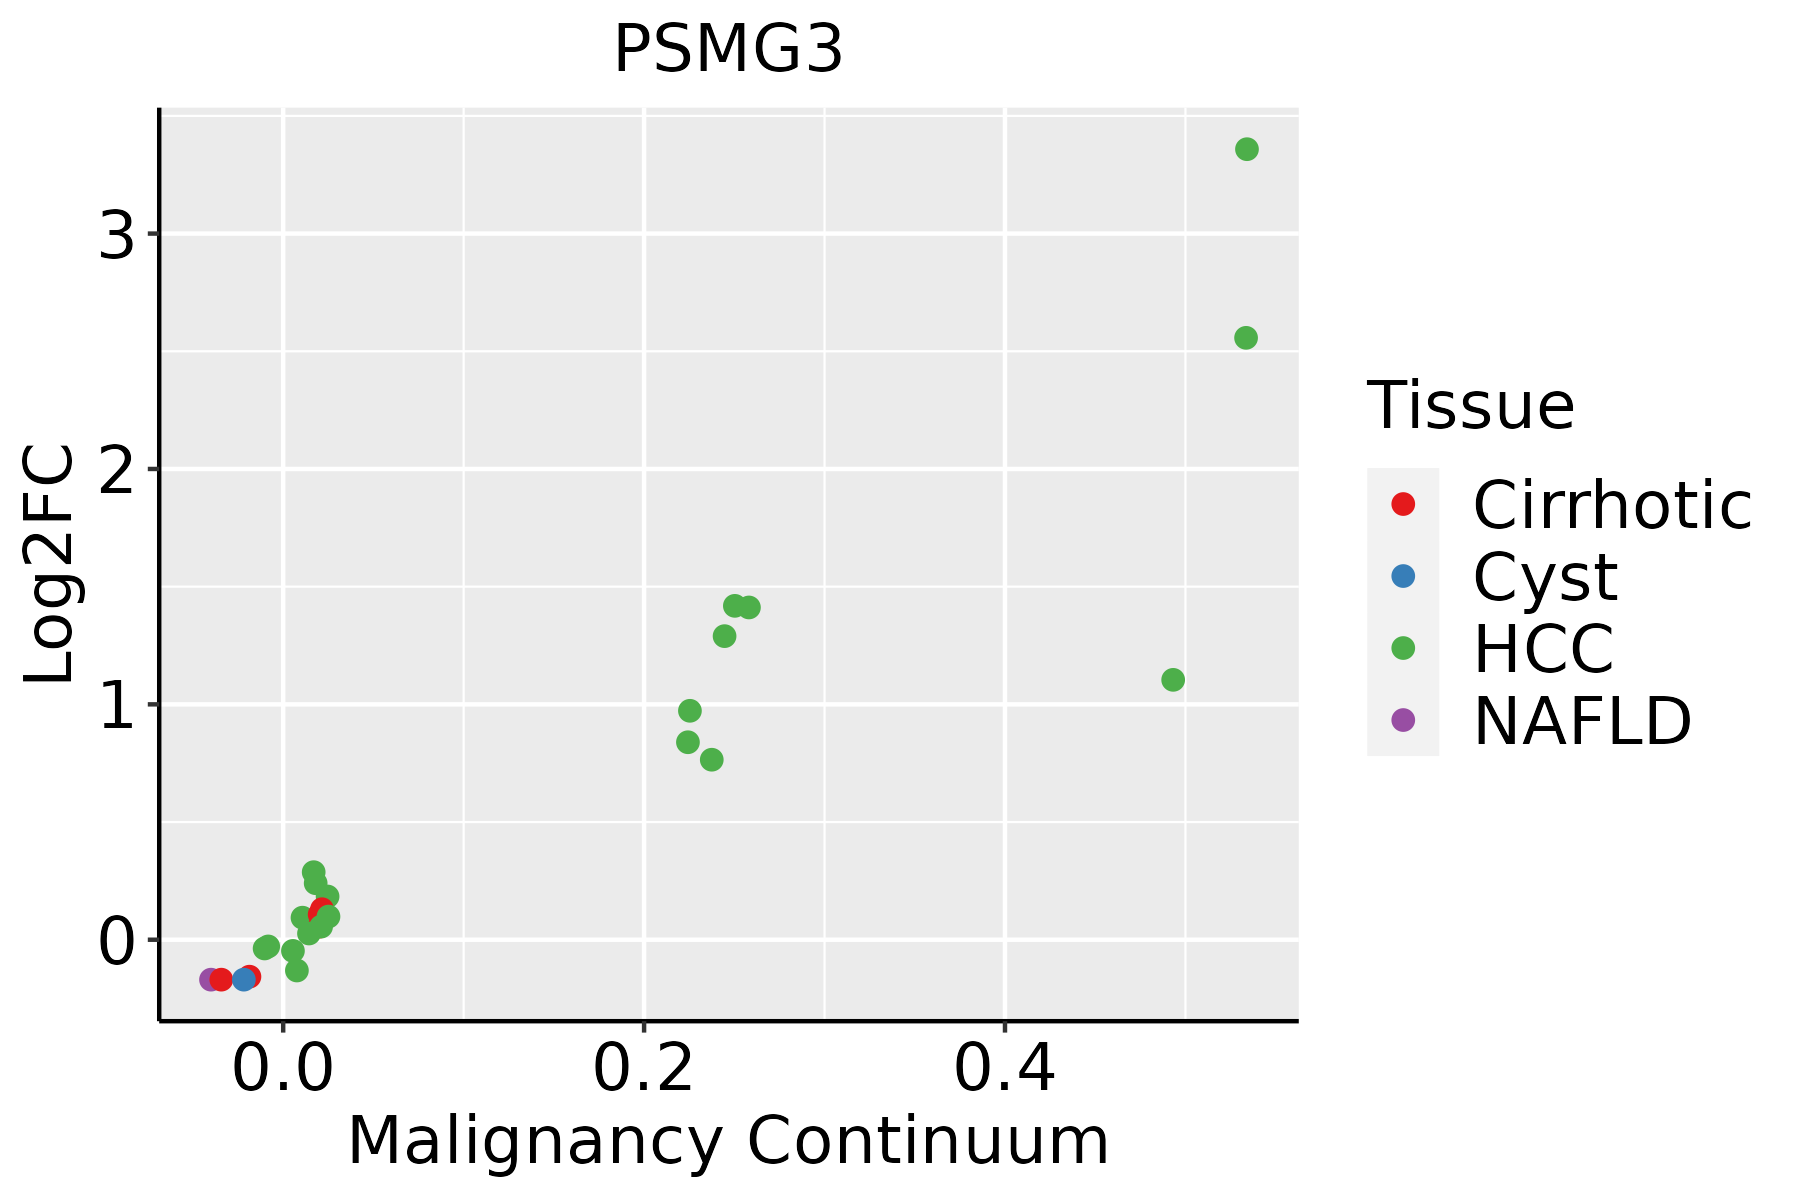 | HCC: Hepatocellular carcinoma |
| NAFLD: Non-alcoholic fatty liver disease | ||
| Oral Cavity | 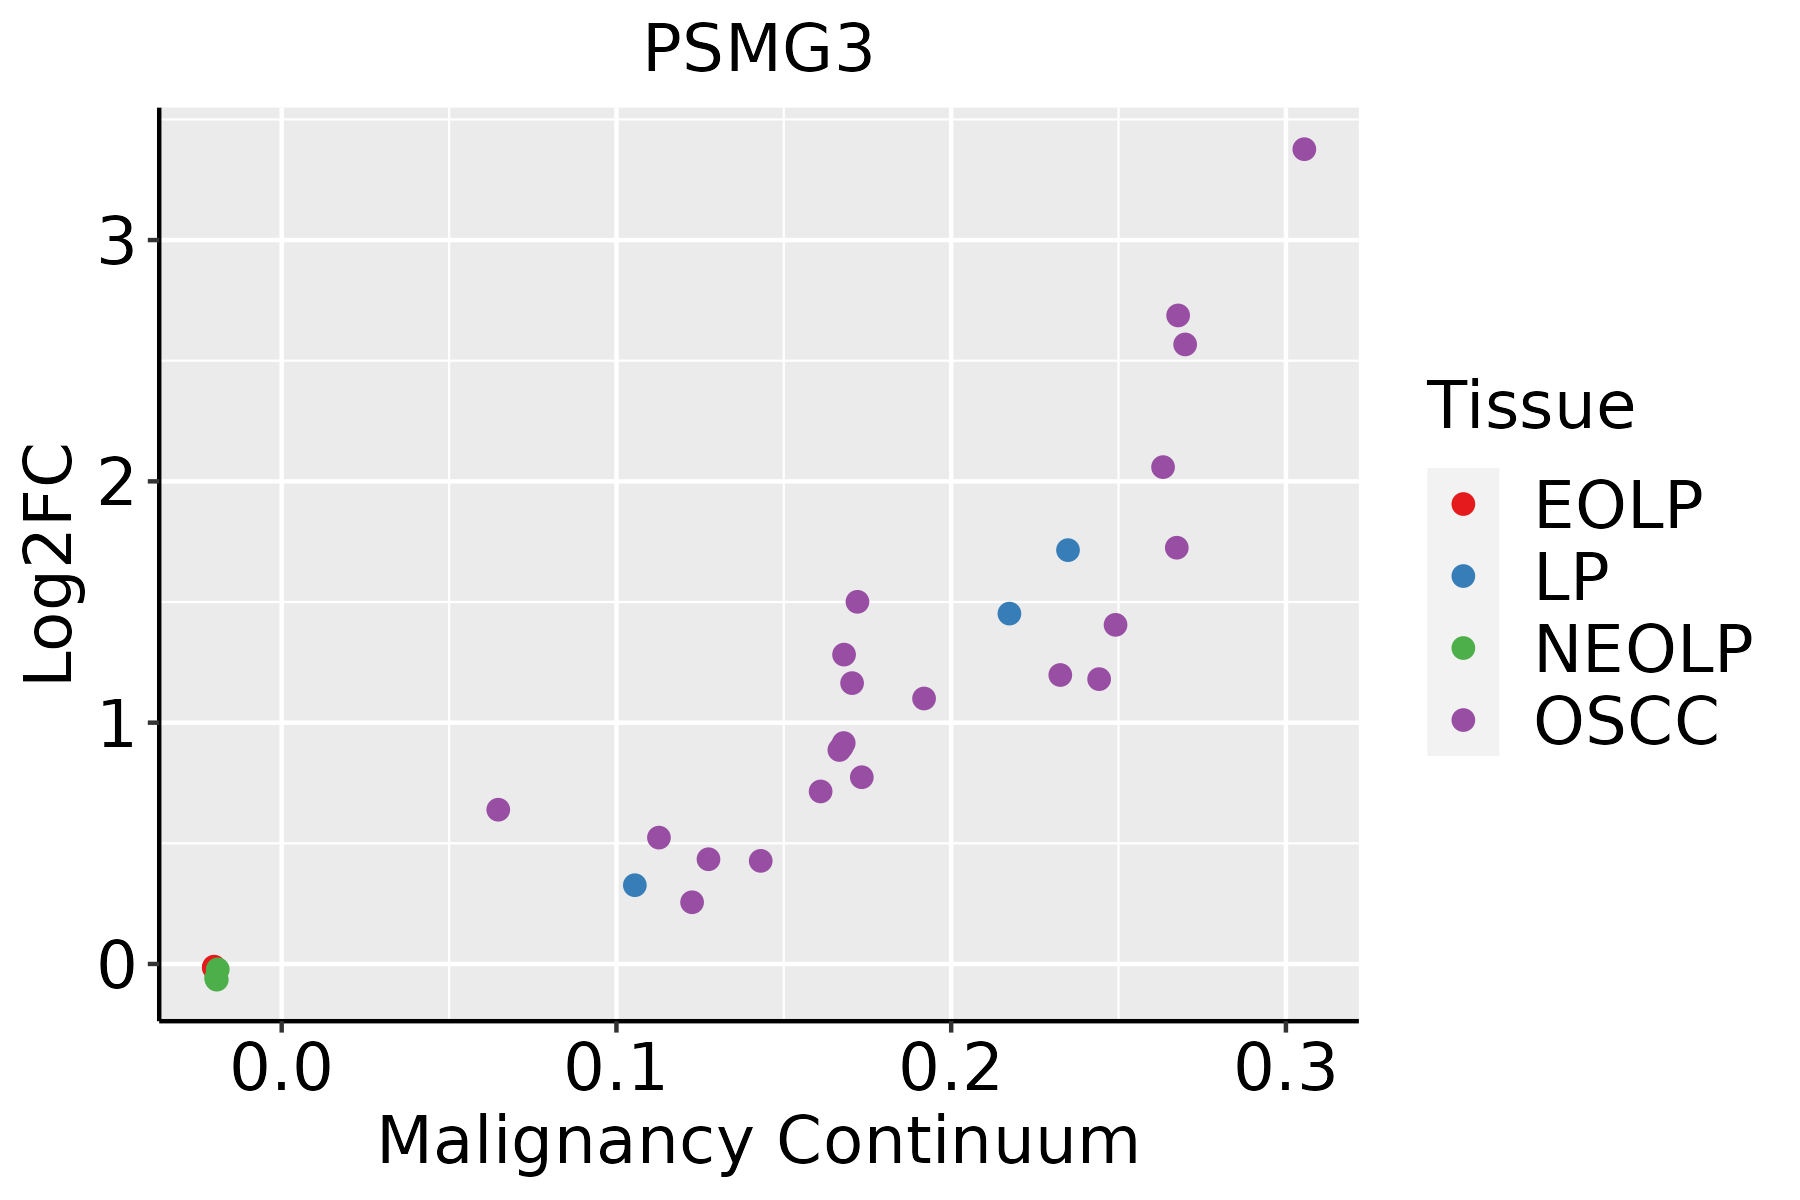 | EOLP: Erosive Oral lichen planus |
| LP: leukoplakia | ||
| NEOLP: Non-erosive oral lichen planus | ||
| OSCC: Oral squamous cell carcinoma | ||
| Skin | 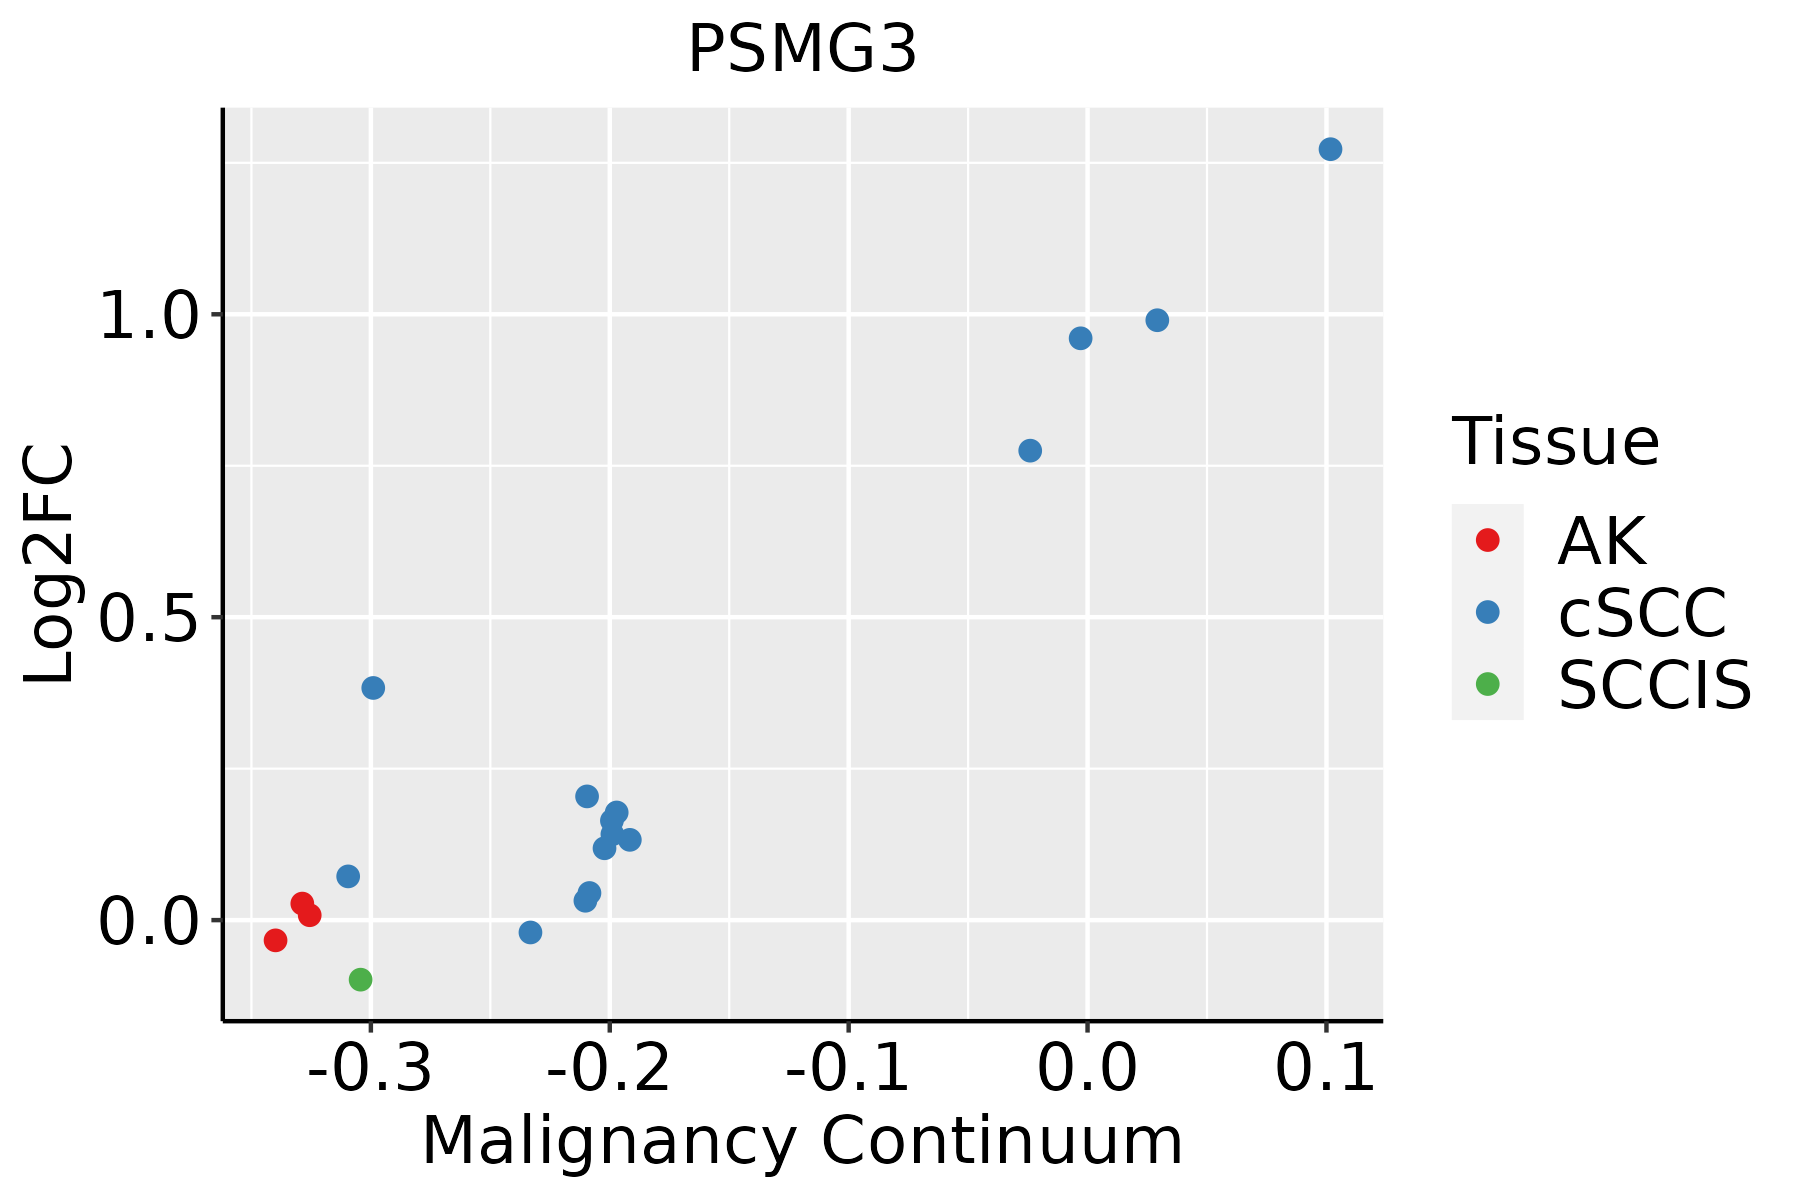 | AK: Actinic keratosis |
| cSCC: Cutaneous squamous cell carcinoma | ||
| SCCIS:squamous cell carcinoma in situ | ||
| Thyroid | 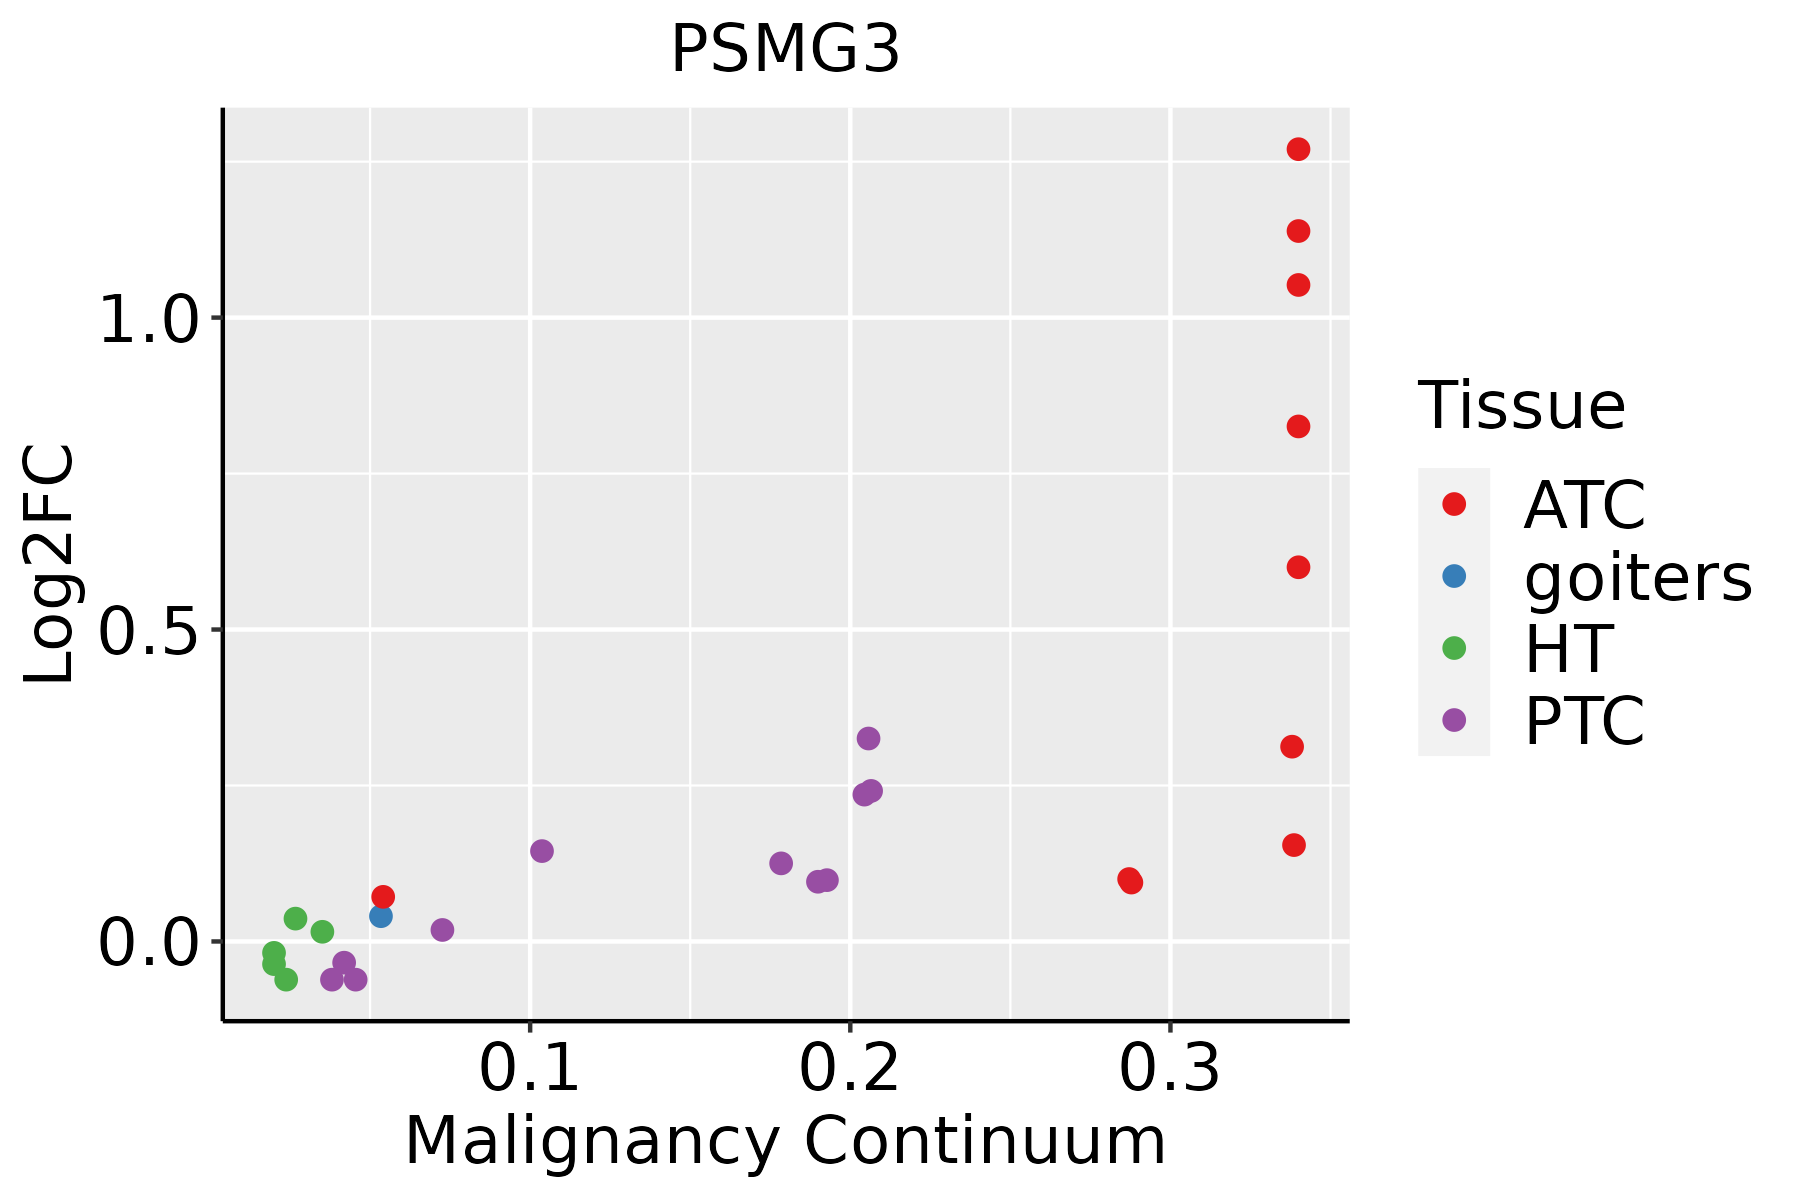 | ATC: Anaplastic thyroid cancer |
| HT: Hashimoto's thyroiditis | ||
| PTC: Papillary thyroid cancer |
| ∗log2FC in expression of this searched gene in stem-like cells from each diseased tissue sample relative to stem-like cells in normal samples in each tissue plotted against the malignancy continuum. Samples are colored based on if they are from different disease stage. |
Top |
Malignant transformation related pathway analysis |
| Find out the enriched GO biological processes and KEGG pathways involved in transition from healthy to precancer to cancer |
| Tissue | Disease Stage | Enriched GO biological Processes |
| Colorectum | AD |  |
| Colorectum | SER |  |
| Colorectum | MSS |  |
| Colorectum | MSI-H |  |
| Colorectum | FAP |  |
| ∗Top 15 enriched GO BP terms are showed in the bar plot of each disease state in each tissue. Each row represents a significant GO biological process which is colored according to the -log10(p.adjust). |
| Page: 1 2 3 4 5 6 7 8 9 |
| GO ID | Tissue | Disease Stage | Description | Gene Ratio | Bg Ratio | pvalue | p.adjust | Count |
| GO:005113118 | Esophagus | HGIN | chaperone-mediated protein complex assembly | 10/2587 | 23/18723 | 5.09e-04 | 7.38e-03 | 10 |
| GO:00432483 | Esophagus | HGIN | proteasome assembly | 6/2587 | 12/18723 | 3.03e-03 | 2.88e-02 | 6 |
| GO:004324811 | Esophagus | ESCC | proteasome assembly | 11/8552 | 12/18723 | 1.26e-03 | 6.06e-03 | 11 |
| GO:005113119 | Esophagus | ESCC | chaperone-mediated protein complex assembly | 17/8552 | 23/18723 | 5.73e-03 | 2.13e-02 | 17 |
| GO:00511316 | Liver | Cirrhotic | chaperone-mediated protein complex assembly | 16/4634 | 23/18723 | 7.54e-06 | 1.15e-04 | 16 |
| GO:0043248 | Liver | Cirrhotic | proteasome assembly | 9/4634 | 12/18723 | 3.59e-04 | 3.03e-03 | 9 |
| GO:00432481 | Liver | HCC | proteasome assembly | 12/7958 | 12/18723 | 3.46e-05 | 3.45e-04 | 12 |
| GO:005113111 | Liver | HCC | chaperone-mediated protein complex assembly | 17/7958 | 23/18723 | 2.28e-03 | 1.13e-02 | 17 |
| GO:00432482 | Oral cavity | OSCC | proteasome assembly | 11/7305 | 12/18723 | 2.45e-04 | 1.57e-03 | 11 |
| GO:005113116 | Oral cavity | OSCC | chaperone-mediated protein complex assembly | 17/7305 | 23/18723 | 7.28e-04 | 3.98e-03 | 17 |
| GO:005113117 | Oral cavity | LP | chaperone-mediated protein complex assembly | 17/4623 | 23/18723 | 9.55e-07 | 2.43e-05 | 17 |
| GO:0051131110 | Skin | cSCC | chaperone-mediated protein complex assembly | 16/4864 | 23/18723 | 1.47e-05 | 1.82e-04 | 16 |
| GO:00432484 | Skin | cSCC | proteasome assembly | 10/4864 | 12/18723 | 5.36e-05 | 5.38e-04 | 10 |
| GO:0051131111 | Thyroid | PTC | chaperone-mediated protein complex assembly | 14/5968 | 23/18723 | 3.91e-03 | 1.87e-02 | 14 |
| GO:005113132 | Thyroid | ATC | chaperone-mediated protein complex assembly | 14/6293 | 23/18723 | 6.70e-03 | 2.67e-02 | 14 |
| Page: 1 |
| Pathway ID | Tissue | Disease Stage | Description | Gene Ratio | Bg Ratio | pvalue | p.adjust | qvalue | Count |
| Page: 1 |
Top |
Cell-cell communication analysis |
| Identification of potential cell-cell interactions between two cell types and their ligand-receptor pairs for different disease states |
| Ligand | Receptor | LRpair | Pathway | Tissue | Disease Stage |
| Page: 1 |
Top |
Single-cell gene regulatory network inference analysis |
| Find out the significant the regulons (TFs) and the target genes of each regulon across cell types for different disease states |
| TF | Cell Type | Tissue | Disease Stage | Target Gene | RSS | Regulon Activity |
| ∗The dot plots of a searched regulon are shown for all cell subpopulations in each disease state of each tissue based on the regulon specific score inferred using pySCENIC and by calculating the average expression. |
| Page: 1 |
Top |
Somatic mutation of malignant transformation related genes |
| Annotation of somatic variants for genes involved in malignant transformation |
| Hugo Symbol | Variant Class | Variant Classification | dbSNP RS | HGVSc | HGVSp | HGVSp Short | SWISSPROT | BIOTYPE | SIFT | PolyPhen | Tumor Sample Barcode | Tissue | Histology | Sex | Age | Stage | Therapy Types | Drugs | Outcome |
| PSMG3 | SNV | Missense_Mutation | c.243C>G | p.Asn81Lys | p.N81K | Q9BT73 | protein_coding | tolerated(0.07) | probably_damaging(0.913) | TCGA-D8-A27I-01 | Breast | breast invasive carcinoma | Female | <65 | III/IV | Chemotherapy | adrimycin+cyclophosphamide | SD | |
| PSMG3 | SNV | Missense_Mutation | c.104N>C | p.Val35Ala | p.V35A | Q9BT73 | protein_coding | deleterious(0) | probably_damaging(0.986) | TCGA-AZ-4615-01 | Colorectum | colon adenocarcinoma | Male | >=65 | III/IV | Chemotherapy | xeloda | PD | |
| PSMG3 | SNV | Missense_Mutation | rs61740072 | c.38C>T | p.Thr13Met | p.T13M | Q9BT73 | protein_coding | tolerated(0.1) | possibly_damaging(0.544) | TCGA-WS-AB45-01 | Colorectum | colon adenocarcinoma | Female | <65 | I/II | Unknown | Unknown | SD |
| PSMG3 | SNV | Missense_Mutation | novel | c.263N>T | p.Gln88Leu | p.Q88L | Q9BT73 | protein_coding | deleterious(0.04) | benign(0.437) | TCGA-AG-A02G-01 | Colorectum | rectum adenocarcinoma | Male | >=65 | III/IV | Chemotherapy | folinic | PD |
| PSMG3 | SNV | Missense_Mutation | novel | c.161N>T | p.Ala54Val | p.A54V | Q9BT73 | protein_coding | deleterious(0.03) | benign(0.053) | TCGA-AJ-A3BG-01 | Endometrium | uterine corpus endometrioid carcinoma | Female | >=65 | I/II | Chemotherapy | carboplatin | PD |
| PSMG3 | SNV | Missense_Mutation | novel | c.254N>G | p.Phe85Cys | p.F85C | Q9BT73 | protein_coding | deleterious(0.04) | probably_damaging(0.988) | TCGA-AJ-A5DW-01 | Endometrium | uterine corpus endometrioid carcinoma | Female | <65 | I/II | Unknown | Unknown | SD |
| PSMG3 | SNV | Missense_Mutation | c.361N>T | p.Val121Leu | p.V121L | Q9BT73 | protein_coding | tolerated(0.05) | benign(0.255) | TCGA-AP-A059-01 | Endometrium | uterine corpus endometrioid carcinoma | Female | >=65 | I/II | Unknown | Unknown | SD | |
| PSMG3 | SNV | Missense_Mutation | c.240G>T | p.Lys80Asn | p.K80N | Q9BT73 | protein_coding | deleterious(0.01) | probably_damaging(0.968) | TCGA-AX-A05Z-01 | Endometrium | uterine corpus endometrioid carcinoma | Female | <65 | III/IV | Chemotherapy | adriamycin | SD | |
| PSMG3 | SNV | Missense_Mutation | novel | c.254N>C | p.Phe85Ser | p.F85S | Q9BT73 | protein_coding | tolerated(0.16) | possibly_damaging(0.521) | TCGA-EO-A22R-01 | Endometrium | uterine corpus endometrioid carcinoma | Female | <65 | I/II | Unknown | Unknown | SD |
| PSMG3 | SNV | Missense_Mutation | novel | c.36G>T | p.Lys12Asn | p.K12N | Q9BT73 | protein_coding | tolerated(0.22) | benign(0.094) | TCGA-FI-A2D5-01 | Endometrium | uterine corpus endometrioid carcinoma | Female | <65 | III/IV | Chemotherapy | carboplatinum | PD |
| Page: 1 2 |
Top |
Related drugs of malignant transformation related genes |
| Identification of chemicals and drugs interact with genes involved in malignant transfromation |
| (DGIdb 4.0) |
| Entrez ID | Symbol | Category | Interaction Types | Drug Claim Name | Drug Name | PMIDs |
| Page: 1 |

Copyright 2023-Present -The University of Texas Health Science Center at Houston |