
|
|||||
|
 | |
| |
| |
| |
| |
| |
|
Gene: PSMG2 |
Gene summary for PSMG2 |
| Gene information | Species | Human | Gene symbol | PSMG2 | Gene ID | 56984 |
| Gene name | proteasome assembly chaperone 2 | |
| Gene Alias | CLAST3 | |
| Cytomap | 18p11.21 | |
| Gene Type | protein-coding | GO ID | GO:0000070 | UniProtAcc | Q969U7 |
Top |
Malignant transformation analysis |
| Identification of the aberrant gene expression in precancerous and cancerous lesions by comparing the gene expression of stem-like cells in diseased tissues with normal stem cells |
| Entrez ID | Symbol | Replicates | Species | Organ | Tissue | Adj P-value | Log2FC | Malignancy |
| 56984 | PSMG2 | LZE4T | Human | Esophagus | ESCC | 2.49e-13 | 5.65e-01 | 0.0811 |
| 56984 | PSMG2 | LZE5T | Human | Esophagus | ESCC | 8.77e-04 | 4.90e-01 | 0.0514 |
| 56984 | PSMG2 | LZE7T | Human | Esophagus | ESCC | 1.59e-07 | 8.25e-01 | 0.0667 |
| 56984 | PSMG2 | LZE8T | Human | Esophagus | ESCC | 1.33e-10 | 5.85e-01 | 0.067 |
| 56984 | PSMG2 | LZE20T | Human | Esophagus | ESCC | 1.66e-09 | 2.91e-01 | 0.0662 |
| 56984 | PSMG2 | LZE24T | Human | Esophagus | ESCC | 1.48e-20 | 9.05e-01 | 0.0596 |
| 56984 | PSMG2 | LZE21T | Human | Esophagus | ESCC | 2.57e-04 | 5.49e-01 | 0.0655 |
| 56984 | PSMG2 | P1T-E | Human | Esophagus | ESCC | 6.12e-05 | 6.60e-01 | 0.0875 |
| 56984 | PSMG2 | P2T-E | Human | Esophagus | ESCC | 1.09e-39 | 9.53e-01 | 0.1177 |
| 56984 | PSMG2 | P4T-E | Human | Esophagus | ESCC | 5.65e-48 | 1.38e+00 | 0.1323 |
| 56984 | PSMG2 | P5T-E | Human | Esophagus | ESCC | 1.46e-61 | 1.44e+00 | 0.1327 |
| 56984 | PSMG2 | P8T-E | Human | Esophagus | ESCC | 5.32e-45 | 9.27e-01 | 0.0889 |
| 56984 | PSMG2 | P9T-E | Human | Esophagus | ESCC | 9.21e-31 | 1.07e+00 | 0.1131 |
| 56984 | PSMG2 | P10T-E | Human | Esophagus | ESCC | 7.82e-35 | 6.82e-01 | 0.116 |
| 56984 | PSMG2 | P11T-E | Human | Esophagus | ESCC | 1.02e-22 | 9.89e-01 | 0.1426 |
| 56984 | PSMG2 | P12T-E | Human | Esophagus | ESCC | 2.96e-57 | 1.06e+00 | 0.1122 |
| 56984 | PSMG2 | P15T-E | Human | Esophagus | ESCC | 3.33e-52 | 1.27e+00 | 0.1149 |
| 56984 | PSMG2 | P16T-E | Human | Esophagus | ESCC | 3.97e-31 | 8.77e-01 | 0.1153 |
| 56984 | PSMG2 | P17T-E | Human | Esophagus | ESCC | 1.44e-09 | 8.01e-01 | 0.1278 |
| 56984 | PSMG2 | P19T-E | Human | Esophagus | ESCC | 8.92e-05 | 6.52e-01 | 0.1662 |
| Page: 1 2 3 4 5 6 7 |
| Tissue | Expression Dynamics | Abbreviation |
| Esophagus | 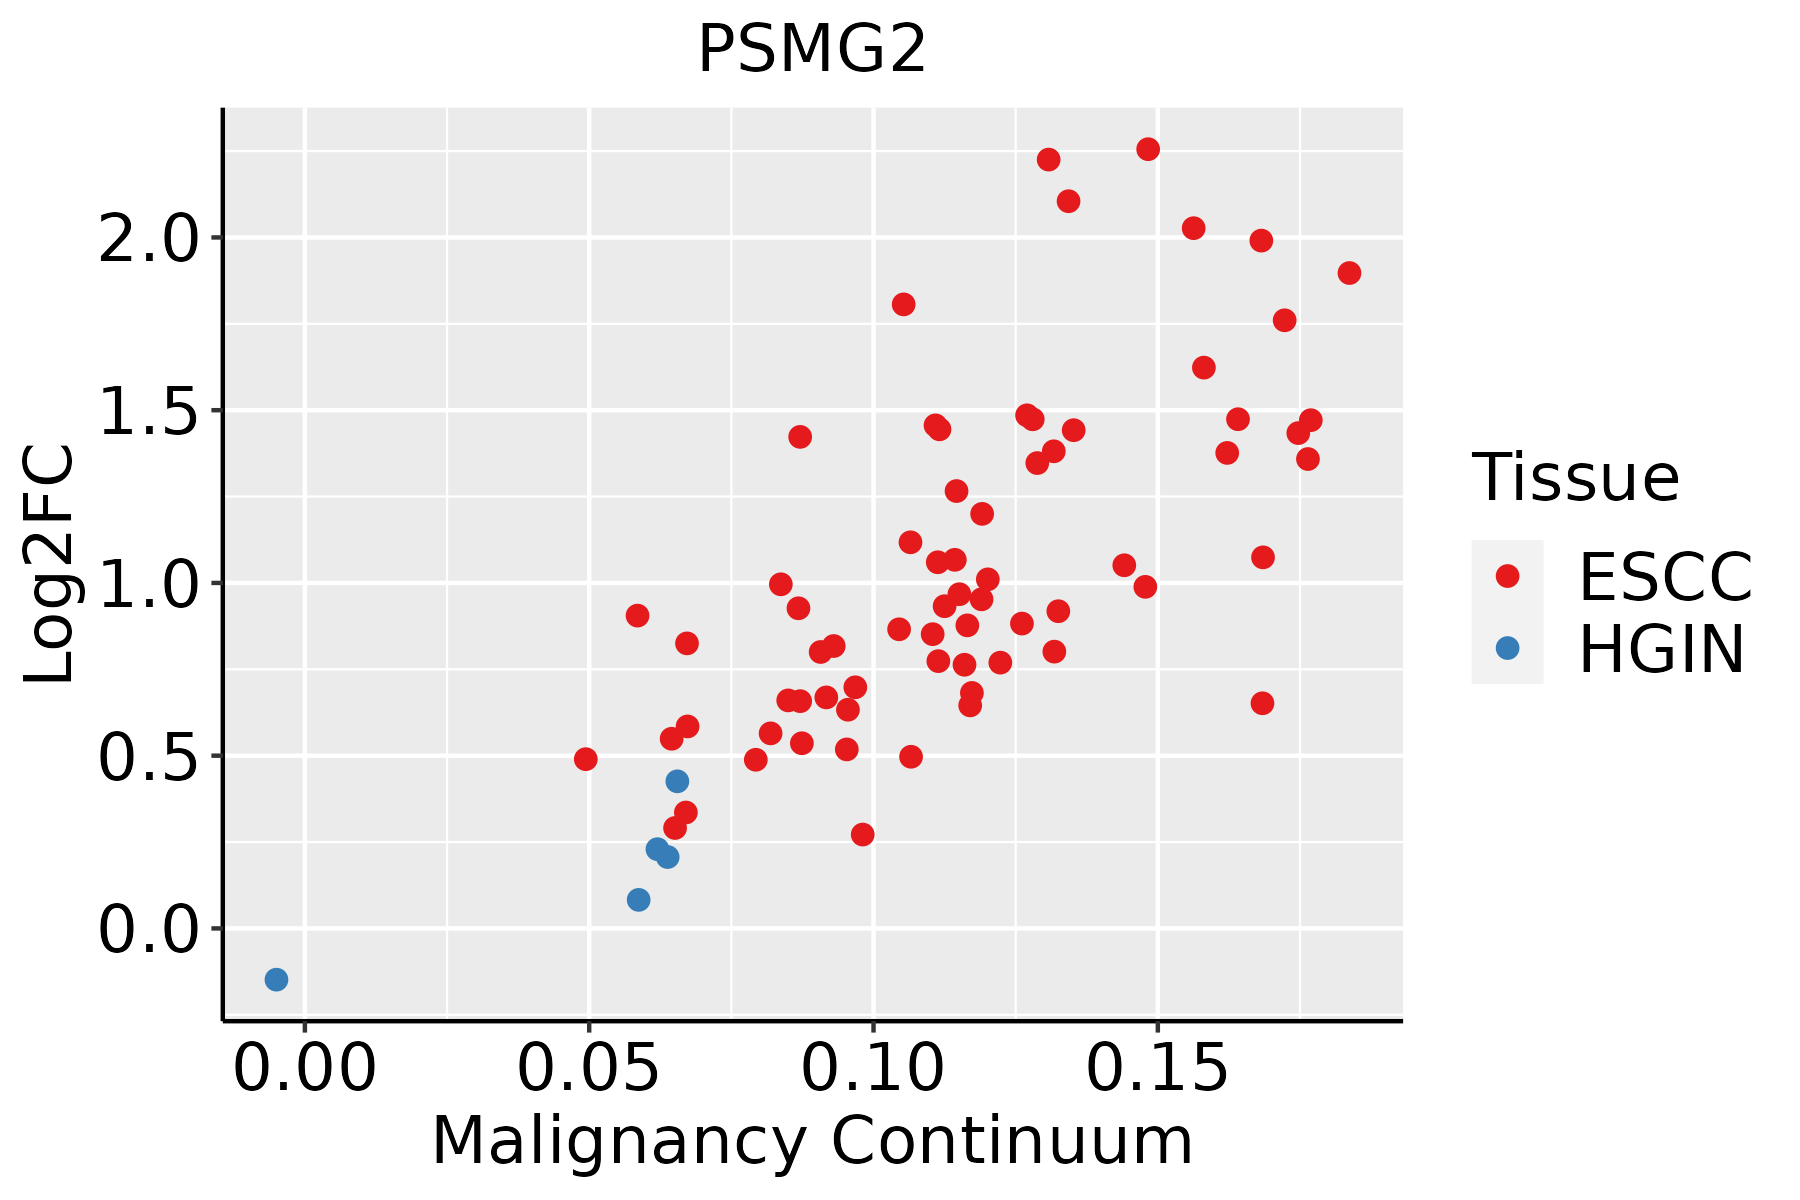 | ESCC: Esophageal squamous cell carcinoma |
| HGIN: High-grade intraepithelial neoplasias | ||
| LGIN: Low-grade intraepithelial neoplasias | ||
| Liver |  | HCC: Hepatocellular carcinoma |
| NAFLD: Non-alcoholic fatty liver disease | ||
| Oral Cavity | 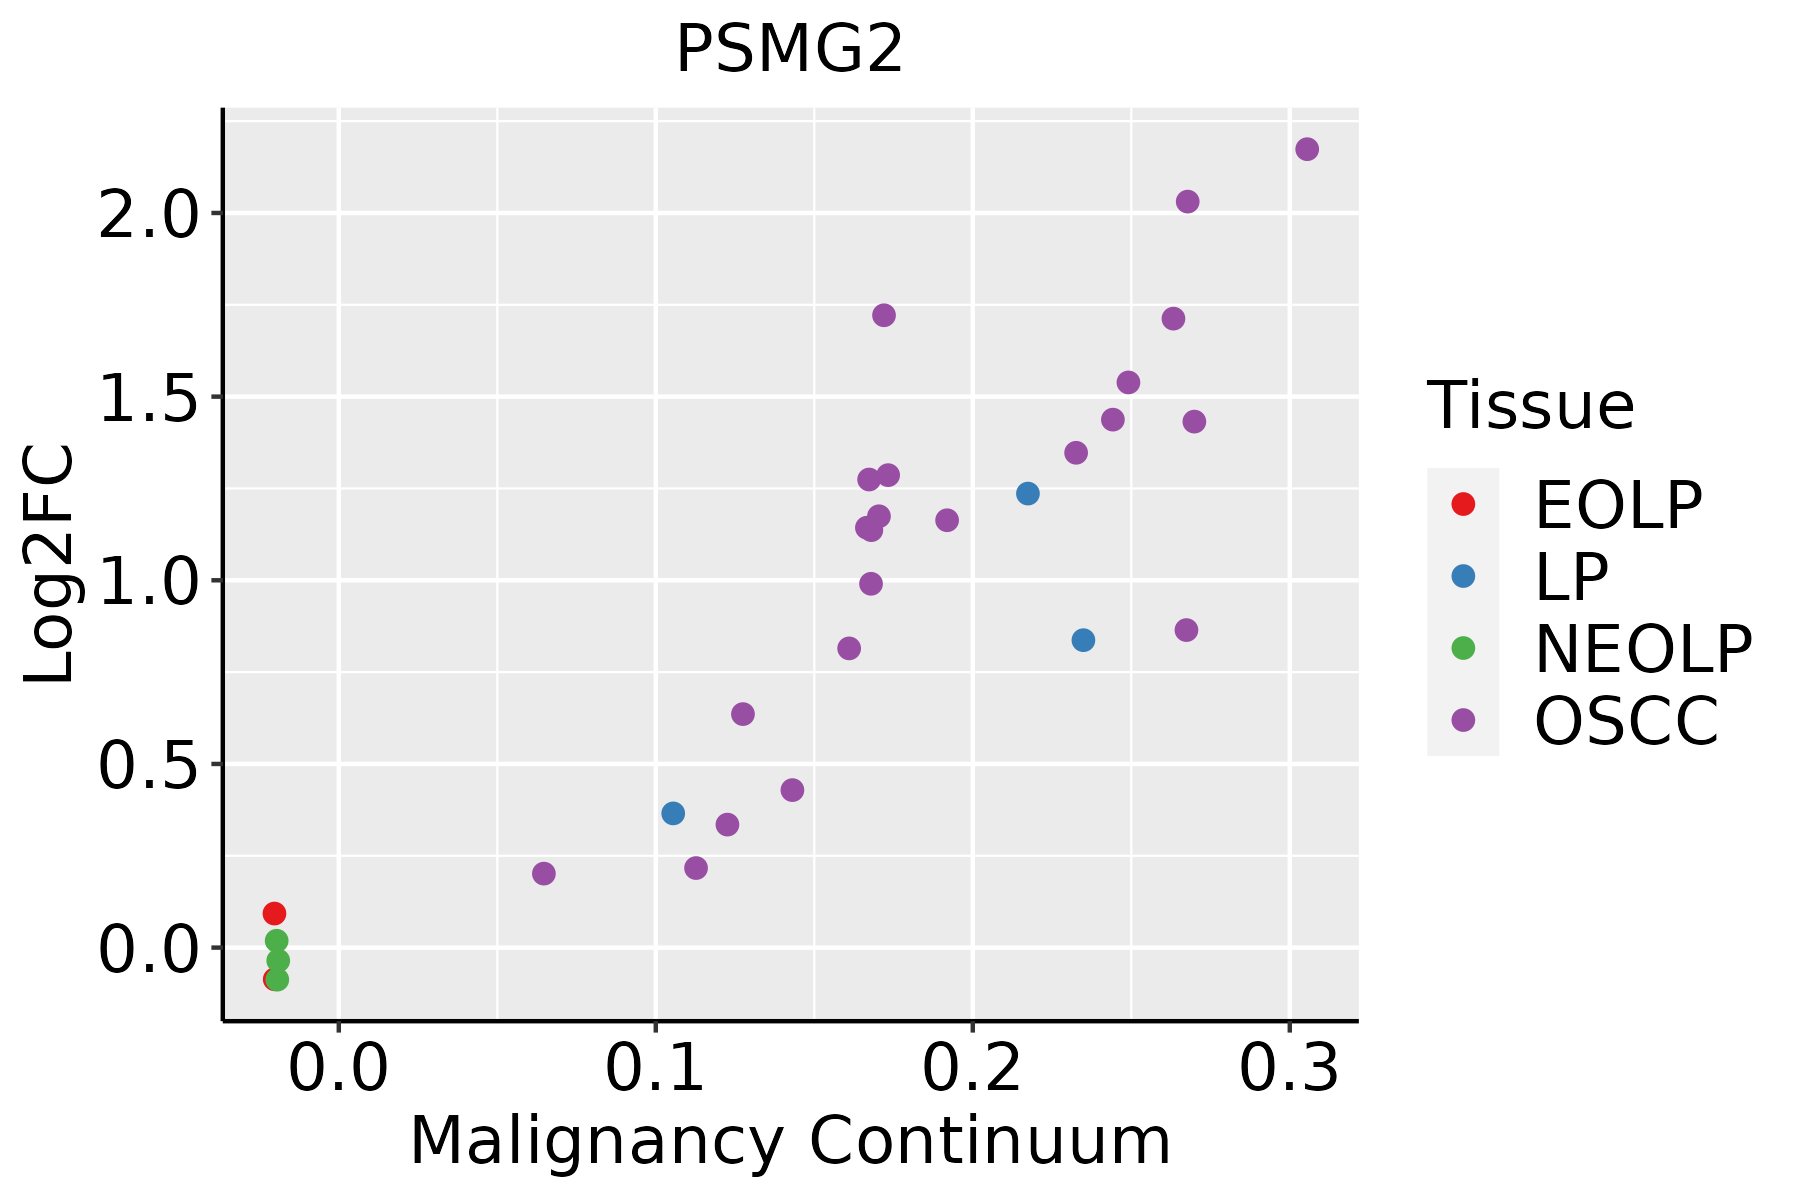 | EOLP: Erosive Oral lichen planus |
| LP: leukoplakia | ||
| NEOLP: Non-erosive oral lichen planus | ||
| OSCC: Oral squamous cell carcinoma | ||
| Skin | 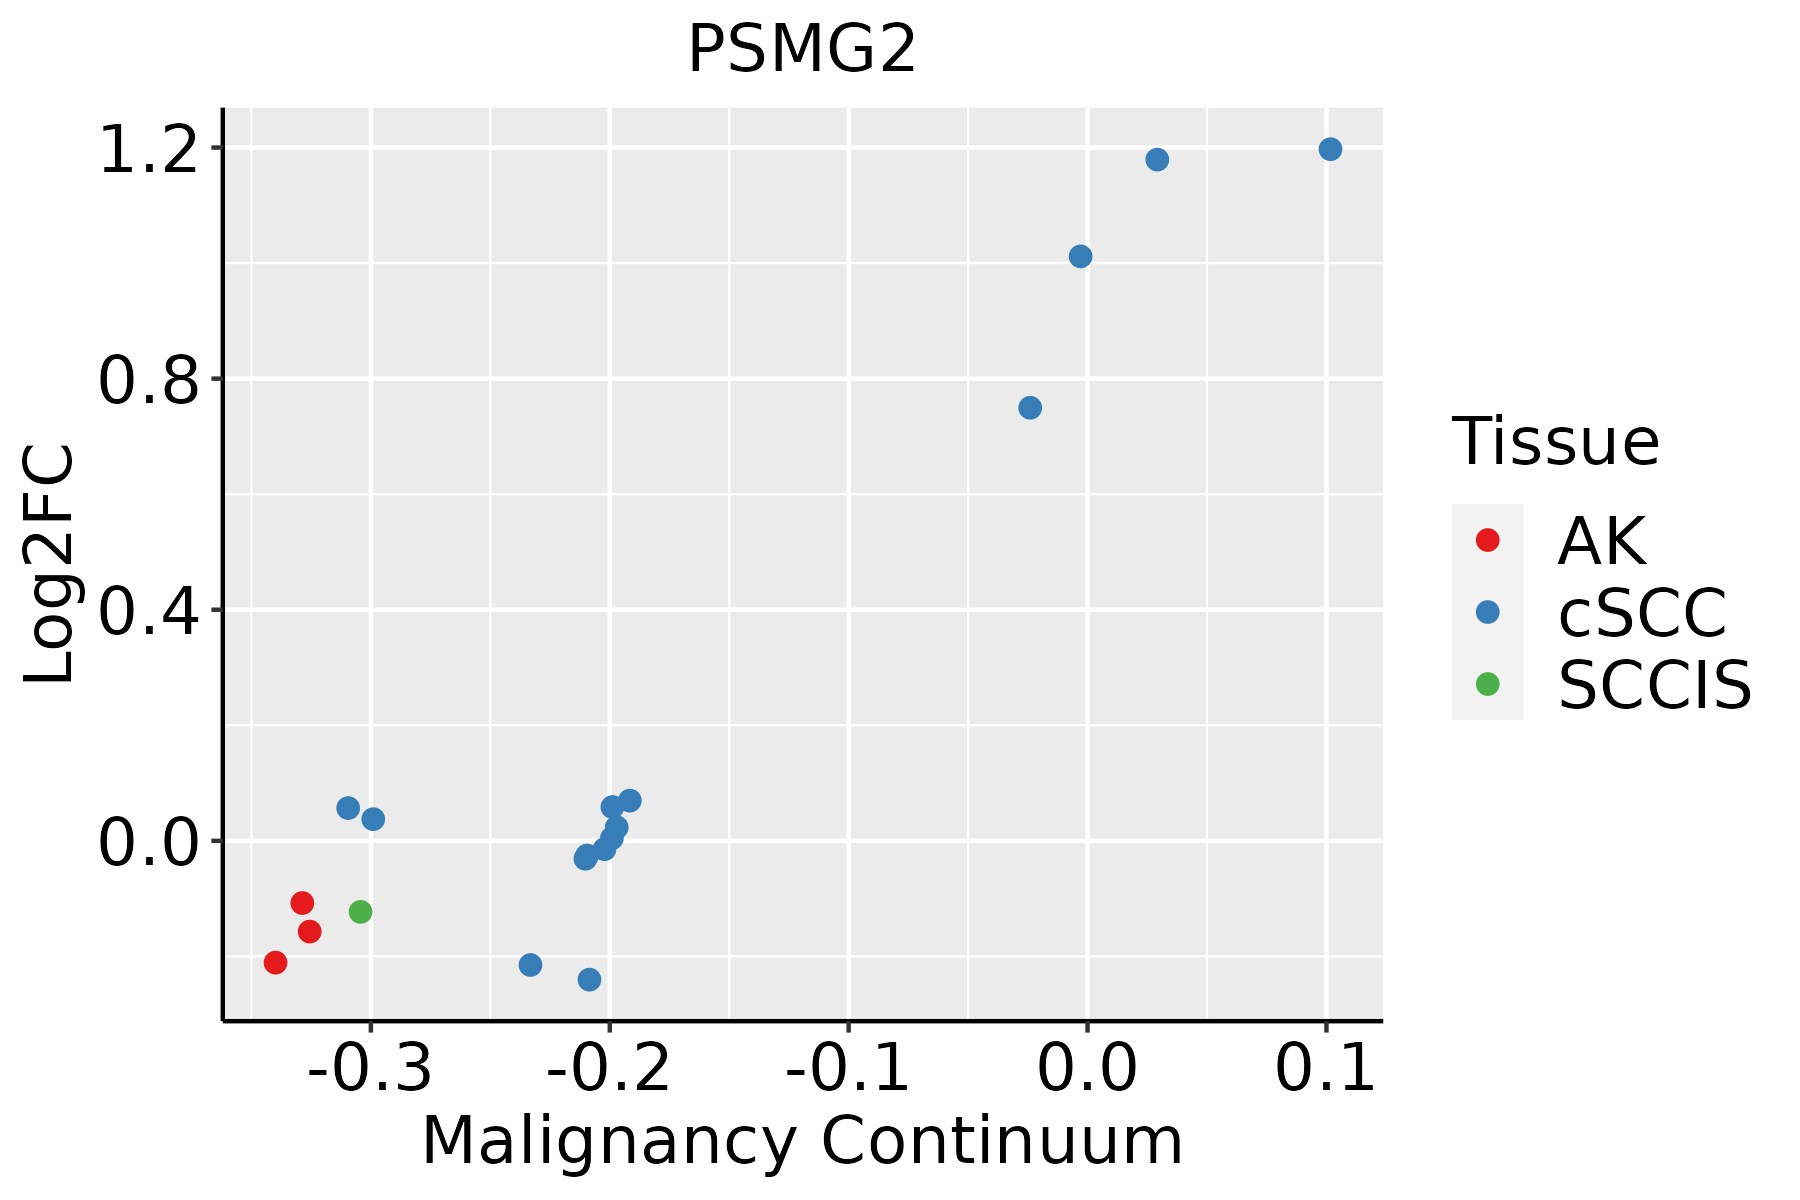 | AK: Actinic keratosis |
| cSCC: Cutaneous squamous cell carcinoma | ||
| SCCIS:squamous cell carcinoma in situ | ||
| Thyroid |  | ATC: Anaplastic thyroid cancer |
| HT: Hashimoto's thyroiditis | ||
| PTC: Papillary thyroid cancer |
| ∗log2FC in expression of this searched gene in stem-like cells from each diseased tissue sample relative to stem-like cells in normal samples in each tissue plotted against the malignancy continuum. Samples are colored based on if they are from different disease stage. |
Top |
Malignant transformation related pathway analysis |
| Find out the enriched GO biological processes and KEGG pathways involved in transition from healthy to precancer to cancer |
| Tissue | Disease Stage | Enriched GO biological Processes |
| Colorectum | AD |  |
| Colorectum | SER |  |
| Colorectum | MSS |  |
| Colorectum | MSI-H |  |
| Colorectum | FAP |  |
| ∗Top 15 enriched GO BP terms are showed in the bar plot of each disease state in each tissue. Each row represents a significant GO biological process which is colored according to the -log10(p.adjust). |
| Page: 1 2 3 4 5 6 7 8 9 |
| GO ID | Tissue | Disease Stage | Description | Gene Ratio | Bg Ratio | pvalue | p.adjust | Count |
| GO:014001414 | Esophagus | ESCC | mitotic nuclear division | 218/8552 | 287/18723 | 6.17e-26 | 1.78e-23 | 218 |
| GO:000007011 | Esophagus | ESCC | mitotic sister chromatid segregation | 138/8552 | 168/18723 | 1.37e-22 | 2.63e-20 | 138 |
| GO:00008194 | Esophagus | ESCC | sister chromatid segregation | 157/8552 | 202/18723 | 8.41e-21 | 1.33e-18 | 157 |
| GO:003304416 | Esophagus | ESCC | regulation of chromosome organization | 145/8552 | 187/18723 | 3.80e-19 | 4.31e-17 | 145 |
| GO:000705911 | Esophagus | ESCC | chromosome segregation | 238/8552 | 346/18723 | 1.72e-18 | 1.82e-16 | 238 |
| GO:004477216 | Esophagus | ESCC | mitotic cell cycle phase transition | 281/8552 | 424/18723 | 4.63e-18 | 4.45e-16 | 281 |
| GO:000734615 | Esophagus | ESCC | regulation of mitotic cell cycle | 293/8552 | 457/18723 | 8.00e-16 | 5.64e-14 | 293 |
| GO:00482853 | Esophagus | ESCC | organelle fission | 301/8552 | 488/18723 | 4.64e-13 | 2.12e-11 | 301 |
| GO:00988133 | Esophagus | ESCC | nuclear chromosome segregation | 187/8552 | 281/18723 | 1.00e-12 | 4.36e-11 | 187 |
| GO:00002802 | Esophagus | ESCC | nuclear division | 270/8552 | 439/18723 | 1.17e-11 | 4.24e-10 | 270 |
| GO:190198713 | Esophagus | ESCC | regulation of cell cycle phase transition | 242/8552 | 390/18723 | 3.86e-11 | 1.26e-09 | 242 |
| GO:190199013 | Esophagus | ESCC | regulation of mitotic cell cycle phase transition | 191/8552 | 299/18723 | 1.35e-10 | 3.94e-09 | 191 |
| GO:00457865 | Esophagus | ESCC | negative regulation of cell cycle | 236/8552 | 385/18723 | 3.62e-10 | 9.93e-09 | 236 |
| GO:00000754 | Esophagus | ESCC | cell cycle checkpoint | 117/8552 | 169/18723 | 4.47e-10 | 1.17e-08 | 117 |
| GO:0010639110 | Esophagus | ESCC | negative regulation of organelle organization | 215/8552 | 348/18723 | 8.20e-10 | 2.01e-08 | 215 |
| GO:00070934 | Esophagus | ESCC | mitotic cell cycle checkpoint | 90/8552 | 129/18723 | 2.49e-08 | 4.69e-07 | 90 |
| GO:00519833 | Esophagus | ESCC | regulation of chromosome segregation | 67/8552 | 91/18723 | 5.42e-08 | 9.66e-07 | 67 |
| GO:00070883 | Esophagus | ESCC | regulation of mitotic nuclear division | 78/8552 | 110/18723 | 6.96e-08 | 1.21e-06 | 78 |
| GO:00070912 | Esophagus | ESCC | metaphase/anaphase transition of mitotic cell cycle | 49/8552 | 62/18723 | 7.65e-08 | 1.33e-06 | 49 |
| GO:00513062 | Esophagus | ESCC | mitotic sister chromatid separation | 52/8552 | 67/18723 | 9.14e-08 | 1.52e-06 | 52 |
| Page: 1 2 3 4 5 6 7 8 9 10 11 12 13 14 15 16 |
| Pathway ID | Tissue | Disease Stage | Description | Gene Ratio | Bg Ratio | pvalue | p.adjust | qvalue | Count |
| Page: 1 |
Top |
Cell-cell communication analysis |
| Identification of potential cell-cell interactions between two cell types and their ligand-receptor pairs for different disease states |
| Ligand | Receptor | LRpair | Pathway | Tissue | Disease Stage |
| Page: 1 |
Top |
Single-cell gene regulatory network inference analysis |
| Find out the significant the regulons (TFs) and the target genes of each regulon across cell types for different disease states |
| TF | Cell Type | Tissue | Disease Stage | Target Gene | RSS | Regulon Activity |
| ∗The dot plots of a searched regulon are shown for all cell subpopulations in each disease state of each tissue based on the regulon specific score inferred using pySCENIC and by calculating the average expression. |
| Page: 1 |
Top |
Somatic mutation of malignant transformation related genes |
| Annotation of somatic variants for genes involved in malignant transformation |
| Hugo Symbol | Variant Class | Variant Classification | dbSNP RS | HGVSc | HGVSp | HGVSp Short | SWISSPROT | BIOTYPE | SIFT | PolyPhen | Tumor Sample Barcode | Tissue | Histology | Sex | Age | Stage | Therapy Types | Drugs | Outcome |
| PSMG2 | SNV | Missense_Mutation | c.492N>C | p.Glu164Asp | p.E164D | Q969U7 | protein_coding | tolerated(0.06) | probably_damaging(0.948) | TCGA-AA-3510-01 | Colorectum | colon adenocarcinoma | Male | >=65 | I/II | Unknown | Unknown | SD | |
| PSMG2 | SNV | Missense_Mutation | novel | c.625N>A | p.Ser209Thr | p.S209T | Q969U7 | protein_coding | deleterious(0) | probably_damaging(0.914) | TCGA-AA-3821-01 | Colorectum | colon adenocarcinoma | Female | >=65 | I/II | Unknown | Unknown | SD |
| PSMG2 | insertion | In_Frame_Ins | novel | c.624_625insAAC | p.Val208_Ser209insAsn | p.V208_S209insN | Q969U7 | protein_coding | TCGA-AA-3821-01 | Colorectum | colon adenocarcinoma | Female | >=65 | I/II | Unknown | Unknown | SD | ||
| PSMG2 | deletion | Frame_Shift_Del | c.778delN | p.Pro261LeufsTer36 | p.P261Lfs*36 | Q969U7 | protein_coding | TCGA-AA-3833-01 | Colorectum | colon adenocarcinoma | Female | <65 | I/II | Unknown | Unknown | SD | |||
| PSMG2 | deletion | Frame_Shift_Del | c.26delN | p.Asp11ThrfsTer8 | p.D11Tfs*8 | Q969U7 | protein_coding | TCGA-AM-5821-01 | Colorectum | colon adenocarcinoma | Female | >=65 | I/II | Unknown | Unknown | SD | |||
| PSMG2 | deletion | Frame_Shift_Del | c.443delN | p.Ser150ValfsTer6 | p.S150Vfs*6 | Q969U7 | protein_coding | TCGA-G4-6586-01 | Colorectum | colon adenocarcinoma | Female | >=65 | I/II | Unknown | Unknown | SD | |||
| PSMG2 | SNV | Missense_Mutation | c.161N>T | p.Pro54Leu | p.P54L | Q969U7 | protein_coding | deleterious(0.01) | probably_damaging(1) | TCGA-AP-A056-01 | Endometrium | uterine corpus endometrioid carcinoma | Female | <65 | I/II | Unknown | Unknown | SD | |
| PSMG2 | SNV | Missense_Mutation | c.691N>A | p.Leu231Ile | p.L231I | Q969U7 | protein_coding | tolerated(1) | benign(0) | TCGA-AP-A059-01 | Endometrium | uterine corpus endometrioid carcinoma | Female | >=65 | I/II | Unknown | Unknown | SD | |
| PSMG2 | SNV | Missense_Mutation | novel | c.337A>C | p.Ser113Arg | p.S113R | Q969U7 | protein_coding | tolerated(0.06) | possibly_damaging(0.872) | TCGA-AX-A2H2-01 | Endometrium | uterine corpus endometrioid carcinoma | Female | >=65 | I/II | Unknown | Unknown | SD |
| PSMG2 | SNV | Missense_Mutation | novel | c.782N>T | p.Pro261Leu | p.P261L | Q969U7 | protein_coding | tolerated(0.09) | possibly_damaging(0.677) | TCGA-B5-A1MX-01 | Endometrium | uterine corpus endometrioid carcinoma | Female | <65 | I/II | Hormone Therapy | megace | SD |
| Page: 1 2 3 |
Top |
Related drugs of malignant transformation related genes |
| Identification of chemicals and drugs interact with genes involved in malignant transfromation |
| (DGIdb 4.0) |
| Entrez ID | Symbol | Category | Interaction Types | Drug Claim Name | Drug Name | PMIDs |
| Page: 1 |

Copyright 2023-Present -The University of Texas Health Science Center at Houston |