
|
|||||
|
 | |
| |
| |
| |
| |
| |
|
Gene: PSMG1 |
Gene summary for PSMG1 |
| Gene information | Species | Human | Gene symbol | PSMG1 | Gene ID | 8624 |
| Gene name | proteasome assembly chaperone 1 | |
| Gene Alias | C21LRP | |
| Cytomap | 21q22.2 | |
| Gene Type | protein-coding | GO ID | GO:0007275 | UniProtAcc | O95456 |
Top |
Malignant transformation analysis |
| Identification of the aberrant gene expression in precancerous and cancerous lesions by comparing the gene expression of stem-like cells in diseased tissues with normal stem cells |
| Entrez ID | Symbol | Replicates | Species | Organ | Tissue | Adj P-value | Log2FC | Malignancy |
| 8624 | PSMG1 | LZE4T | Human | Esophagus | ESCC | 2.10e-04 | 2.15e-01 | 0.0811 |
| 8624 | PSMG1 | LZE7T | Human | Esophagus | ESCC | 8.49e-14 | 9.21e-01 | 0.0667 |
| 8624 | PSMG1 | LZE8T | Human | Esophagus | ESCC | 1.29e-12 | 4.43e-01 | 0.067 |
| 8624 | PSMG1 | LZE20T | Human | Esophagus | ESCC | 1.43e-02 | 9.21e-02 | 0.0662 |
| 8624 | PSMG1 | LZE22T | Human | Esophagus | ESCC | 3.68e-05 | 2.15e-01 | 0.068 |
| 8624 | PSMG1 | LZE24T | Human | Esophagus | ESCC | 6.16e-13 | 4.09e-01 | 0.0596 |
| 8624 | PSMG1 | LZE6T | Human | Esophagus | ESCC | 2.97e-13 | 5.41e-01 | 0.0845 |
| 8624 | PSMG1 | P1T-E | Human | Esophagus | ESCC | 2.96e-07 | 2.64e-01 | 0.0875 |
| 8624 | PSMG1 | P2T-E | Human | Esophagus | ESCC | 9.44e-28 | 5.29e-01 | 0.1177 |
| 8624 | PSMG1 | P4T-E | Human | Esophagus | ESCC | 1.71e-51 | 1.16e+00 | 0.1323 |
| 8624 | PSMG1 | P5T-E | Human | Esophagus | ESCC | 4.59e-39 | 1.06e+00 | 0.1327 |
| 8624 | PSMG1 | P8T-E | Human | Esophagus | ESCC | 3.36e-14 | 2.93e-01 | 0.0889 |
| 8624 | PSMG1 | P9T-E | Human | Esophagus | ESCC | 4.60e-16 | 4.89e-01 | 0.1131 |
| 8624 | PSMG1 | P10T-E | Human | Esophagus | ESCC | 1.43e-38 | 8.55e-01 | 0.116 |
| 8624 | PSMG1 | P11T-E | Human | Esophagus | ESCC | 3.69e-13 | 4.52e-01 | 0.1426 |
| 8624 | PSMG1 | P12T-E | Human | Esophagus | ESCC | 2.54e-20 | 5.28e-01 | 0.1122 |
| 8624 | PSMG1 | P15T-E | Human | Esophagus | ESCC | 1.08e-22 | 1.91e-01 | 0.1149 |
| 8624 | PSMG1 | P16T-E | Human | Esophagus | ESCC | 3.53e-15 | 2.92e-01 | 0.1153 |
| 8624 | PSMG1 | P17T-E | Human | Esophagus | ESCC | 1.91e-12 | 4.92e-01 | 0.1278 |
| 8624 | PSMG1 | P19T-E | Human | Esophagus | ESCC | 7.49e-05 | 7.41e-01 | 0.1662 |
| Page: 1 2 3 4 5 6 |
| Tissue | Expression Dynamics | Abbreviation |
| Esophagus | 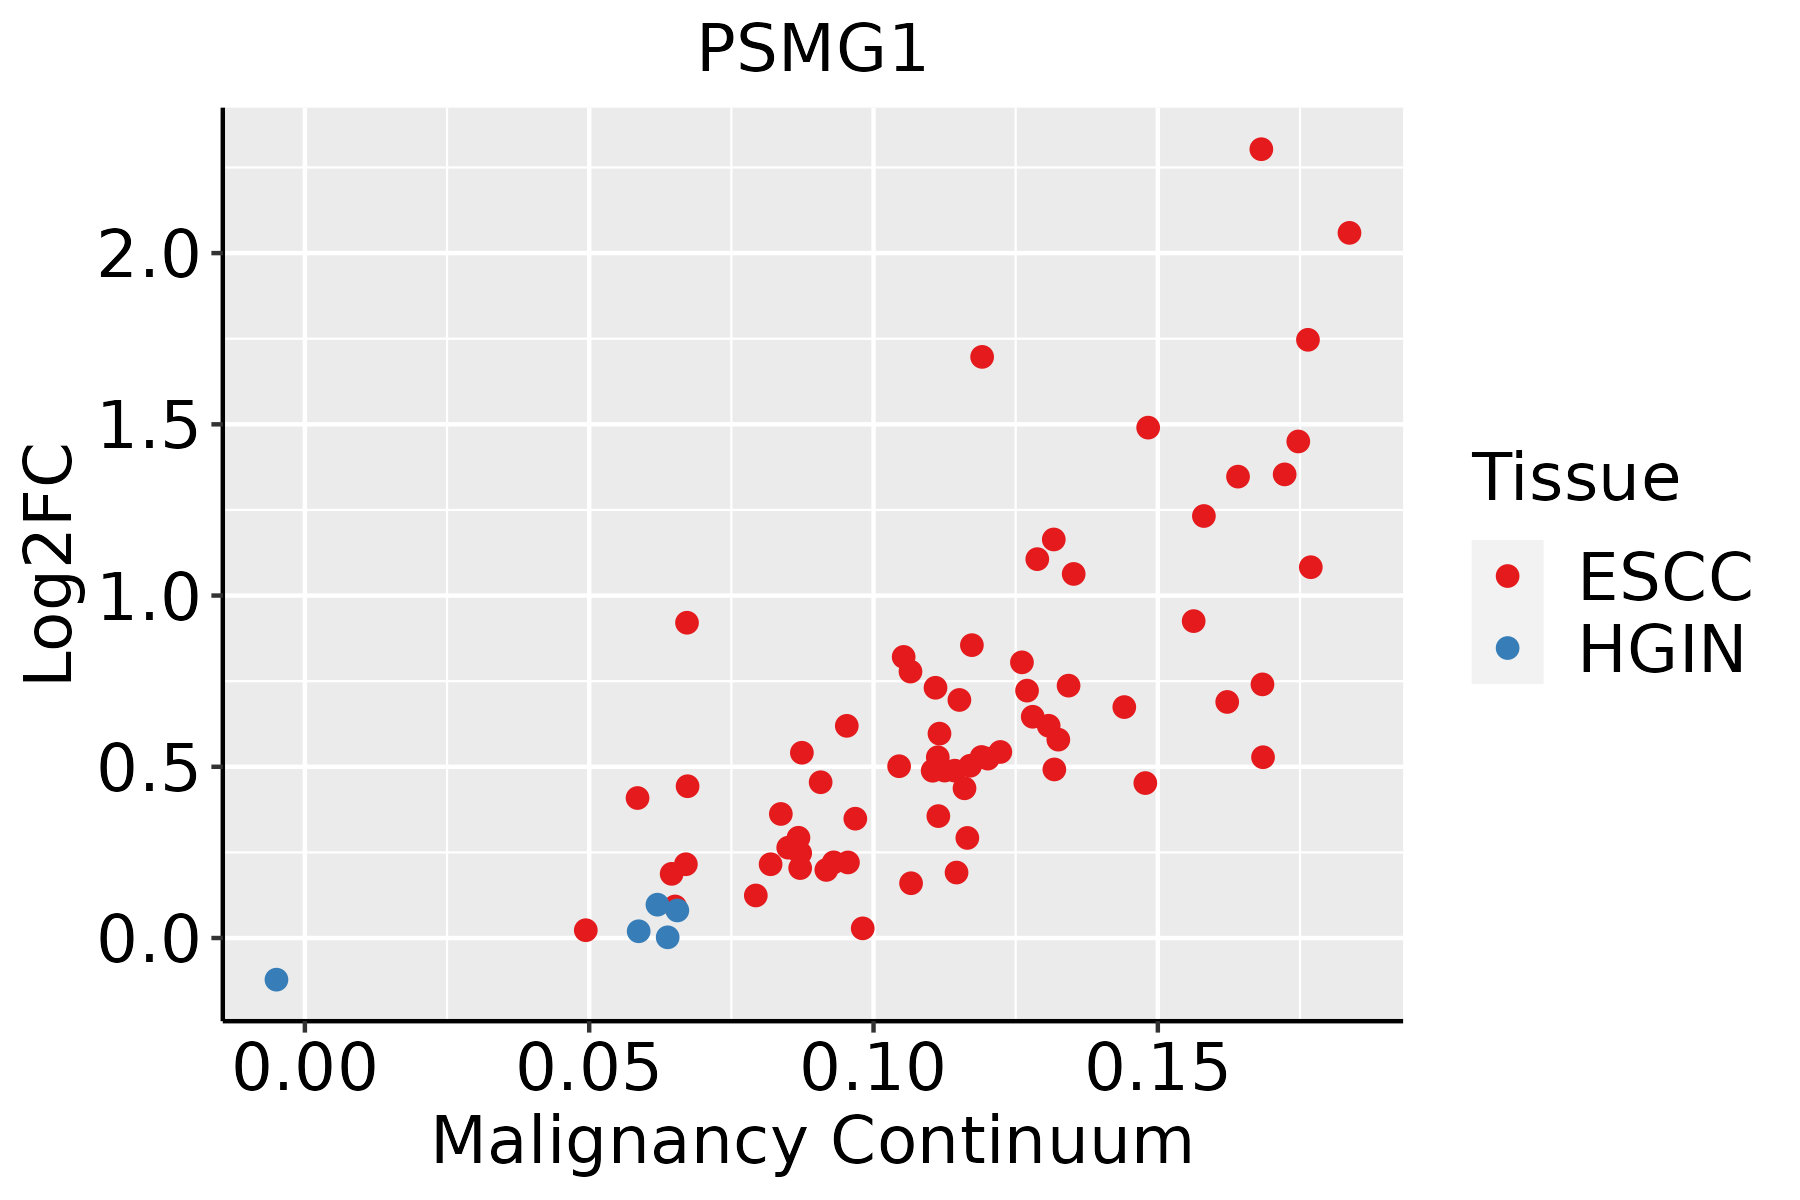 | ESCC: Esophageal squamous cell carcinoma |
| HGIN: High-grade intraepithelial neoplasias | ||
| LGIN: Low-grade intraepithelial neoplasias | ||
| Liver | 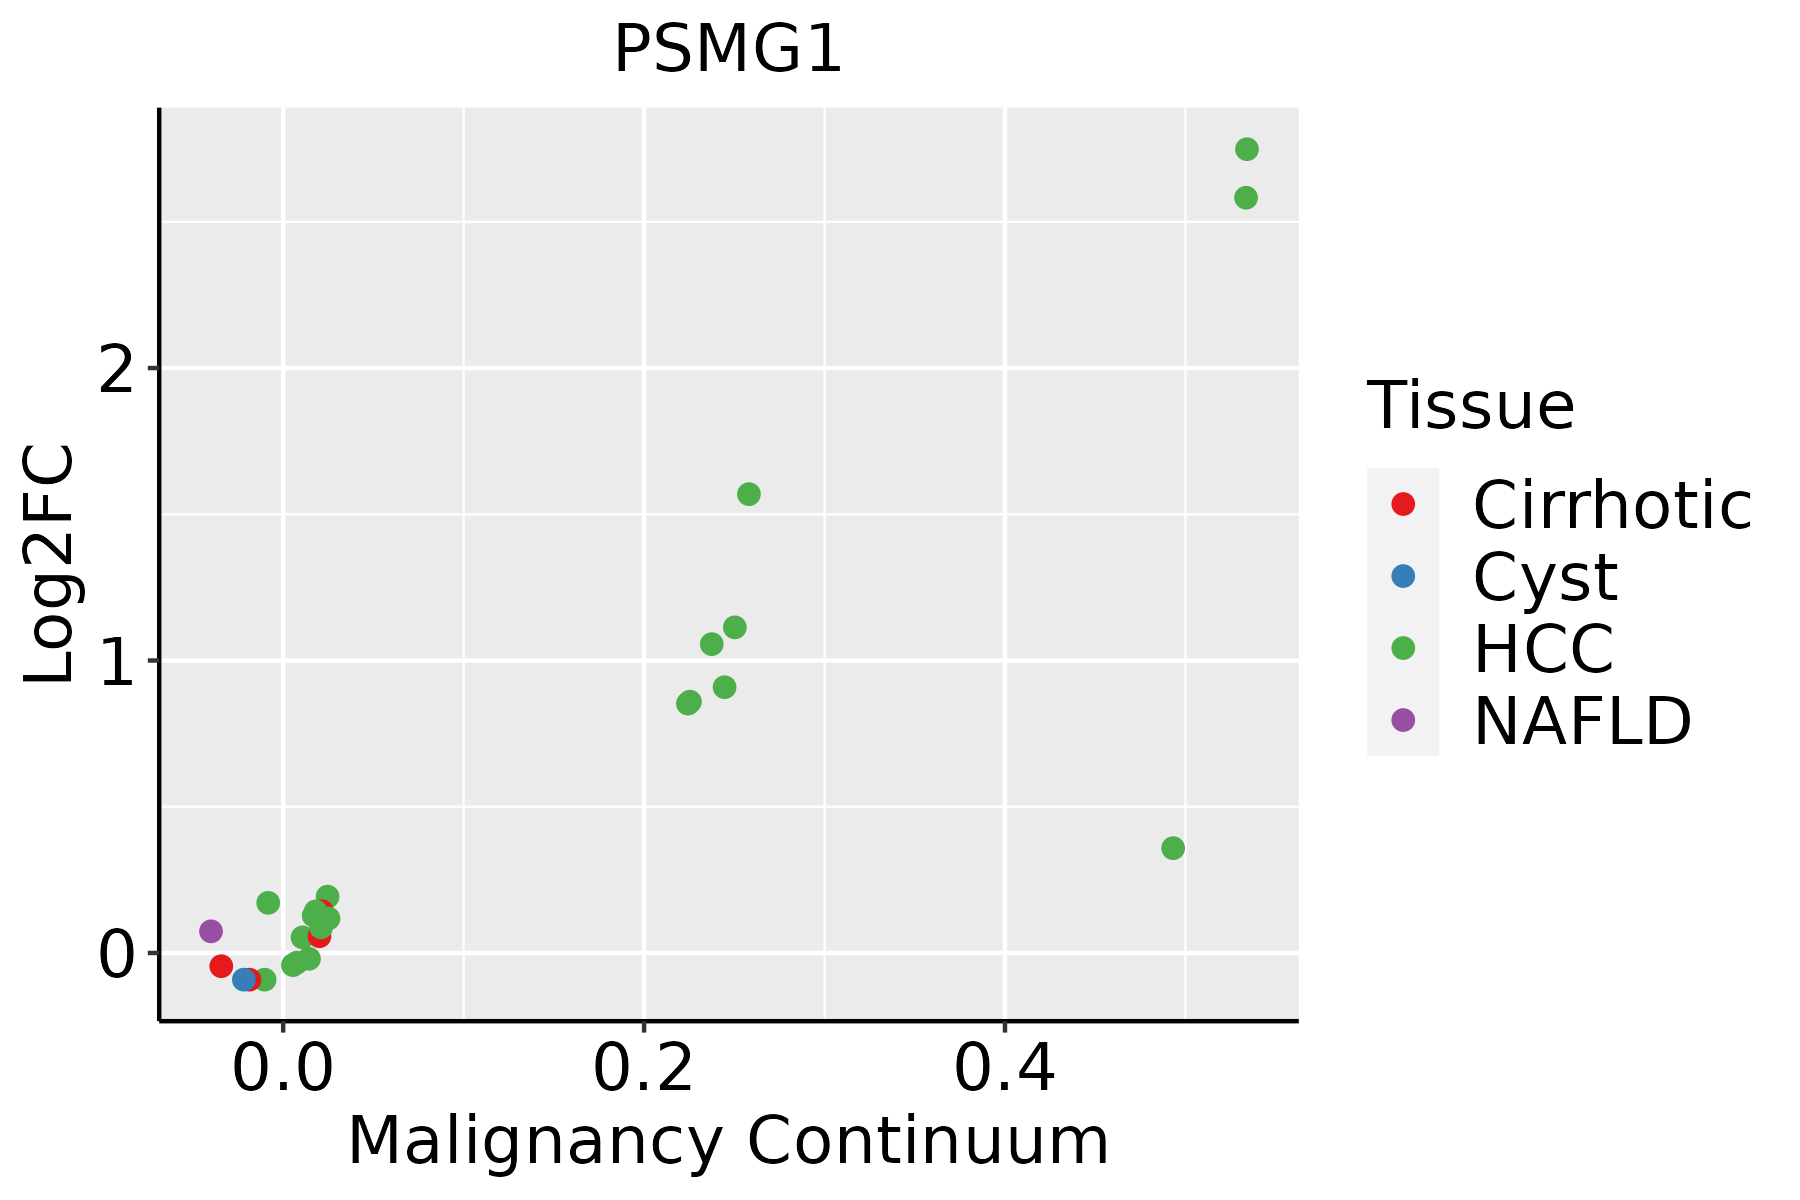 | HCC: Hepatocellular carcinoma |
| NAFLD: Non-alcoholic fatty liver disease | ||
| Oral Cavity | 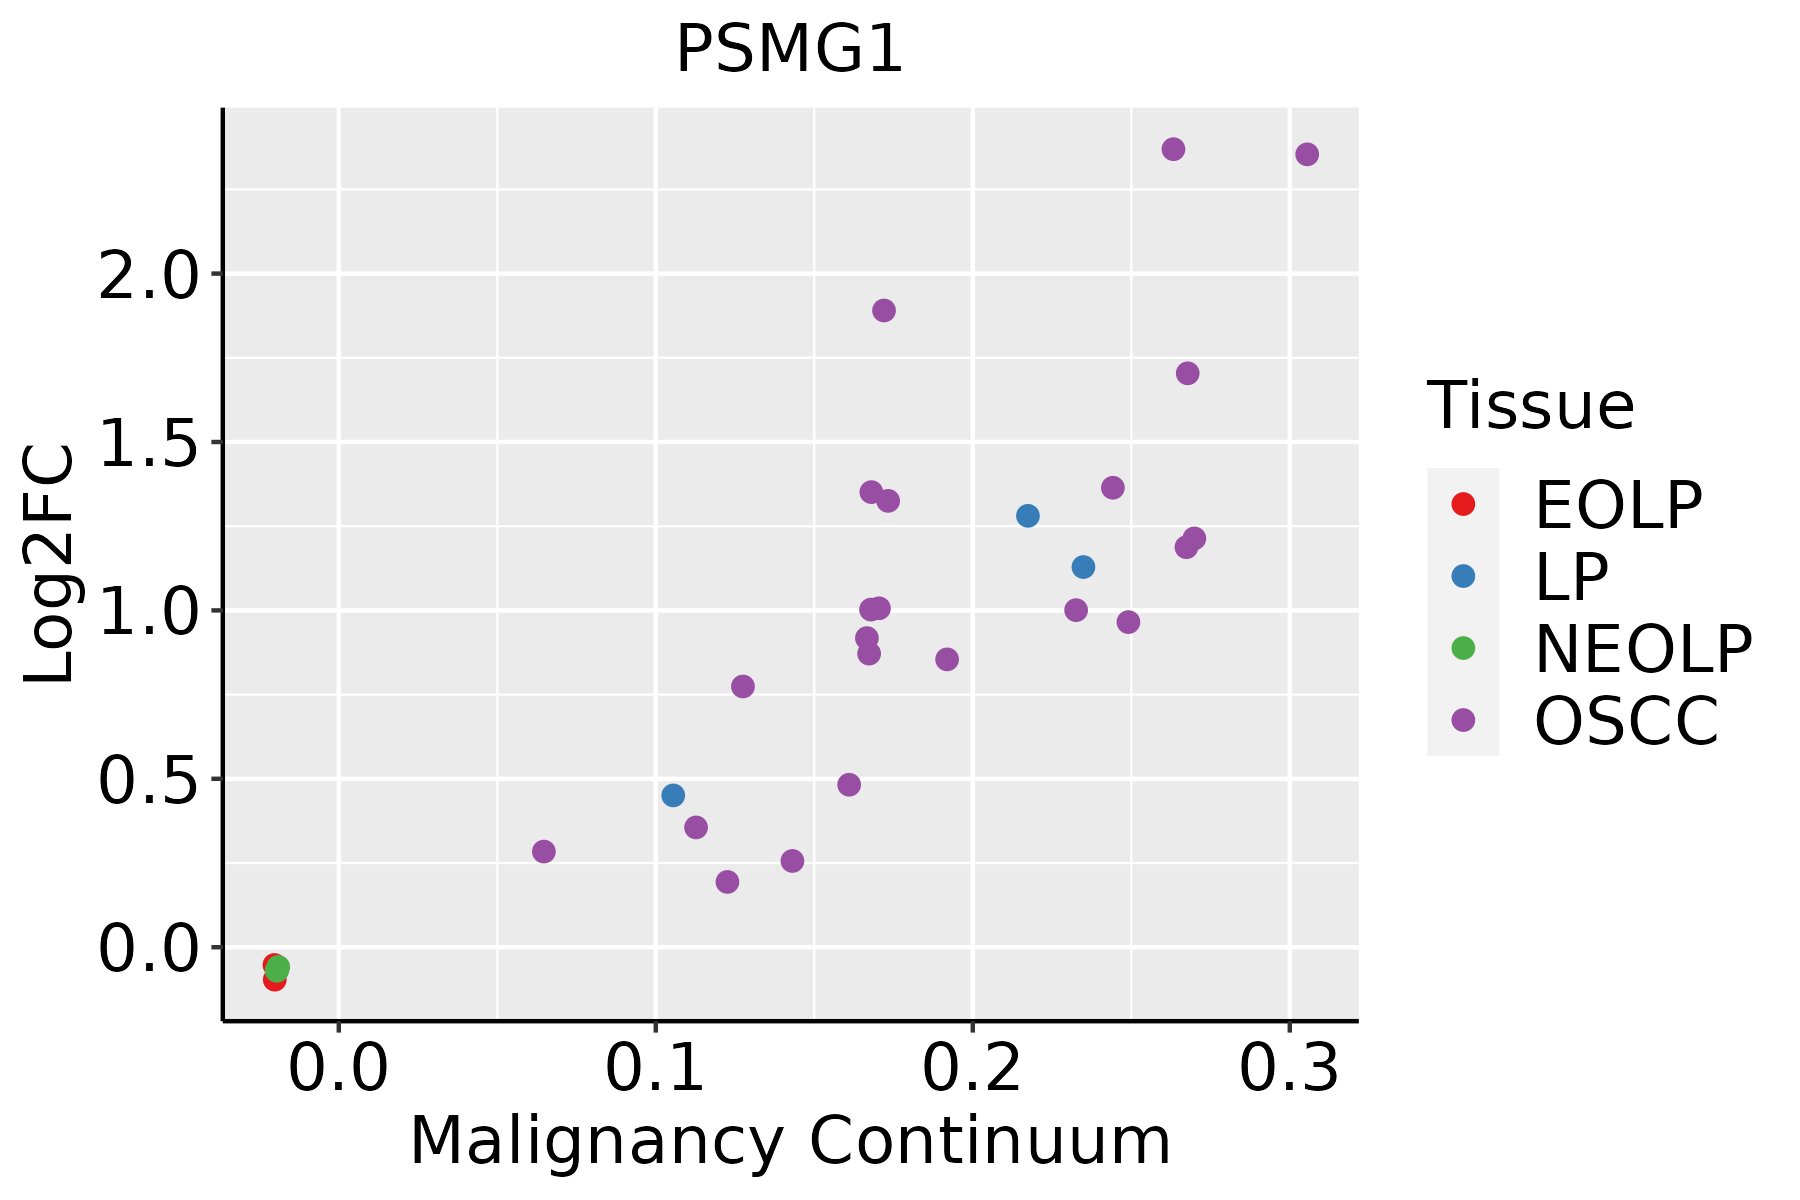 | EOLP: Erosive Oral lichen planus |
| LP: leukoplakia | ||
| NEOLP: Non-erosive oral lichen planus | ||
| OSCC: Oral squamous cell carcinoma | ||
| Skin | 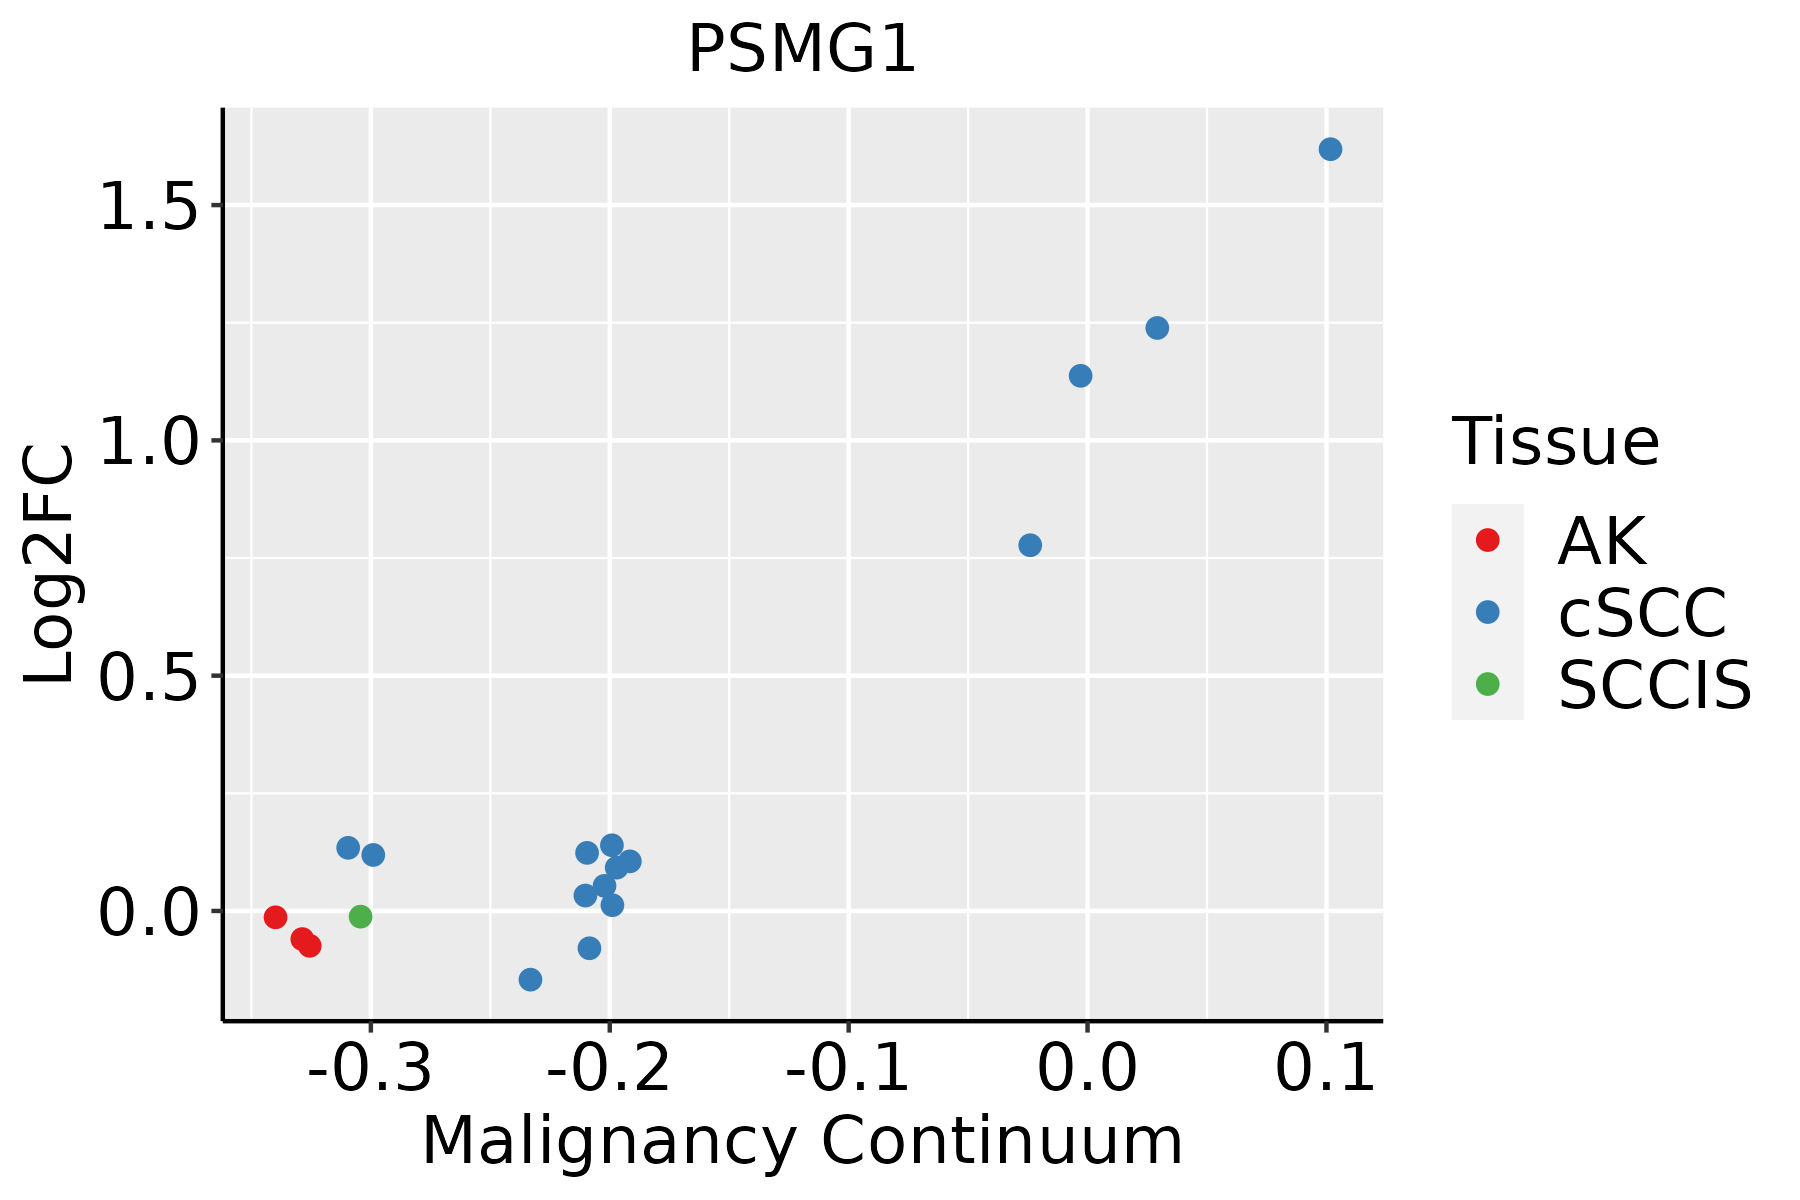 | AK: Actinic keratosis |
| cSCC: Cutaneous squamous cell carcinoma | ||
| SCCIS:squamous cell carcinoma in situ |
| ∗log2FC in expression of this searched gene in stem-like cells from each diseased tissue sample relative to stem-like cells in normal samples in each tissue plotted against the malignancy continuum. Samples are colored based on if they are from different disease stage. |
Top |
Malignant transformation related pathway analysis |
| Find out the enriched GO biological processes and KEGG pathways involved in transition from healthy to precancer to cancer |
| Tissue | Disease Stage | Enriched GO biological Processes |
| Colorectum | AD |  |
| Colorectum | SER |  |
| Colorectum | MSS |  |
| Colorectum | MSI-H |  |
| Colorectum | FAP |  |
| ∗Top 15 enriched GO BP terms are showed in the bar plot of each disease state in each tissue. Each row represents a significant GO biological process which is colored according to the -log10(p.adjust). |
| Page: 1 2 3 4 5 6 7 8 9 |
| GO ID | Tissue | Disease Stage | Description | Gene Ratio | Bg Ratio | pvalue | p.adjust | Count |
| GO:004324811 | Esophagus | ESCC | proteasome assembly | 11/8552 | 12/18723 | 1.26e-03 | 6.06e-03 | 11 |
| GO:005113119 | Esophagus | ESCC | chaperone-mediated protein complex assembly | 17/8552 | 23/18723 | 5.73e-03 | 2.13e-02 | 17 |
| GO:00511316 | Liver | Cirrhotic | chaperone-mediated protein complex assembly | 16/4634 | 23/18723 | 7.54e-06 | 1.15e-04 | 16 |
| GO:0043248 | Liver | Cirrhotic | proteasome assembly | 9/4634 | 12/18723 | 3.59e-04 | 3.03e-03 | 9 |
| GO:00432481 | Liver | HCC | proteasome assembly | 12/7958 | 12/18723 | 3.46e-05 | 3.45e-04 | 12 |
| GO:005113111 | Liver | HCC | chaperone-mediated protein complex assembly | 17/7958 | 23/18723 | 2.28e-03 | 1.13e-02 | 17 |
| GO:00432482 | Oral cavity | OSCC | proteasome assembly | 11/7305 | 12/18723 | 2.45e-04 | 1.57e-03 | 11 |
| GO:005113116 | Oral cavity | OSCC | chaperone-mediated protein complex assembly | 17/7305 | 23/18723 | 7.28e-04 | 3.98e-03 | 17 |
| GO:005113117 | Oral cavity | LP | chaperone-mediated protein complex assembly | 17/4623 | 23/18723 | 9.55e-07 | 2.43e-05 | 17 |
| GO:0051131110 | Skin | cSCC | chaperone-mediated protein complex assembly | 16/4864 | 23/18723 | 1.47e-05 | 1.82e-04 | 16 |
| GO:00432484 | Skin | cSCC | proteasome assembly | 10/4864 | 12/18723 | 5.36e-05 | 5.38e-04 | 10 |
| Page: 1 |
| Pathway ID | Tissue | Disease Stage | Description | Gene Ratio | Bg Ratio | pvalue | p.adjust | qvalue | Count |
| Page: 1 |
Top |
Cell-cell communication analysis |
| Identification of potential cell-cell interactions between two cell types and their ligand-receptor pairs for different disease states |
| Ligand | Receptor | LRpair | Pathway | Tissue | Disease Stage |
| Page: 1 |
Top |
Single-cell gene regulatory network inference analysis |
| Find out the significant the regulons (TFs) and the target genes of each regulon across cell types for different disease states |
| TF | Cell Type | Tissue | Disease Stage | Target Gene | RSS | Regulon Activity |
| ∗The dot plots of a searched regulon are shown for all cell subpopulations in each disease state of each tissue based on the regulon specific score inferred using pySCENIC and by calculating the average expression. |
| Page: 1 |
Top |
Somatic mutation of malignant transformation related genes |
| Annotation of somatic variants for genes involved in malignant transformation |
| Hugo Symbol | Variant Class | Variant Classification | dbSNP RS | HGVSc | HGVSp | HGVSp Short | SWISSPROT | BIOTYPE | SIFT | PolyPhen | Tumor Sample Barcode | Tissue | Histology | Sex | Age | Stage | Therapy Types | Drugs | Outcome |
| PSMG1 | SNV | Missense_Mutation | c.182N>A | p.Ser61Tyr | p.S61Y | O95456 | protein_coding | deleterious(0.02) | benign(0.444) | TCGA-AA-3510-01 | Colorectum | colon adenocarcinoma | Male | >=65 | I/II | Unknown | Unknown | SD | |
| PSMG1 | SNV | Missense_Mutation | rs779327198 | c.686N>T | p.Pro229Leu | p.P229L | O95456 | protein_coding | deleterious(0) | possibly_damaging(0.607) | TCGA-EI-6917-01 | Colorectum | rectum adenocarcinoma | Male | <65 | III/IV | Chemotherapy | 5fluorouracil+oxaciplatina+l-folinian | SD |
| PSMG1 | deletion | Frame_Shift_Del | c.580delN | p.Thr194HisfsTer13 | p.T194Hfs*13 | O95456 | protein_coding | TCGA-AM-5821-01 | Colorectum | colon adenocarcinoma | Female | >=65 | I/II | Unknown | Unknown | SD | |||
| PSMG1 | SNV | Missense_Mutation | rs755573511 | c.152G>A | p.Arg51Gln | p.R51Q | O95456 | protein_coding | tolerated(0.63) | benign(0.015) | TCGA-AJ-A3EL-01 | Endometrium | uterine corpus endometrioid carcinoma | Female | <65 | I/II | Unknown | Unknown | SD |
| PSMG1 | SNV | Missense_Mutation | c.148C>T | p.Leu50Phe | p.L50F | O95456 | protein_coding | tolerated(0.16) | benign(0.003) | TCGA-AX-A1C8-01 | Endometrium | uterine corpus endometrioid carcinoma | Female | >=65 | III/IV | Unspecific | Carboplatin | SD | |
| PSMG1 | SNV | Missense_Mutation | rs372682958 | c.509G>A | p.Arg170Gln | p.R170Q | O95456 | protein_coding | tolerated(0.1) | possibly_damaging(0.883) | TCGA-AX-A2HG-01 | Endometrium | uterine corpus endometrioid carcinoma | Female | <65 | I/II | Unknown | Unknown | SD |
| PSMG1 | SNV | Missense_Mutation | novel | c.380N>C | p.Lys127Thr | p.K127T | O95456 | protein_coding | tolerated(0.41) | possibly_damaging(0.866) | TCGA-B5-A1MR-01 | Endometrium | uterine corpus endometrioid carcinoma | Female | >=65 | III/IV | Unknown | Unknown | SD |
| PSMG1 | SNV | Missense_Mutation | rs755573511 | c.152N>A | p.Arg51Gln | p.R51Q | O95456 | protein_coding | tolerated(0.63) | benign(0.015) | TCGA-B5-A1MX-01 | Endometrium | uterine corpus endometrioid carcinoma | Female | <65 | I/II | Hormone Therapy | megace | SD |
| PSMG1 | SNV | Missense_Mutation | novel | c.674N>C | p.Val225Ala | p.V225A | O95456 | protein_coding | deleterious(0.02) | probably_damaging(0.986) | TCGA-D1-A175-01 | Endometrium | uterine corpus endometrioid carcinoma | Female | <65 | I/II | Chemotherapy | paclitaxel | SD |
| PSMG1 | SNV | Missense_Mutation | novel | c.822G>T | p.Lys274Asn | p.K274N | O95456 | protein_coding | deleterious(0.01) | possibly_damaging(0.643) | TCGA-EO-A22X-01 | Endometrium | uterine corpus endometrioid carcinoma | Female | <65 | III/IV | Unspecific | Carboplatin | Complete Response |
| Page: 1 2 3 |
Top |
Related drugs of malignant transformation related genes |
| Identification of chemicals and drugs interact with genes involved in malignant transfromation |
| (DGIdb 4.0) |
| Entrez ID | Symbol | Category | Interaction Types | Drug Claim Name | Drug Name | PMIDs |
| Page: 1 |

Copyright 2023-Present -The University of Texas Health Science Center at Houston |