
|
|||||
|
 | |
| |
| |
| |
| |
| |
|
Gene: PSME4 |
Gene summary for PSME4 |
| Gene information | Species | Human | Gene symbol | PSME4 | Gene ID | 23198 |
| Gene name | proteasome activator subunit 4 | |
| Gene Alias | PA200 | |
| Cytomap | 2p16.2 | |
| Gene Type | protein-coding | GO ID | GO:0000003 | UniProtAcc | Q14997 |
Top |
Malignant transformation analysis |
| Identification of the aberrant gene expression in precancerous and cancerous lesions by comparing the gene expression of stem-like cells in diseased tissues with normal stem cells |
| Entrez ID | Symbol | Replicates | Species | Organ | Tissue | Adj P-value | Log2FC | Malignancy |
| 23198 | PSME4 | CCI_1 | Human | Cervix | CC | 2.37e-10 | 1.39e+00 | 0.528 |
| 23198 | PSME4 | CCI_2 | Human | Cervix | CC | 1.84e-11 | 1.55e+00 | 0.5249 |
| 23198 | PSME4 | CCI_3 | Human | Cervix | CC | 2.49e-16 | 9.62e-01 | 0.516 |
| 23198 | PSME4 | HTA11_3410_2000001011 | Human | Colorectum | AD | 1.41e-08 | -4.27e-01 | 0.0155 |
| 23198 | PSME4 | HTA11_866_2000001011 | Human | Colorectum | AD | 5.73e-03 | -3.18e-01 | -0.1001 |
| 23198 | PSME4 | HTA11_5212_2000001011 | Human | Colorectum | AD | 1.47e-02 | -6.71e-01 | -0.2061 |
| 23198 | PSME4 | HTA11_7696_3000711011 | Human | Colorectum | AD | 1.58e-04 | -3.02e-01 | 0.0674 |
| 23198 | PSME4 | A015-C-203 | Human | Colorectum | FAP | 1.84e-27 | -4.67e-01 | -0.1294 |
| 23198 | PSME4 | A015-C-204 | Human | Colorectum | FAP | 1.22e-04 | -3.24e-01 | -0.0228 |
| 23198 | PSME4 | A014-C-040 | Human | Colorectum | FAP | 4.83e-02 | -3.06e-01 | -0.1184 |
| 23198 | PSME4 | A002-C-201 | Human | Colorectum | FAP | 1.10e-07 | -3.25e-01 | 0.0324 |
| 23198 | PSME4 | A002-C-203 | Human | Colorectum | FAP | 6.33e-08 | -2.29e-01 | 0.2786 |
| 23198 | PSME4 | A001-C-119 | Human | Colorectum | FAP | 4.90e-04 | -3.05e-01 | -0.1557 |
| 23198 | PSME4 | A001-C-108 | Human | Colorectum | FAP | 3.72e-16 | -2.05e-01 | -0.0272 |
| 23198 | PSME4 | A002-C-205 | Human | Colorectum | FAP | 8.05e-18 | -4.05e-01 | -0.1236 |
| 23198 | PSME4 | A015-C-005 | Human | Colorectum | FAP | 2.20e-03 | -3.34e-01 | -0.0336 |
| 23198 | PSME4 | A015-C-006 | Human | Colorectum | FAP | 1.76e-08 | -1.79e-01 | -0.0994 |
| 23198 | PSME4 | A015-C-106 | Human | Colorectum | FAP | 1.18e-11 | -2.40e-01 | -0.0511 |
| 23198 | PSME4 | A002-C-114 | Human | Colorectum | FAP | 3.78e-15 | -4.80e-01 | -0.1561 |
| 23198 | PSME4 | A015-C-104 | Human | Colorectum | FAP | 1.05e-30 | -4.53e-01 | -0.1899 |
| Page: 1 2 3 4 5 6 7 8 9 10 |
| Tissue | Expression Dynamics | Abbreviation |
| Cervix |  | CC: Cervix cancer |
| HSIL_HPV: HPV-infected high-grade squamous intraepithelial lesions | ||
| N_HPV: HPV-infected normal cervix | ||
| Colorectum (GSE201348) |  | FAP: Familial adenomatous polyposis |
| CRC: Colorectal cancer | ||
| Colorectum (HTA11) |  | AD: Adenomas |
| SER: Sessile serrated lesions | ||
| MSI-H: Microsatellite-high colorectal cancer | ||
| MSS: Microsatellite stable colorectal cancer | ||
| Endometrium |  | AEH: Atypical endometrial hyperplasia |
| EEC: Endometrioid Cancer | ||
| Esophagus | 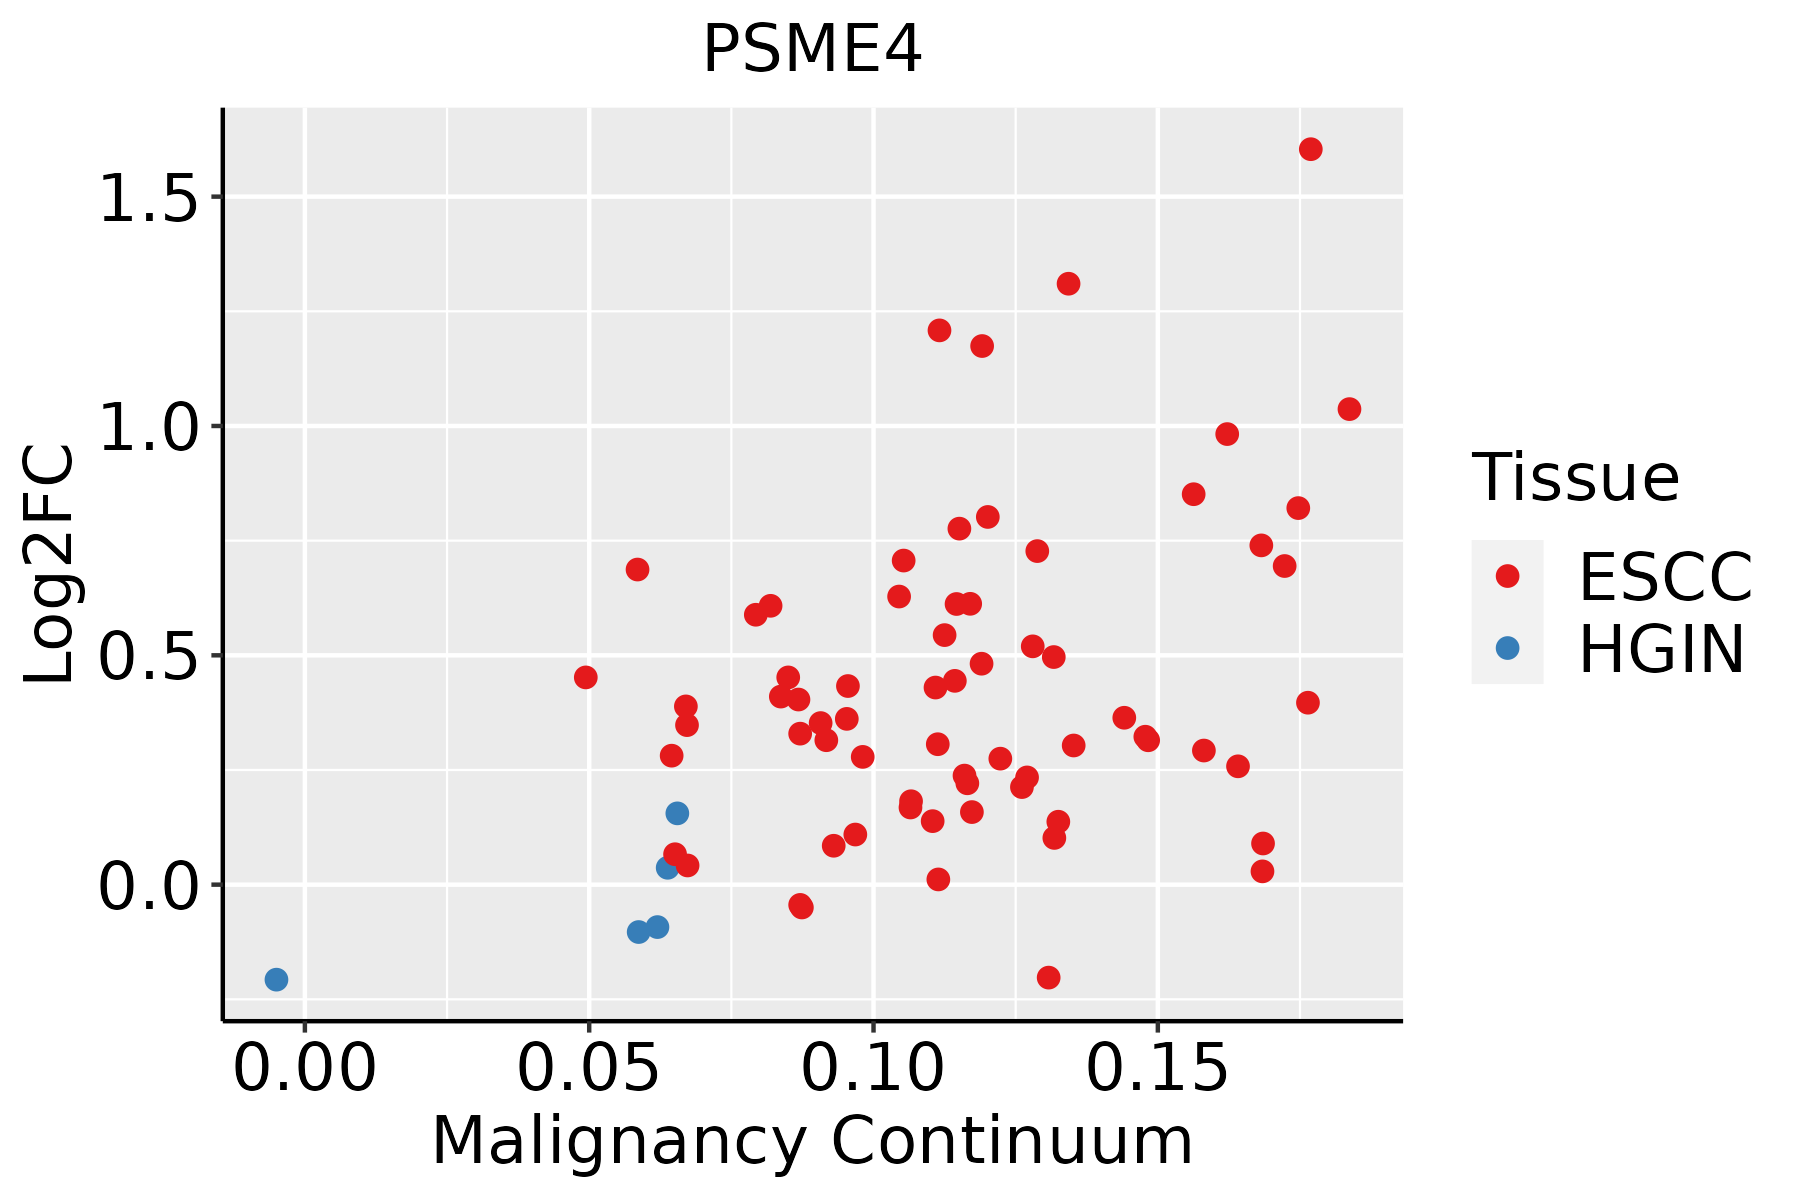 | ESCC: Esophageal squamous cell carcinoma |
| HGIN: High-grade intraepithelial neoplasias | ||
| LGIN: Low-grade intraepithelial neoplasias | ||
| Liver | 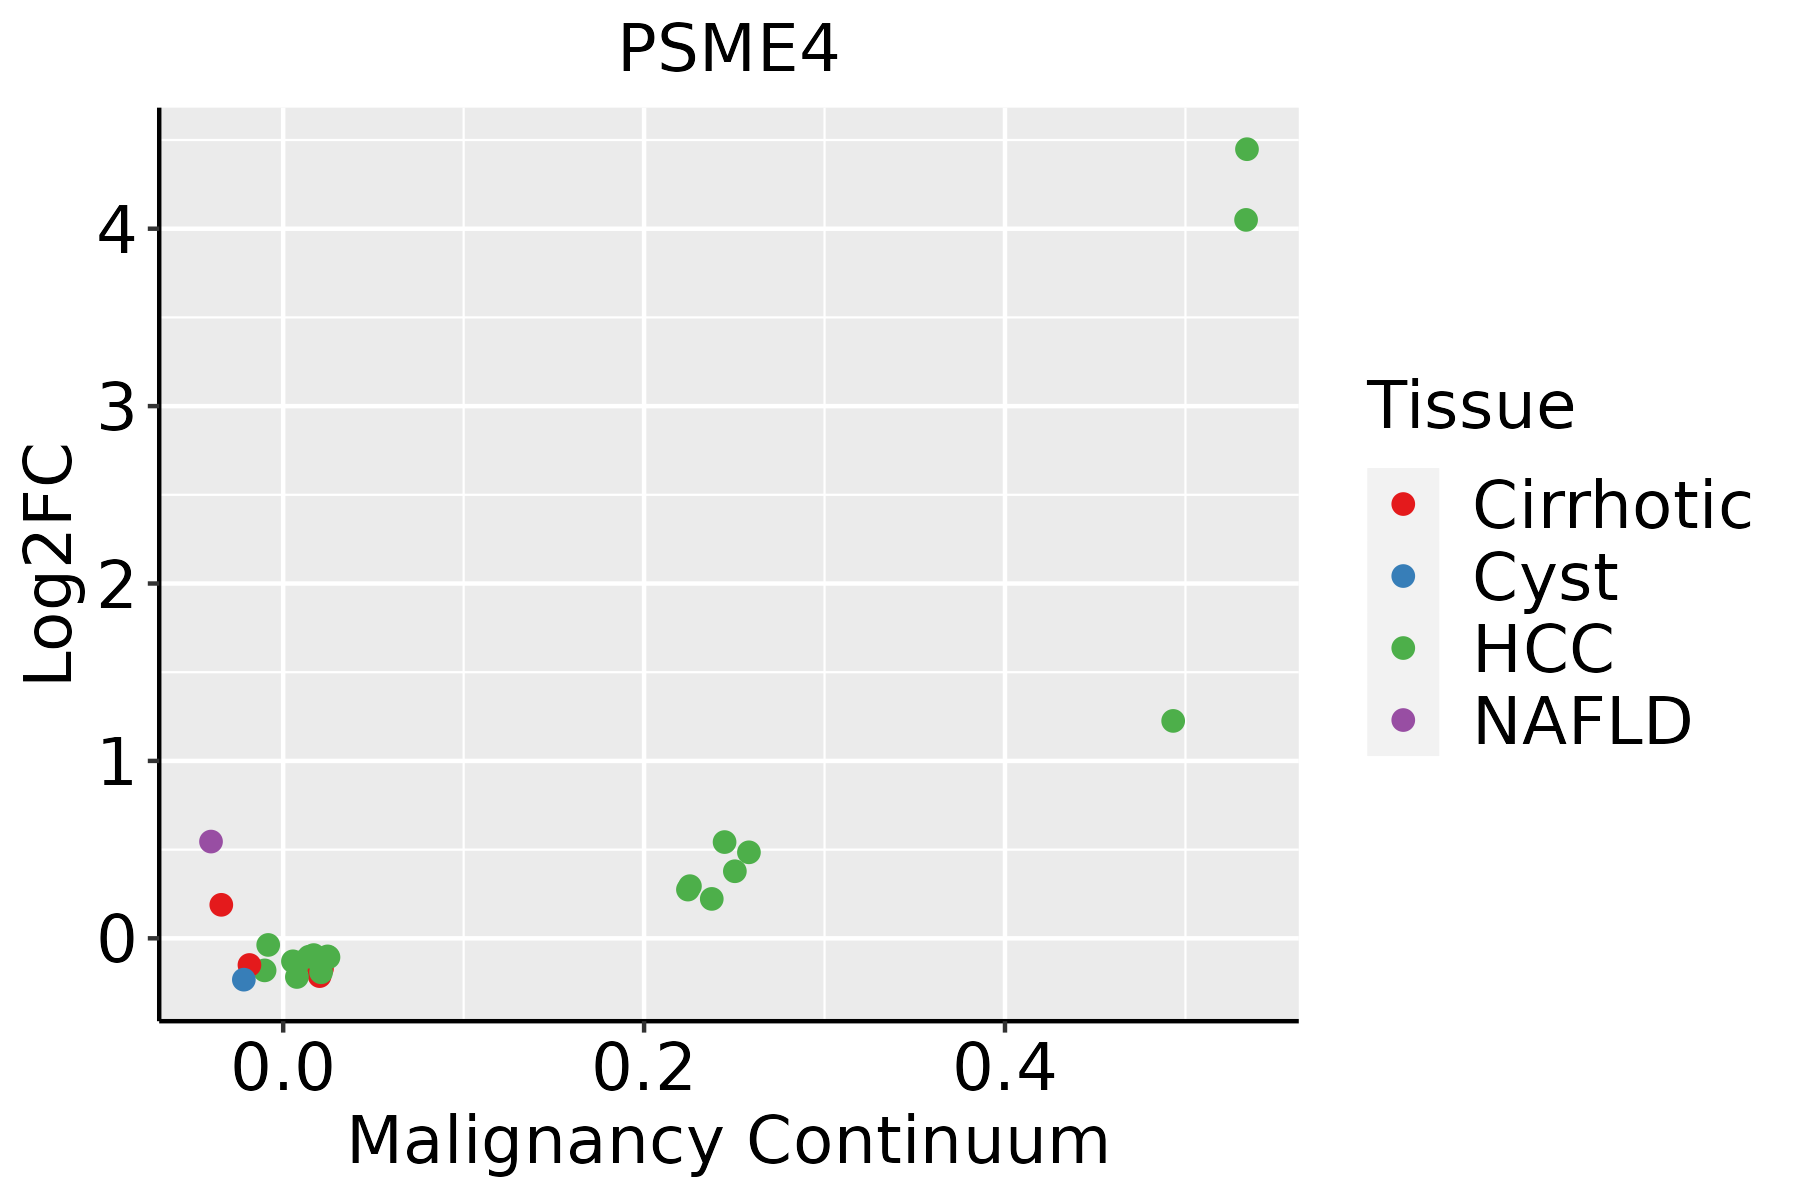 | HCC: Hepatocellular carcinoma |
| NAFLD: Non-alcoholic fatty liver disease | ||
| Lung |  | AAH: Atypical adenomatous hyperplasia |
| AIS: Adenocarcinoma in situ | ||
| IAC: Invasive lung adenocarcinoma | ||
| MIA: Minimally invasive adenocarcinoma | ||
| Oral Cavity | 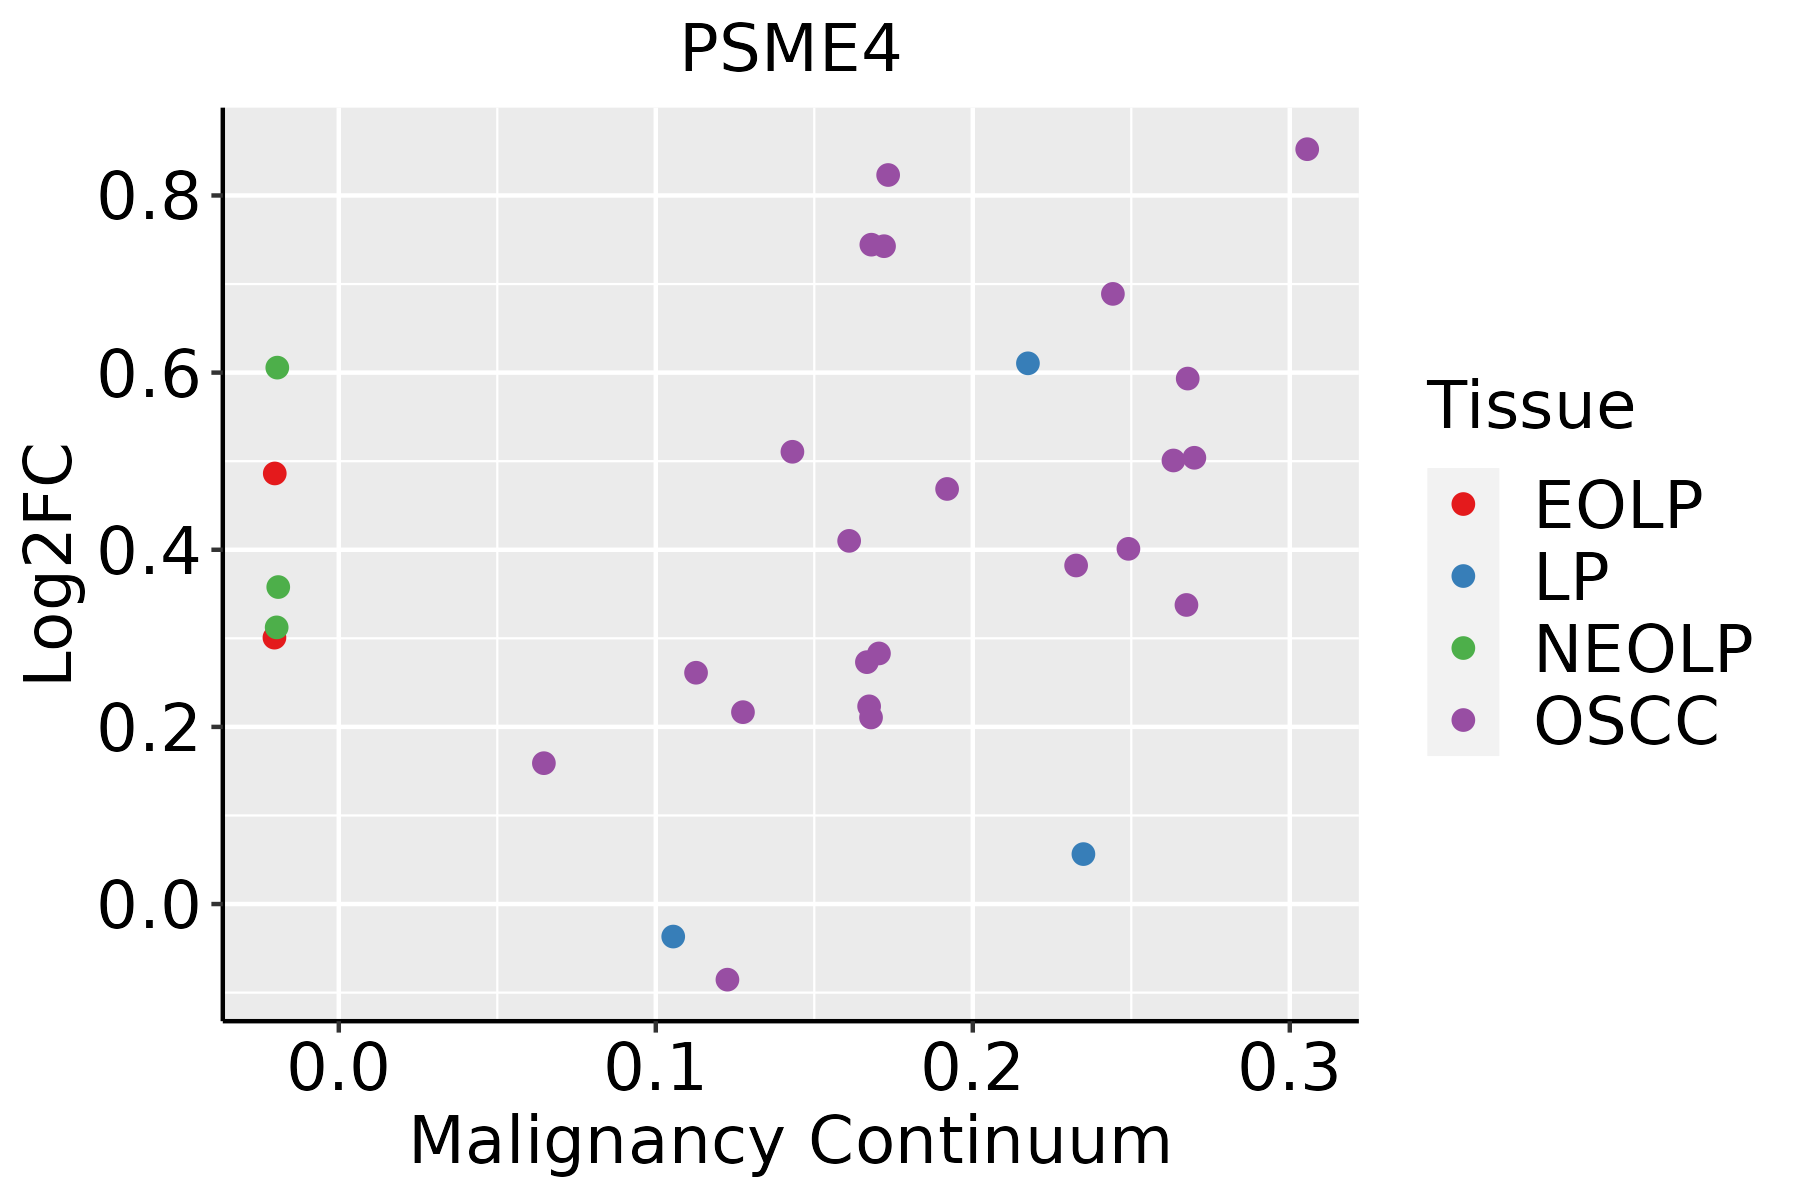 | EOLP: Erosive Oral lichen planus |
| LP: leukoplakia | ||
| NEOLP: Non-erosive oral lichen planus | ||
| OSCC: Oral squamous cell carcinoma | ||
| Prostate | 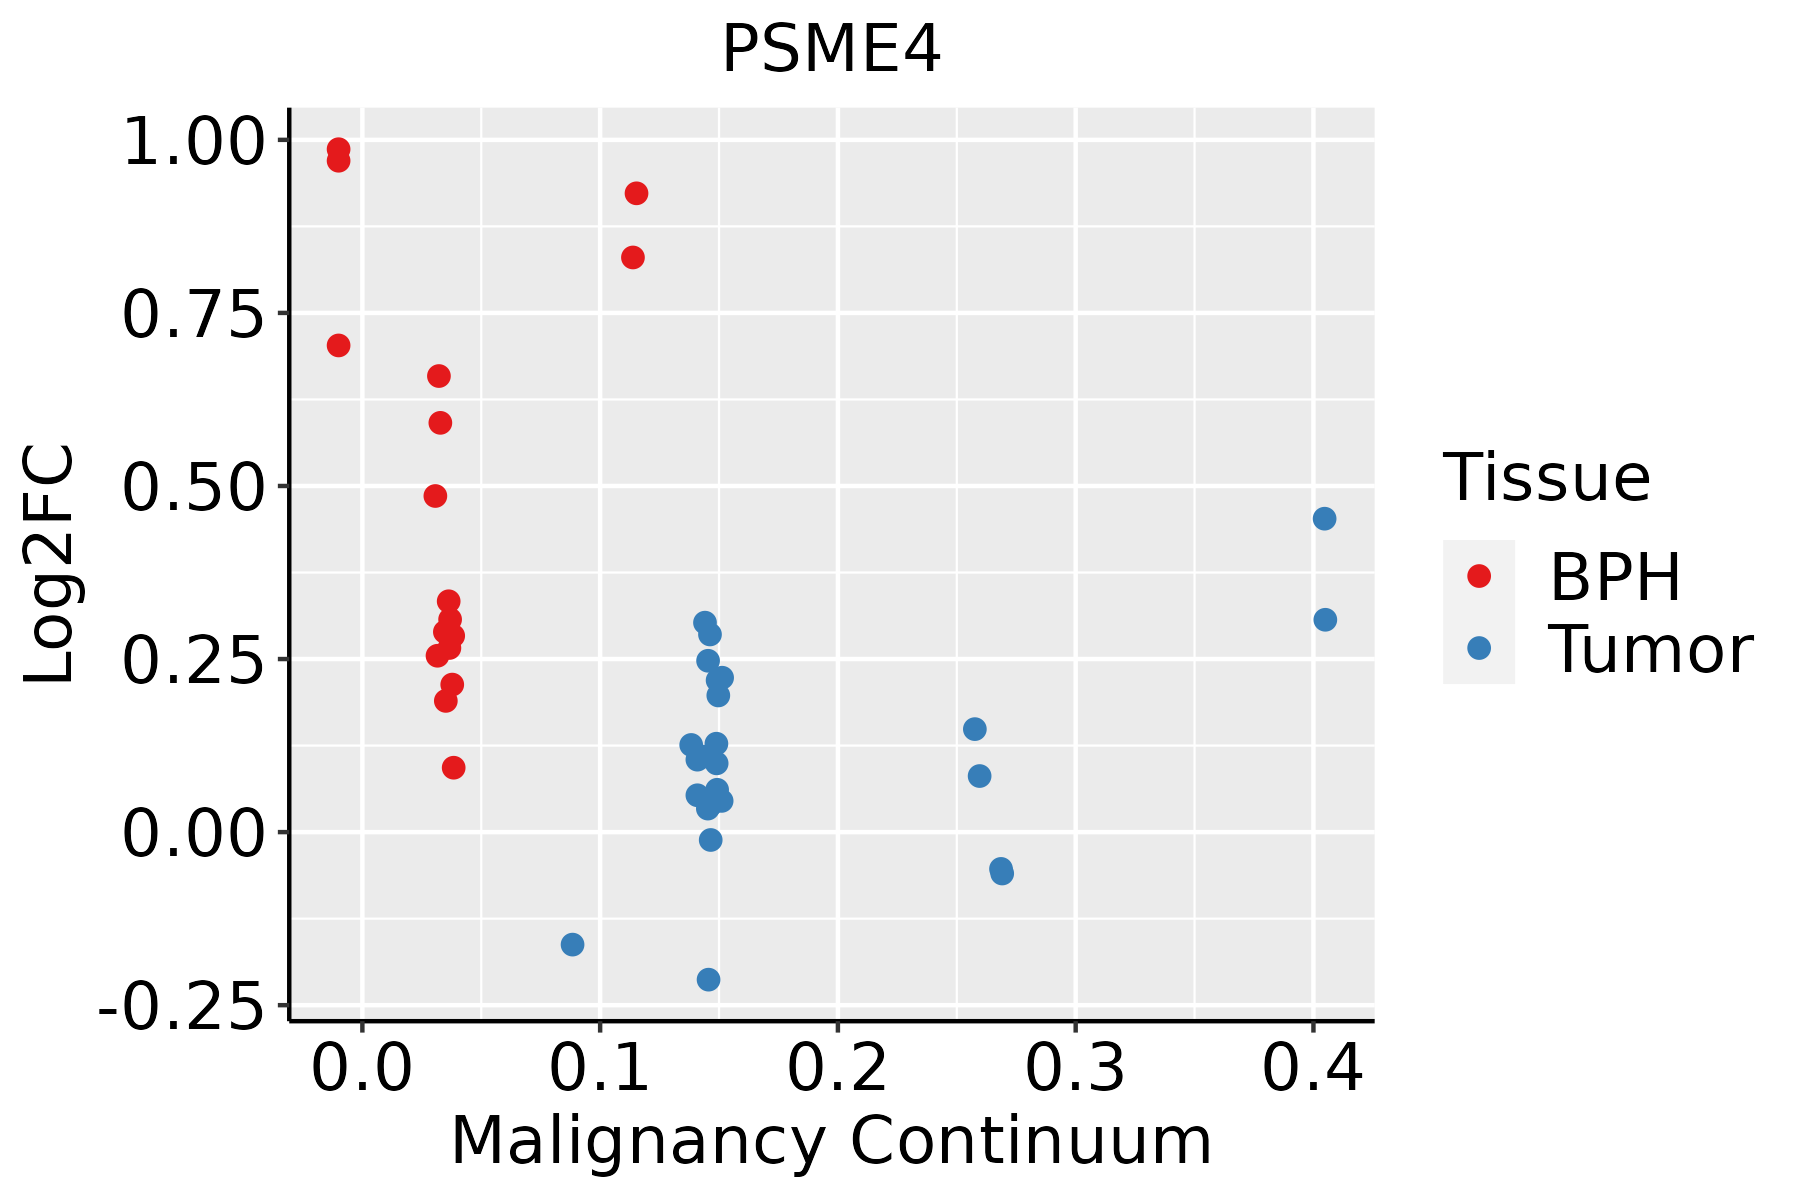 | BPH: Benign Prostatic Hyperplasia |
| Skin | 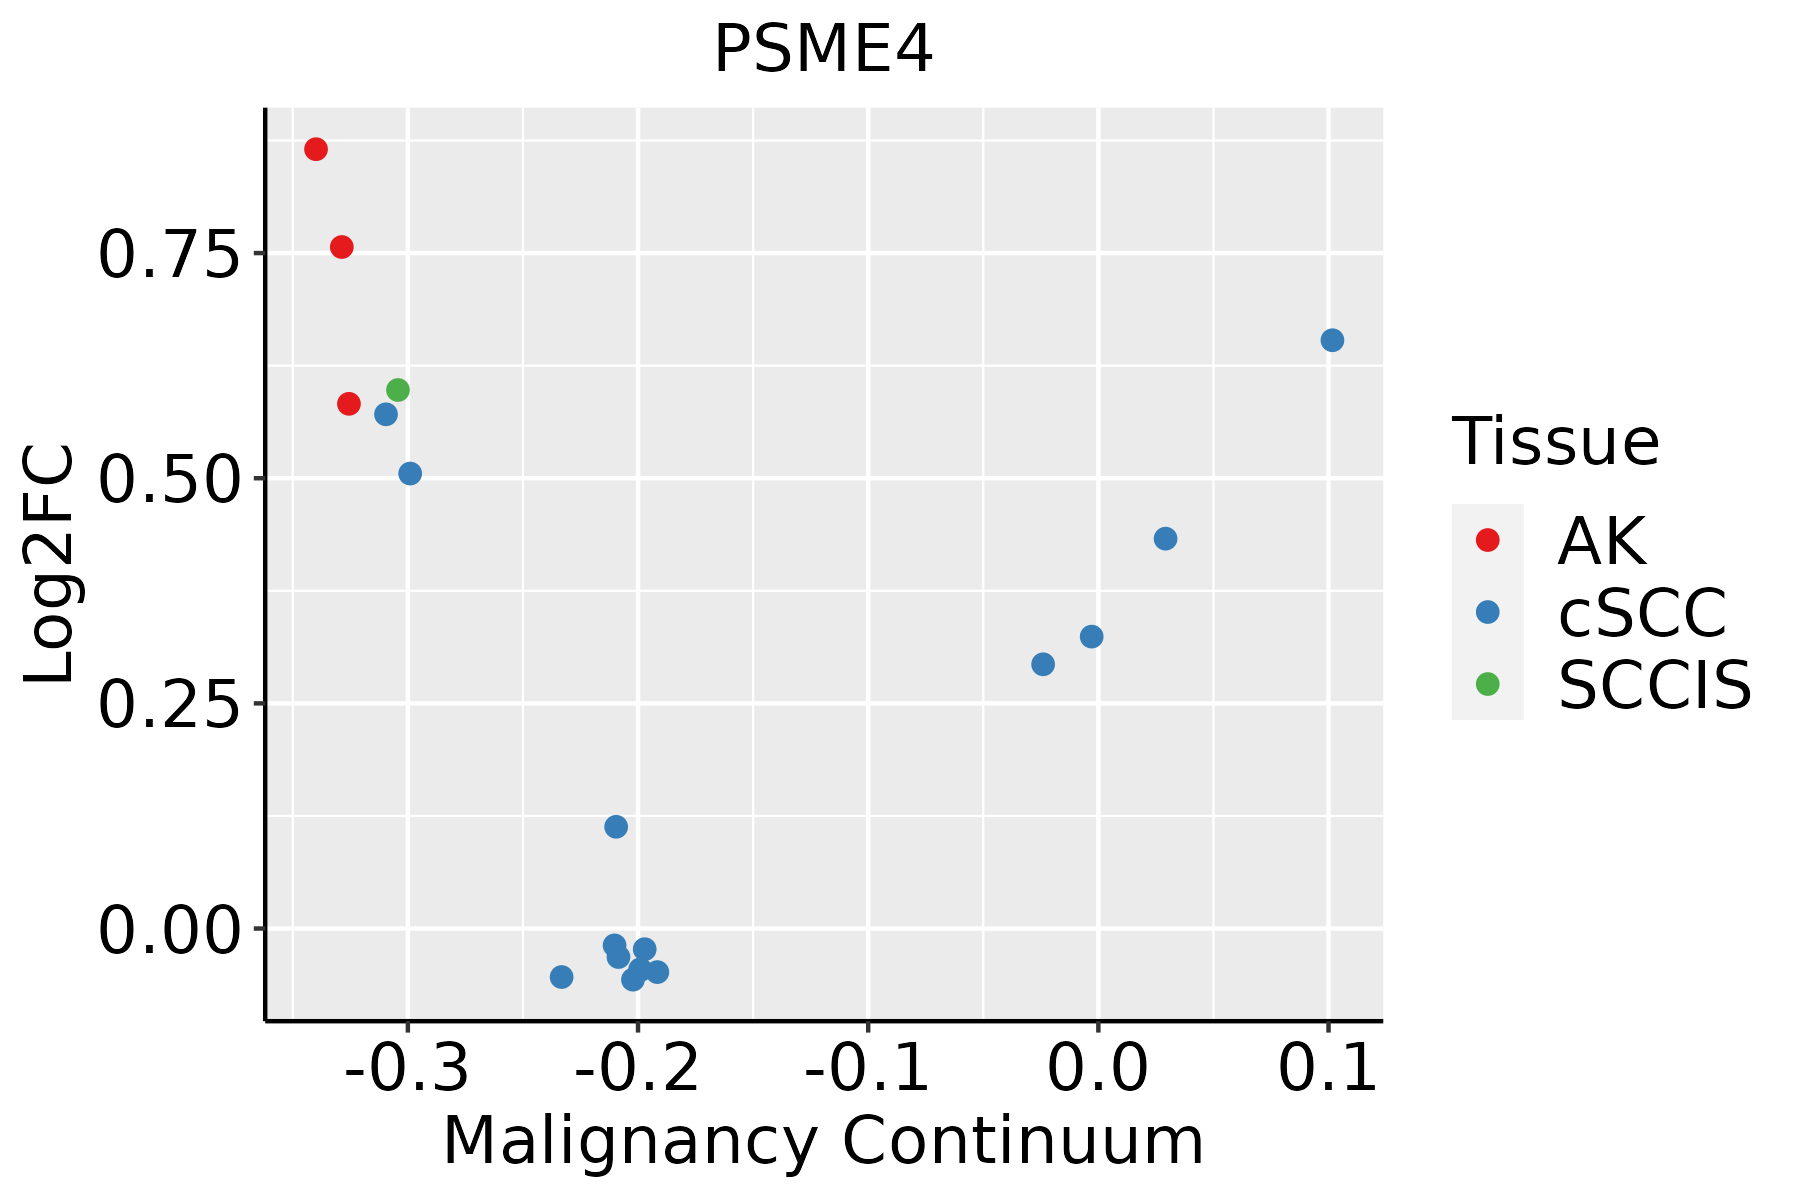 | AK: Actinic keratosis |
| cSCC: Cutaneous squamous cell carcinoma | ||
| SCCIS:squamous cell carcinoma in situ | ||
| Thyroid | 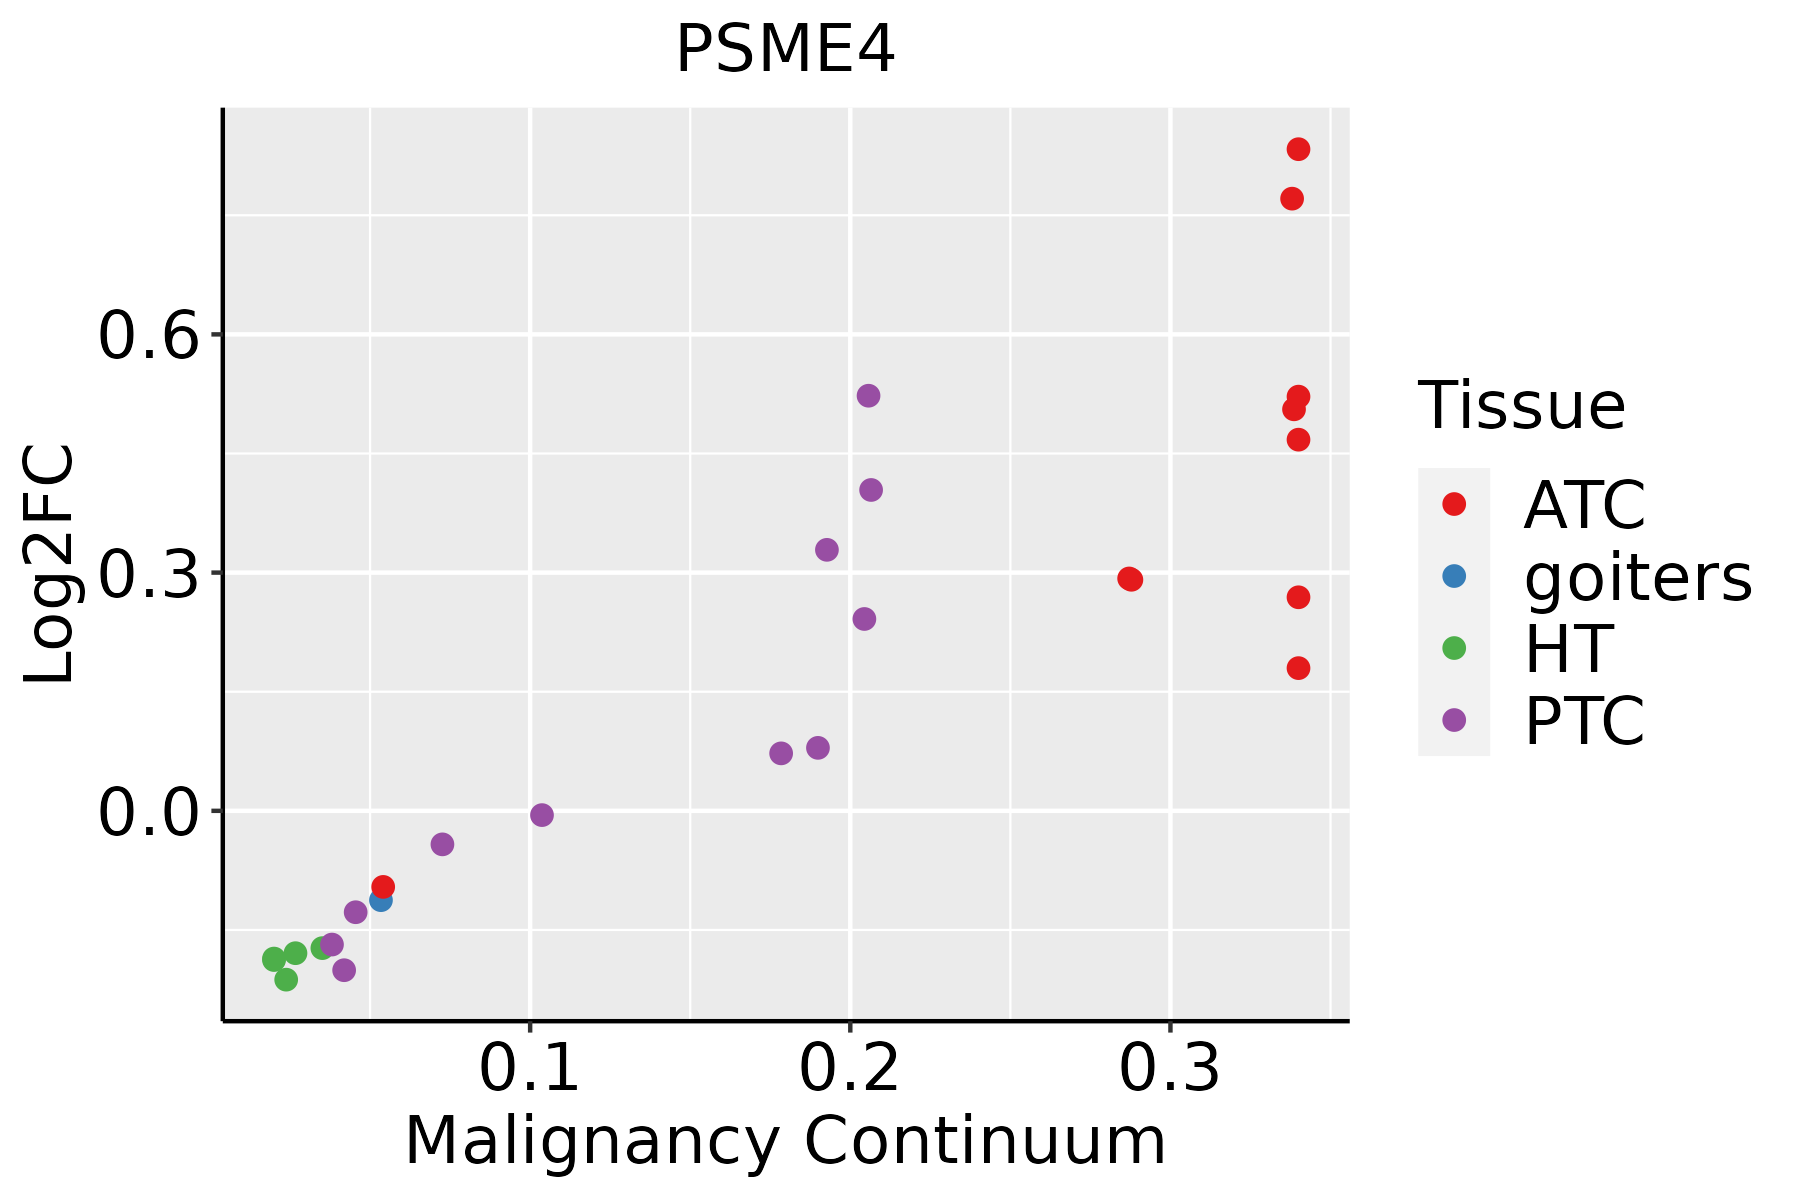 | ATC: Anaplastic thyroid cancer |
| HT: Hashimoto's thyroiditis | ||
| PTC: Papillary thyroid cancer |
| ∗log2FC in expression of this searched gene in stem-like cells from each diseased tissue sample relative to stem-like cells in normal samples in each tissue plotted against the malignancy continuum. Samples are colored based on if they are from different disease stage. |
Top |
Malignant transformation related pathway analysis |
| Find out the enriched GO biological processes and KEGG pathways involved in transition from healthy to precancer to cancer |
| Tissue | Disease Stage | Enriched GO biological Processes |
| Colorectum | AD |  |
| Colorectum | SER |  |
| Colorectum | MSS |  |
| Colorectum | MSI-H |  |
| Colorectum | FAP |  |
| ∗Top 15 enriched GO BP terms are showed in the bar plot of each disease state in each tissue. Each row represents a significant GO biological process which is colored according to the -log10(p.adjust). |
| Page: 1 2 3 4 5 6 7 8 9 |
| GO ID | Tissue | Disease Stage | Description | Gene Ratio | Bg Ratio | pvalue | p.adjust | Count |
| GO:005254710 | Cervix | CC | regulation of peptidase activity | 112/2311 | 461/18723 | 6.70e-13 | 3.08e-10 | 112 |
| GO:004586210 | Cervix | CC | positive regulation of proteolysis | 95/2311 | 372/18723 | 1.84e-12 | 6.86e-10 | 95 |
| GO:001049810 | Cervix | CC | proteasomal protein catabolic process | 111/2311 | 490/18723 | 8.98e-11 | 1.58e-08 | 111 |
| GO:001095210 | Cervix | CC | positive regulation of peptidase activity | 54/2311 | 197/18723 | 8.06e-09 | 6.99e-07 | 54 |
| GO:00063257 | Cervix | CC | chromatin organization | 78/2311 | 409/18723 | 5.40e-05 | 8.02e-04 | 78 |
| GO:00063381 | Cervix | CC | chromatin remodeling | 45/2311 | 255/18723 | 8.33e-03 | 4.30e-02 | 45 |
| GO:0010498 | Colorectum | AD | proteasomal protein catabolic process | 174/3918 | 490/18723 | 3.18e-14 | 7.66e-12 | 174 |
| GO:0045862 | Colorectum | AD | positive regulation of proteolysis | 129/3918 | 372/18723 | 4.04e-10 | 3.46e-08 | 129 |
| GO:0052547 | Colorectum | AD | regulation of peptidase activity | 137/3918 | 461/18723 | 4.12e-06 | 1.12e-04 | 137 |
| GO:0010952 | Colorectum | AD | positive regulation of peptidase activity | 68/3918 | 197/18723 | 6.30e-06 | 1.59e-04 | 68 |
| GO:0006325 | Colorectum | AD | chromatin organization | 119/3918 | 409/18723 | 4.85e-05 | 8.33e-04 | 119 |
| GO:0006338 | Colorectum | AD | chromatin remodeling | 70/3918 | 255/18723 | 7.44e-03 | 4.53e-02 | 70 |
| GO:00104984 | Colorectum | FAP | proteasomal protein catabolic process | 110/2622 | 490/18723 | 2.12e-07 | 1.26e-05 | 110 |
| GO:00458624 | Colorectum | FAP | positive regulation of proteolysis | 81/2622 | 372/18723 | 2.64e-05 | 6.08e-04 | 81 |
| GO:00063253 | Colorectum | FAP | chromatin organization | 84/2622 | 409/18723 | 1.62e-04 | 2.47e-03 | 84 |
| GO:00525474 | Colorectum | FAP | regulation of peptidase activity | 86/2622 | 461/18723 | 2.98e-03 | 2.27e-02 | 86 |
| GO:00109524 | Colorectum | FAP | positive regulation of peptidase activity | 41/2622 | 197/18723 | 5.49e-03 | 3.56e-02 | 41 |
| GO:00063254 | Colorectum | CRC | chromatin organization | 74/2078 | 409/18723 | 1.48e-05 | 4.61e-04 | 74 |
| GO:00458625 | Colorectum | CRC | positive regulation of proteolysis | 65/2078 | 372/18723 | 1.38e-04 | 2.58e-03 | 65 |
| GO:00104985 | Colorectum | CRC | proteasomal protein catabolic process | 77/2078 | 490/18723 | 1.03e-03 | 1.21e-02 | 77 |
| Page: 1 2 3 4 5 6 7 |
| Pathway ID | Tissue | Disease Stage | Description | Gene Ratio | Bg Ratio | pvalue | p.adjust | qvalue | Count |
| hsa0305014 | Cervix | CC | Proteasome | 16/1267 | 46/8465 | 6.69e-04 | 3.09e-03 | 1.83e-03 | 16 |
| hsa0305015 | Cervix | CC | Proteasome | 16/1267 | 46/8465 | 6.69e-04 | 3.09e-03 | 1.83e-03 | 16 |
| hsa03050 | Colorectum | AD | Proteasome | 29/2092 | 46/8465 | 3.87e-08 | 6.18e-07 | 3.94e-07 | 29 |
| hsa030501 | Colorectum | AD | Proteasome | 29/2092 | 46/8465 | 3.87e-08 | 6.18e-07 | 3.94e-07 | 29 |
| hsa0305016 | Endometrium | AEH | Proteasome | 22/1197 | 46/8465 | 4.46e-08 | 6.91e-07 | 5.06e-07 | 22 |
| hsa0305017 | Endometrium | AEH | Proteasome | 22/1197 | 46/8465 | 4.46e-08 | 6.91e-07 | 5.06e-07 | 22 |
| hsa0305024 | Endometrium | EEC | Proteasome | 23/1237 | 46/8465 | 1.41e-08 | 2.33e-07 | 1.73e-07 | 23 |
| hsa0305034 | Endometrium | EEC | Proteasome | 23/1237 | 46/8465 | 1.41e-08 | 2.33e-07 | 1.73e-07 | 23 |
| hsa0305027 | Esophagus | HGIN | Proteasome | 34/1383 | 46/8465 | 6.45e-18 | 1.91e-16 | 1.52e-16 | 34 |
| hsa03050111 | Esophagus | HGIN | Proteasome | 34/1383 | 46/8465 | 6.45e-18 | 1.91e-16 | 1.52e-16 | 34 |
| hsa030509 | Liver | Cirrhotic | Proteasome | 41/2530 | 46/8465 | 6.22e-17 | 2.30e-15 | 1.42e-15 | 41 |
| hsa0305012 | Liver | Cirrhotic | Proteasome | 41/2530 | 46/8465 | 6.22e-17 | 2.30e-15 | 1.42e-15 | 41 |
| hsa0305022 | Liver | HCC | Proteasome | 43/4020 | 46/8465 | 2.62e-11 | 4.61e-10 | 2.56e-10 | 43 |
| hsa0305032 | Liver | HCC | Proteasome | 43/4020 | 46/8465 | 2.62e-11 | 4.61e-10 | 2.56e-10 | 43 |
| hsa0305020 | Oral cavity | OSCC | Proteasome | 42/3704 | 46/8465 | 1.32e-11 | 2.01e-10 | 1.02e-10 | 42 |
| hsa03050110 | Oral cavity | OSCC | Proteasome | 42/3704 | 46/8465 | 1.32e-11 | 2.01e-10 | 1.02e-10 | 42 |
| hsa0305018 | Prostate | BPH | Proteasome | 28/1718 | 46/8465 | 2.01e-09 | 2.89e-08 | 1.79e-08 | 28 |
| hsa0305019 | Prostate | BPH | Proteasome | 28/1718 | 46/8465 | 2.01e-09 | 2.89e-08 | 1.79e-08 | 28 |
| hsa0305025 | Prostate | Tumor | Proteasome | 28/1791 | 46/8465 | 5.40e-09 | 7.77e-08 | 4.82e-08 | 28 |
| hsa0305035 | Prostate | Tumor | Proteasome | 28/1791 | 46/8465 | 5.40e-09 | 7.77e-08 | 4.82e-08 | 28 |
| Page: 1 |
Top |
Cell-cell communication analysis |
| Identification of potential cell-cell interactions between two cell types and their ligand-receptor pairs for different disease states |
| Ligand | Receptor | LRpair | Pathway | Tissue | Disease Stage |
| Page: 1 |
Top |
Single-cell gene regulatory network inference analysis |
| Find out the significant the regulons (TFs) and the target genes of each regulon across cell types for different disease states |
| TF | Cell Type | Tissue | Disease Stage | Target Gene | RSS | Regulon Activity |
| ∗The dot plots of a searched regulon are shown for all cell subpopulations in each disease state of each tissue based on the regulon specific score inferred using pySCENIC and by calculating the average expression. |
| Page: 1 |
Top |
Somatic mutation of malignant transformation related genes |
| Annotation of somatic variants for genes involved in malignant transformation |
| Hugo Symbol | Variant Class | Variant Classification | dbSNP RS | HGVSc | HGVSp | HGVSp Short | SWISSPROT | BIOTYPE | SIFT | PolyPhen | Tumor Sample Barcode | Tissue | Histology | Sex | Age | Stage | Therapy Types | Drugs | Outcome |
| PSME4 | SNV | Missense_Mutation | novel | c.1702G>A | p.Glu568Lys | p.E568K | Q14997 | protein_coding | tolerated(0.53) | benign(0.05) | TCGA-3C-AALI-01 | Breast | breast invasive carcinoma | Female | <65 | I/II | Unspecific | Poly E | Complete Response |
| PSME4 | SNV | Missense_Mutation | novel | c.277G>C | p.Glu93Gln | p.E93Q | Q14997 | protein_coding | tolerated(0.08) | possibly_damaging(0.53) | TCGA-3C-AALI-01 | Breast | breast invasive carcinoma | Female | <65 | I/II | Unspecific | Poly E | Complete Response |
| PSME4 | SNV | Missense_Mutation | novel | c.1150G>C | p.Asp384His | p.D384H | Q14997 | protein_coding | deleterious(0.01) | benign(0.399) | TCGA-AR-A2LE-01 | Breast | breast invasive carcinoma | Female | >=65 | I/II | Hormone Therapy | tamoxiphen | PD |
| PSME4 | SNV | Missense_Mutation | c.604N>T | p.Pro202Ser | p.P202S | Q14997 | protein_coding | deleterious(0.01) | probably_damaging(0.921) | TCGA-BH-A0HF-01 | Breast | breast invasive carcinoma | Female | >=65 | I/II | Hormone Therapy | arimidex | SD | |
| PSME4 | SNV | Missense_Mutation | c.1585C>A | p.Leu529Ile | p.L529I | Q14997 | protein_coding | tolerated(0.06) | benign(0.17) | TCGA-BH-A18G-01 | Breast | breast invasive carcinoma | Female | >=65 | I/II | Unknown | Unknown | SD | |
| PSME4 | SNV | Missense_Mutation | c.281N>T | p.Asp94Val | p.D94V | Q14997 | protein_coding | deleterious(0) | probably_damaging(0.997) | TCGA-BH-A1FJ-01 | Breast | breast invasive carcinoma | Female | >=65 | III/IV | Unknown | Unknown | SD | |
| PSME4 | insertion | Nonsense_Mutation | novel | c.3742_3743insATGCCAACTGGCACTAGTATGAAGG | p.Trp1248TyrfsTer6 | p.W1248Yfs*6 | Q14997 | protein_coding | TCGA-AR-A0U0-01 | Breast | breast invasive carcinoma | Female | >=65 | I/II | Unknown | Unknown | SD | ||
| PSME4 | SNV | Missense_Mutation | rs780472027 | c.1402G>A | p.Val468Ile | p.V468I | Q14997 | protein_coding | tolerated(0.06) | possibly_damaging(0.556) | TCGA-2W-A8YY-01 | Cervix | cervical & endocervical cancer | Female | <65 | I/II | Chemotherapy | cisplatin | CR |
| PSME4 | SNV | Missense_Mutation | c.1577N>T | p.Arg526Ile | p.R526I | Q14997 | protein_coding | tolerated(0.17) | benign(0.047) | TCGA-FU-A3HZ-01 | Cervix | cervical & endocervical cancer | Female | <65 | I/II | Chemotherapy | cisplatin | CR | |
| PSME4 | SNV | Missense_Mutation | c.3341C>G | p.Ser1114Cys | p.S1114C | Q14997 | protein_coding | tolerated(0.08) | benign(0.003) | TCGA-IR-A3LA-01 | Cervix | cervical & endocervical cancer | Female | <65 | I/II | Chemotherapy | cisplatin | CR |
| Page: 1 2 3 4 5 6 7 8 9 10 11 12 13 14 15 16 17 18 19 |
Top |
Related drugs of malignant transformation related genes |
| Identification of chemicals and drugs interact with genes involved in malignant transfromation |
| (DGIdb 4.0) |
| Entrez ID | Symbol | Category | Interaction Types | Drug Claim Name | Drug Name | PMIDs |
| 23198 | PSME4 | DNA REPAIR | inhibitor | BORTEZOMIB | BORTEZOMIB | |
| 23198 | PSME4 | DNA REPAIR | inhibitor | CARFILZOMIB | CARFILZOMIB |
| Page: 1 |

Copyright 2023-Present -The University of Texas Health Science Center at Houston |