
|
|||||
|
 | |
| |
| |
| |
| |
| |
|
Gene: PSME3IP1 |
Gene summary for PSME3IP1 |
| Gene information | Species | Human | Gene symbol | PSME3IP1 | Gene ID | 80011 |
| Gene name | proteasome activator subunit 3 interacting protein 1 | |
| Gene Alias | C16orf94 | |
| Cytomap | 16q13 | |
| Gene Type | protein-coding | GO ID | GO:0006508 | UniProtAcc | A0A024R6T8 |
Top |
Malignant transformation analysis |
| Identification of the aberrant gene expression in precancerous and cancerous lesions by comparing the gene expression of stem-like cells in diseased tissues with normal stem cells |
| Entrez ID | Symbol | Replicates | Species | Organ | Tissue | Adj P-value | Log2FC | Malignancy |
| 80011 | PSME3IP1 | HTA11_3410_2000001011 | Human | Colorectum | AD | 1.41e-17 | 3.11e-01 | 0.0155 |
| 80011 | PSME3IP1 | HTA11_2487_2000001011 | Human | Colorectum | SER | 6.14e-31 | 6.98e-01 | -0.1808 |
| 80011 | PSME3IP1 | HTA11_2951_2000001011 | Human | Colorectum | AD | 3.03e-06 | 3.89e-01 | 0.0216 |
| 80011 | PSME3IP1 | HTA11_1938_2000001011 | Human | Colorectum | AD | 2.16e-29 | 7.79e-01 | -0.0811 |
| 80011 | PSME3IP1 | HTA11_78_2000001011 | Human | Colorectum | AD | 4.08e-19 | 5.39e-01 | -0.1088 |
| 80011 | PSME3IP1 | HTA11_347_2000001011 | Human | Colorectum | AD | 7.43e-62 | 1.00e+00 | -0.1954 |
| 80011 | PSME3IP1 | HTA11_411_2000001011 | Human | Colorectum | SER | 3.33e-15 | 8.79e-01 | -0.2602 |
| 80011 | PSME3IP1 | HTA11_2112_2000001011 | Human | Colorectum | SER | 5.26e-10 | 6.35e-01 | -0.2196 |
| 80011 | PSME3IP1 | HTA11_3361_2000001011 | Human | Colorectum | AD | 1.93e-12 | 4.09e-01 | -0.1207 |
| 80011 | PSME3IP1 | HTA11_83_2000001011 | Human | Colorectum | SER | 1.40e-25 | 6.56e-01 | -0.1526 |
| 80011 | PSME3IP1 | HTA11_696_2000001011 | Human | Colorectum | AD | 4.51e-40 | 7.24e-01 | -0.1464 |
| 80011 | PSME3IP1 | HTA11_866_2000001011 | Human | Colorectum | AD | 5.44e-33 | 5.68e-01 | -0.1001 |
| 80011 | PSME3IP1 | HTA11_1391_2000001011 | Human | Colorectum | AD | 6.10e-28 | 6.89e-01 | -0.059 |
| 80011 | PSME3IP1 | HTA11_2992_2000001011 | Human | Colorectum | SER | 2.31e-08 | 4.44e-01 | -0.1706 |
| 80011 | PSME3IP1 | HTA11_5212_2000001011 | Human | Colorectum | AD | 1.21e-08 | 4.78e-01 | -0.2061 |
| 80011 | PSME3IP1 | HTA11_5216_2000001011 | Human | Colorectum | SER | 3.22e-05 | 4.66e-01 | -0.1462 |
| 80011 | PSME3IP1 | HTA11_546_2000001011 | Human | Colorectum | AD | 3.21e-19 | 5.79e-01 | -0.0842 |
| 80011 | PSME3IP1 | HTA11_9341_2000001011 | Human | Colorectum | SER | 2.78e-05 | 4.03e-01 | -0.00410000000000005 |
| 80011 | PSME3IP1 | HTA11_7862_2000001011 | Human | Colorectum | AD | 7.27e-11 | 4.52e-01 | -0.0179 |
| 80011 | PSME3IP1 | HTA11_866_3004761011 | Human | Colorectum | AD | 1.22e-19 | 4.25e-01 | 0.096 |
| Page: 1 2 |
| Tissue | Expression Dynamics | Abbreviation |
| Colorectum (GSE201348) |  | FAP: Familial adenomatous polyposis |
| CRC: Colorectal cancer | ||
| Colorectum (HTA11) | 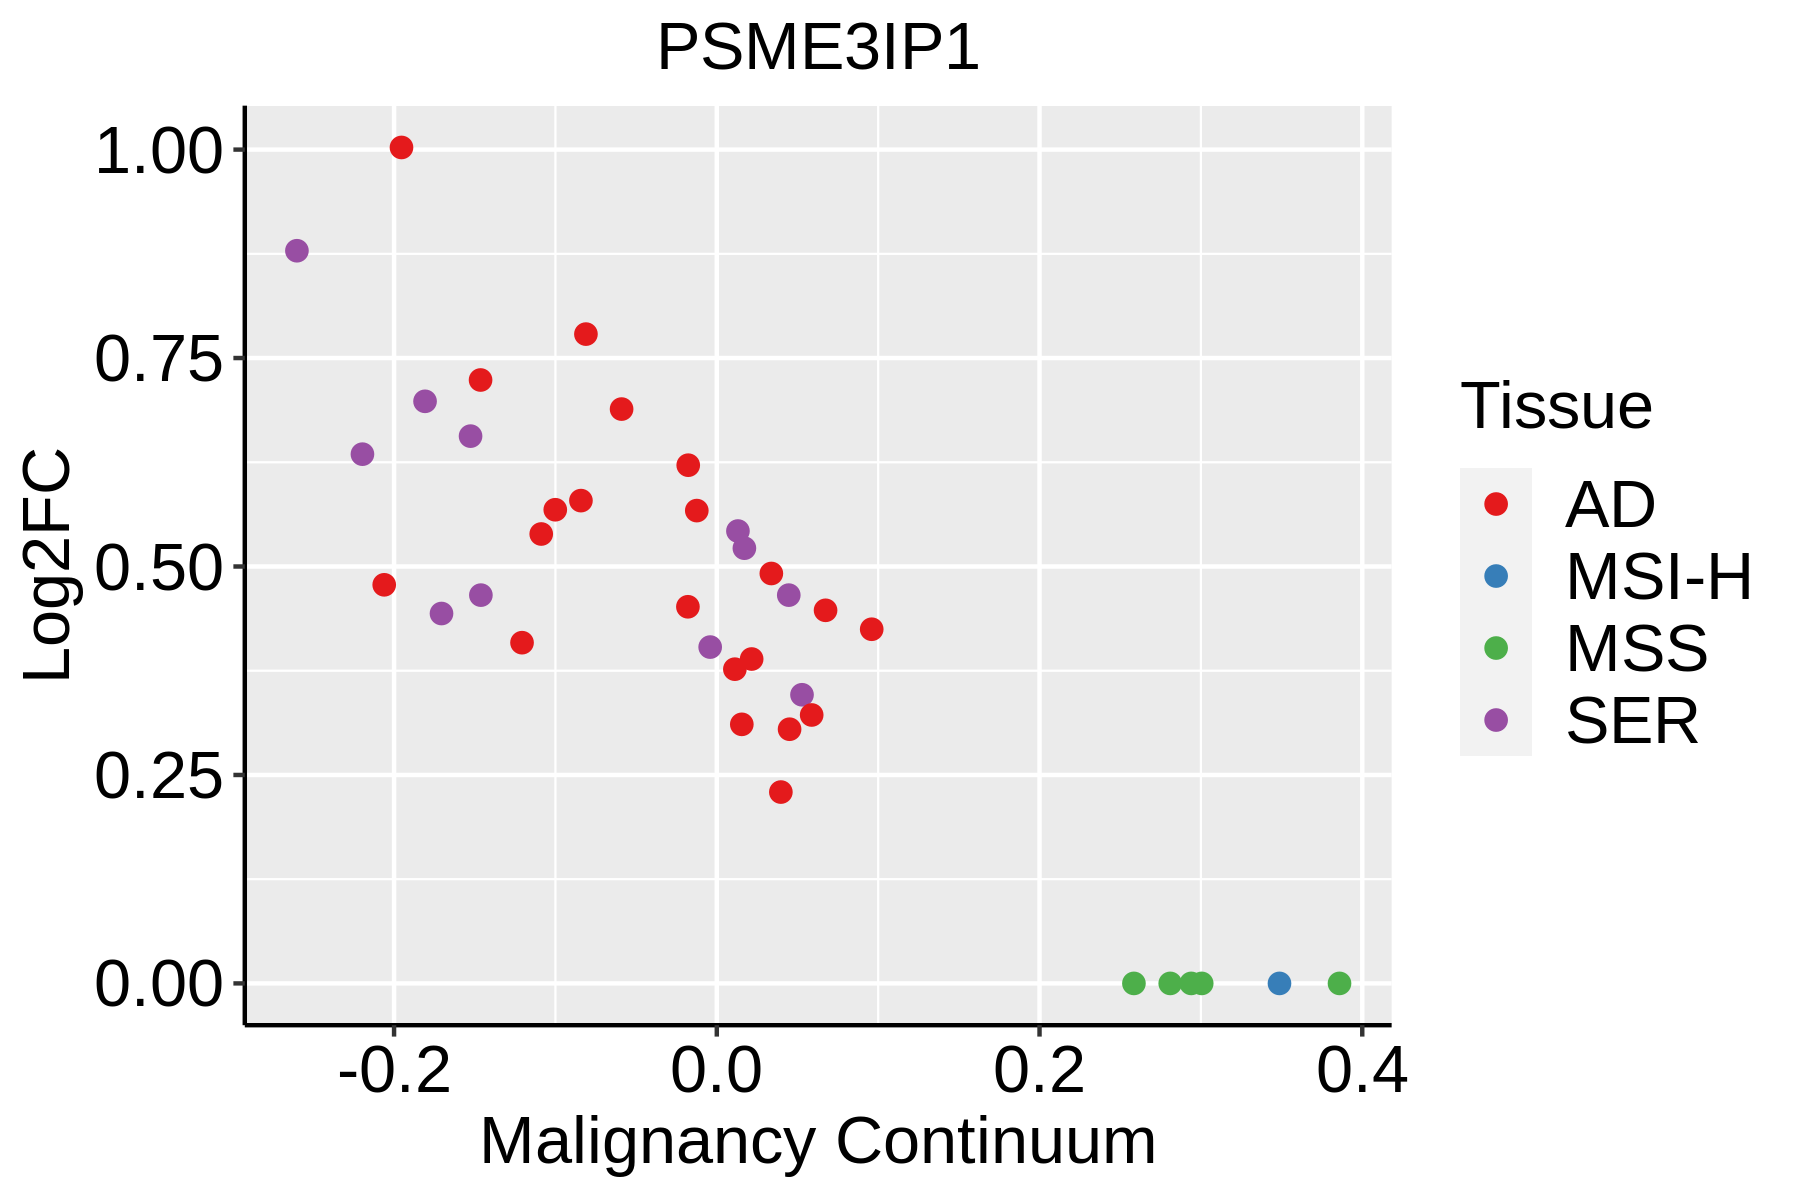 | AD: Adenomas |
| SER: Sessile serrated lesions | ||
| MSI-H: Microsatellite-high colorectal cancer | ||
| MSS: Microsatellite stable colorectal cancer |
| ∗log2FC in expression of this searched gene in stem-like cells from each diseased tissue sample relative to stem-like cells in normal samples in each tissue plotted against the malignancy continuum. Samples are colored based on if they are from different disease stage. |
Top |
Malignant transformation related pathway analysis |
| Find out the enriched GO biological processes and KEGG pathways involved in transition from healthy to precancer to cancer |
| Tissue | Disease Stage | Enriched GO biological Processes |
| Colorectum | AD |  |
| Colorectum | SER |  |
| Colorectum | MSS |  |
| Colorectum | MSI-H |  |
| Colorectum | FAP |  |
| ∗Top 15 enriched GO BP terms are showed in the bar plot of each disease state in each tissue. Each row represents a significant GO biological process which is colored according to the -log10(p.adjust). |
| Page: 1 2 3 4 5 6 7 8 9 |
| GO ID | Tissue | Disease Stage | Description | Gene Ratio | Bg Ratio | pvalue | p.adjust | Count |
| GO:0042176 | Colorectum | AD | regulation of protein catabolic process | 160/3918 | 391/18723 | 1.06e-19 | 7.34e-17 | 160 |
| GO:1903362 | Colorectum | AD | regulation of cellular protein catabolic process | 109/3918 | 255/18723 | 2.14e-15 | 6.08e-13 | 109 |
| GO:0010498 | Colorectum | AD | proteasomal protein catabolic process | 174/3918 | 490/18723 | 3.18e-14 | 7.66e-12 | 174 |
| GO:0009895 | Colorectum | AD | negative regulation of catabolic process | 124/3918 | 320/18723 | 1.66e-13 | 3.35e-11 | 124 |
| GO:1903050 | Colorectum | AD | regulation of proteolysis involved in cellular protein catabolic process | 92/3918 | 221/18723 | 2.04e-12 | 3.19e-10 | 92 |
| GO:0031330 | Colorectum | AD | negative regulation of cellular catabolic process | 104/3918 | 262/18723 | 2.66e-12 | 3.96e-10 | 104 |
| GO:0051098 | Colorectum | AD | regulation of binding | 126/3918 | 363/18723 | 6.01e-10 | 4.88e-08 | 126 |
| GO:0042177 | Colorectum | AD | negative regulation of protein catabolic process | 55/3918 | 121/18723 | 1.19e-09 | 8.85e-08 | 55 |
| GO:0061136 | Colorectum | AD | regulation of proteasomal protein catabolic process | 75/3918 | 187/18723 | 1.65e-09 | 1.20e-07 | 75 |
| GO:1903363 | Colorectum | AD | negative regulation of cellular protein catabolic process | 39/3918 | 75/18723 | 2.69e-09 | 1.87e-07 | 39 |
| GO:1903051 | Colorectum | AD | negative regulation of proteolysis involved in cellular protein catabolic process | 31/3918 | 64/18723 | 8.71e-07 | 2.98e-05 | 31 |
| GO:0043393 | Colorectum | AD | regulation of protein binding | 68/3918 | 196/18723 | 5.17e-06 | 1.34e-04 | 68 |
| GO:0045861 | Colorectum | AD | negative regulation of proteolysis | 106/3918 | 351/18723 | 2.33e-05 | 4.57e-04 | 106 |
| GO:1901799 | Colorectum | AD | negative regulation of proteasomal protein catabolic process | 23/3918 | 49/18723 | 4.18e-05 | 7.37e-04 | 23 |
| GO:0051100 | Colorectum | AD | negative regulation of binding | 50/3918 | 162/18723 | 1.84e-03 | 1.51e-02 | 50 |
| GO:0032091 | Colorectum | AD | negative regulation of protein binding | 30/3918 | 94/18723 | 8.26e-03 | 4.85e-02 | 30 |
| GO:00421761 | Colorectum | SER | regulation of protein catabolic process | 126/2897 | 391/18723 | 5.33e-17 | 2.52e-14 | 126 |
| GO:19033621 | Colorectum | SER | regulation of cellular protein catabolic process | 91/2897 | 255/18723 | 1.22e-15 | 5.36e-13 | 91 |
| GO:19030501 | Colorectum | SER | regulation of proteolysis involved in cellular protein catabolic process | 77/2897 | 221/18723 | 7.85e-13 | 2.00e-10 | 77 |
| GO:00104981 | Colorectum | SER | proteasomal protein catabolic process | 132/2897 | 490/18723 | 3.08e-11 | 5.55e-09 | 132 |
| Page: 1 2 |
| Pathway ID | Tissue | Disease Stage | Description | Gene Ratio | Bg Ratio | pvalue | p.adjust | qvalue | Count |
| Page: 1 |
Top |
Cell-cell communication analysis |
| Identification of potential cell-cell interactions between two cell types and their ligand-receptor pairs for different disease states |
| Ligand | Receptor | LRpair | Pathway | Tissue | Disease Stage |
| Page: 1 |
Top |
Single-cell gene regulatory network inference analysis |
| Find out the significant the regulons (TFs) and the target genes of each regulon across cell types for different disease states |
| TF | Cell Type | Tissue | Disease Stage | Target Gene | RSS | Regulon Activity |
| ∗The dot plots of a searched regulon are shown for all cell subpopulations in each disease state of each tissue based on the regulon specific score inferred using pySCENIC and by calculating the average expression. |
| Page: 1 |
Top |
Somatic mutation of malignant transformation related genes |
| Annotation of somatic variants for genes involved in malignant transformation |
| Hugo Symbol | Variant Class | Variant Classification | dbSNP RS | HGVSc | HGVSp | HGVSp Short | SWISSPROT | BIOTYPE | SIFT | PolyPhen | Tumor Sample Barcode | Tissue | Histology | Sex | Age | Stage | Therapy Types | Drugs | Outcome |
| Page: 1 |
Top |
Related drugs of malignant transformation related genes |
| Identification of chemicals and drugs interact with genes involved in malignant transfromation |
| (DGIdb 4.0) |
| Entrez ID | Symbol | Category | Interaction Types | Drug Claim Name | Drug Name | PMIDs |
| Page: 1 |

Copyright 2023-Present -The University of Texas Health Science Center at Houston |