
|
|||||
|
 | |
| |
| |
| |
| |
| |
|
Gene: PSME3 |
Gene summary for PSME3 |
| Gene information | Species | Human | Gene symbol | PSME3 | Gene ID | 10197 |
| Gene name | proteasome activator subunit 3 | |
| Gene Alias | HEL-S-283 | |
| Cytomap | 17q21.31 | |
| Gene Type | protein-coding | GO ID | GO:0000082 | UniProtAcc | A0A024R203 |
Top |
Malignant transformation analysis |
| Identification of the aberrant gene expression in precancerous and cancerous lesions by comparing the gene expression of stem-like cells in diseased tissues with normal stem cells |
| Entrez ID | Symbol | Replicates | Species | Organ | Tissue | Adj P-value | Log2FC | Malignancy |
| 10197 | PSME3 | HTA11_1938_2000001011 | Human | Colorectum | AD | 4.88e-04 | 3.65e-01 | -0.0811 |
| 10197 | PSME3 | HTA11_347_2000001011 | Human | Colorectum | AD | 6.98e-10 | 3.50e-01 | -0.1954 |
| 10197 | PSME3 | HTA11_83_2000001011 | Human | Colorectum | SER | 2.35e-02 | 3.54e-01 | -0.1526 |
| 10197 | PSME3 | HTA11_1391_2000001011 | Human | Colorectum | AD | 7.54e-05 | 3.66e-01 | -0.059 |
| 10197 | PSME3 | HTA11_2992_2000001011 | Human | Colorectum | SER | 7.66e-05 | 5.28e-01 | -0.1706 |
| 10197 | PSME3 | HTA11_6801_2000001011 | Human | Colorectum | SER | 4.85e-05 | 5.45e-01 | 0.0171 |
| 10197 | PSME3 | HTA11_7696_3000711011 | Human | Colorectum | AD | 1.94e-02 | 2.23e-01 | 0.0674 |
| 10197 | PSME3 | HTA11_7469_2000001011 | Human | Colorectum | AD | 4.74e-05 | 5.26e-01 | -0.0124 |
| 10197 | PSME3 | HTA11_99999970781_79442 | Human | Colorectum | MSS | 1.17e-04 | 3.02e-01 | 0.294 |
| 10197 | PSME3 | HTA11_99999965062_69753 | Human | Colorectum | MSI-H | 1.09e-02 | 8.11e-01 | 0.3487 |
| 10197 | PSME3 | HTA11_99999965104_69814 | Human | Colorectum | MSS | 7.90e-16 | 6.58e-01 | 0.281 |
| 10197 | PSME3 | HTA11_99999971662_82457 | Human | Colorectum | MSS | 5.96e-21 | 6.35e-01 | 0.3859 |
| 10197 | PSME3 | LZE4T | Human | Esophagus | ESCC | 2.15e-13 | 3.71e-01 | 0.0811 |
| 10197 | PSME3 | LZE7T | Human | Esophagus | ESCC | 5.33e-06 | 5.75e-01 | 0.0667 |
| 10197 | PSME3 | LZE8T | Human | Esophagus | ESCC | 7.36e-06 | 2.44e-01 | 0.067 |
| 10197 | PSME3 | LZE20T | Human | Esophagus | ESCC | 7.35e-07 | 7.22e-02 | 0.0662 |
| 10197 | PSME3 | LZE22T | Human | Esophagus | ESCC | 9.00e-04 | 2.67e-01 | 0.068 |
| 10197 | PSME3 | LZE24T | Human | Esophagus | ESCC | 5.12e-25 | 6.60e-01 | 0.0596 |
| 10197 | PSME3 | LZE21T | Human | Esophagus | ESCC | 5.02e-06 | 2.90e-01 | 0.0655 |
| 10197 | PSME3 | LZE6T | Human | Esophagus | ESCC | 5.39e-06 | 3.30e-01 | 0.0845 |
| Page: 1 2 3 4 5 6 |
| Tissue | Expression Dynamics | Abbreviation |
| Colorectum (GSE201348) |  | FAP: Familial adenomatous polyposis |
| CRC: Colorectal cancer | ||
| Colorectum (HTA11) |  | AD: Adenomas |
| SER: Sessile serrated lesions | ||
| MSI-H: Microsatellite-high colorectal cancer | ||
| MSS: Microsatellite stable colorectal cancer | ||
| Esophagus | 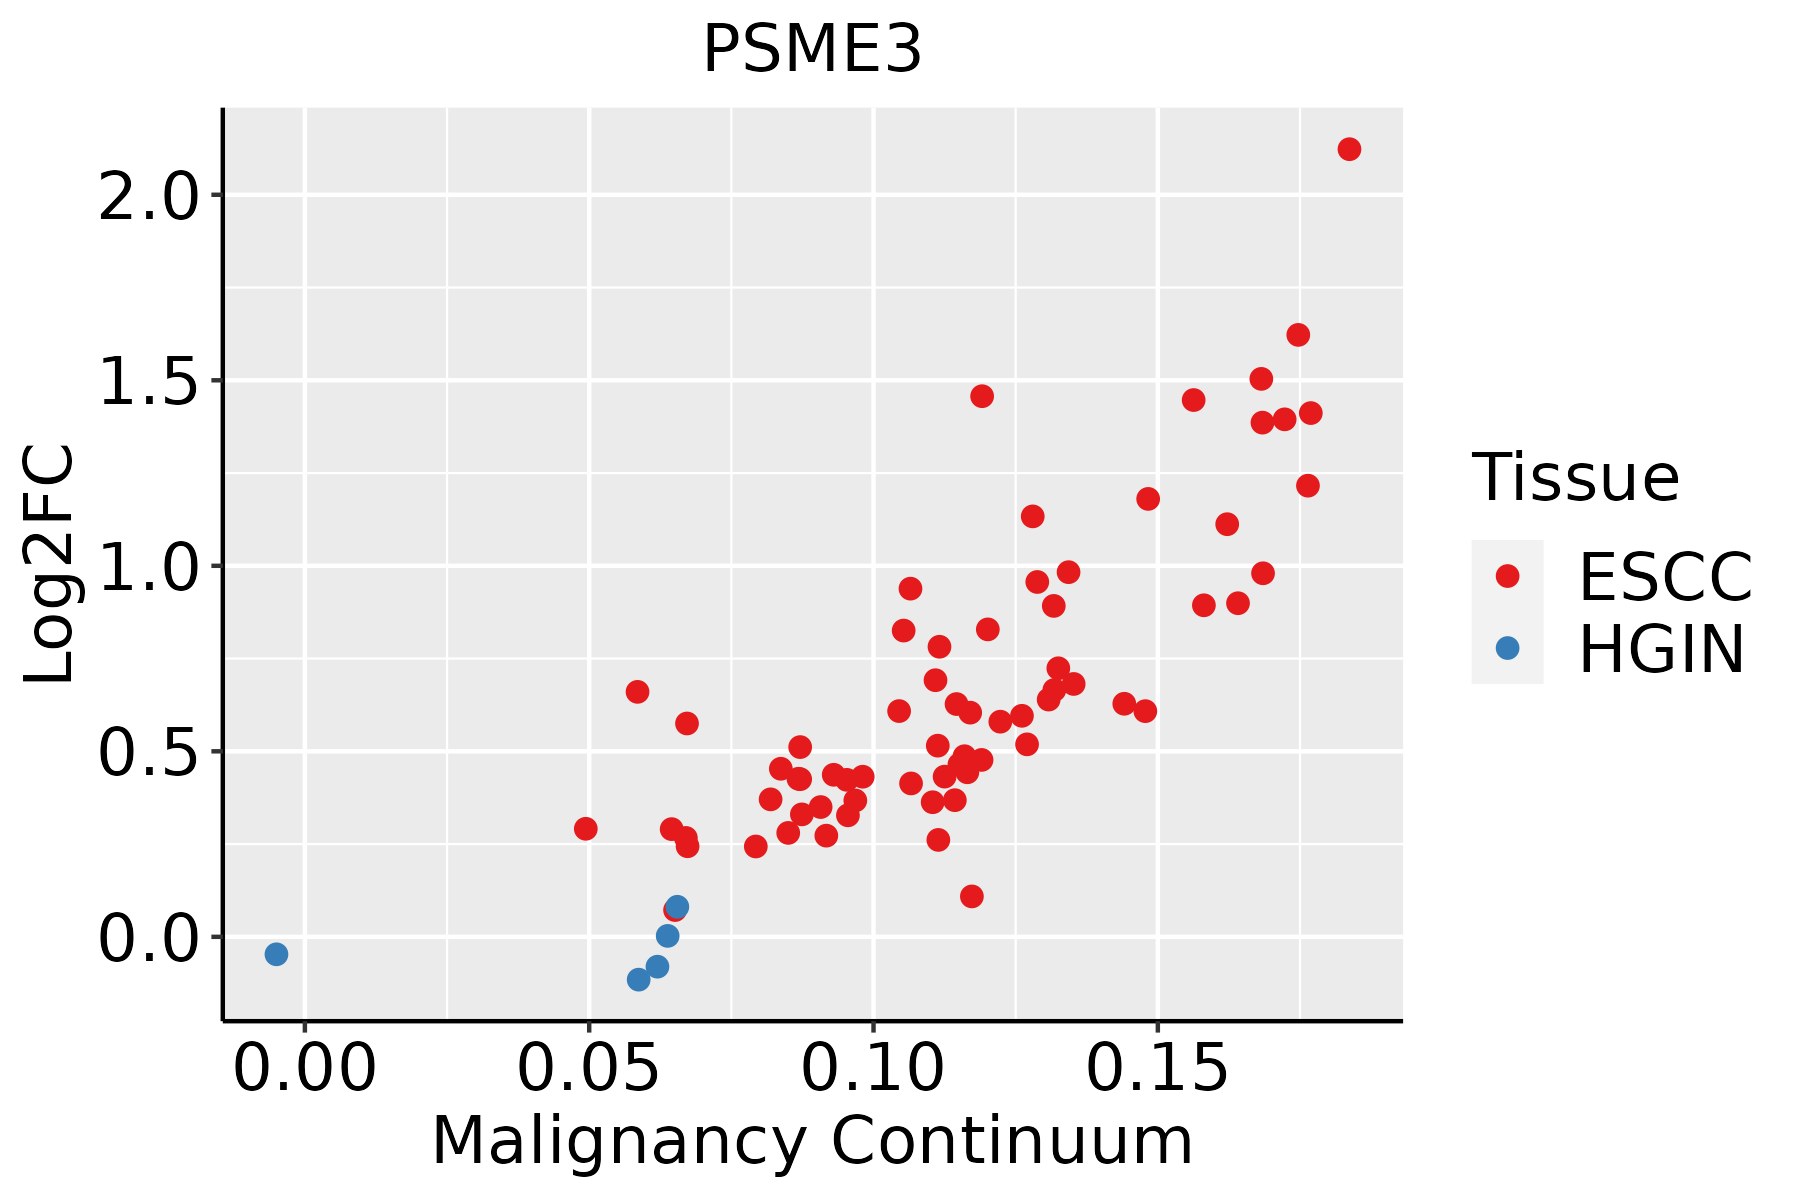 | ESCC: Esophageal squamous cell carcinoma |
| HGIN: High-grade intraepithelial neoplasias | ||
| LGIN: Low-grade intraepithelial neoplasias | ||
| Liver | 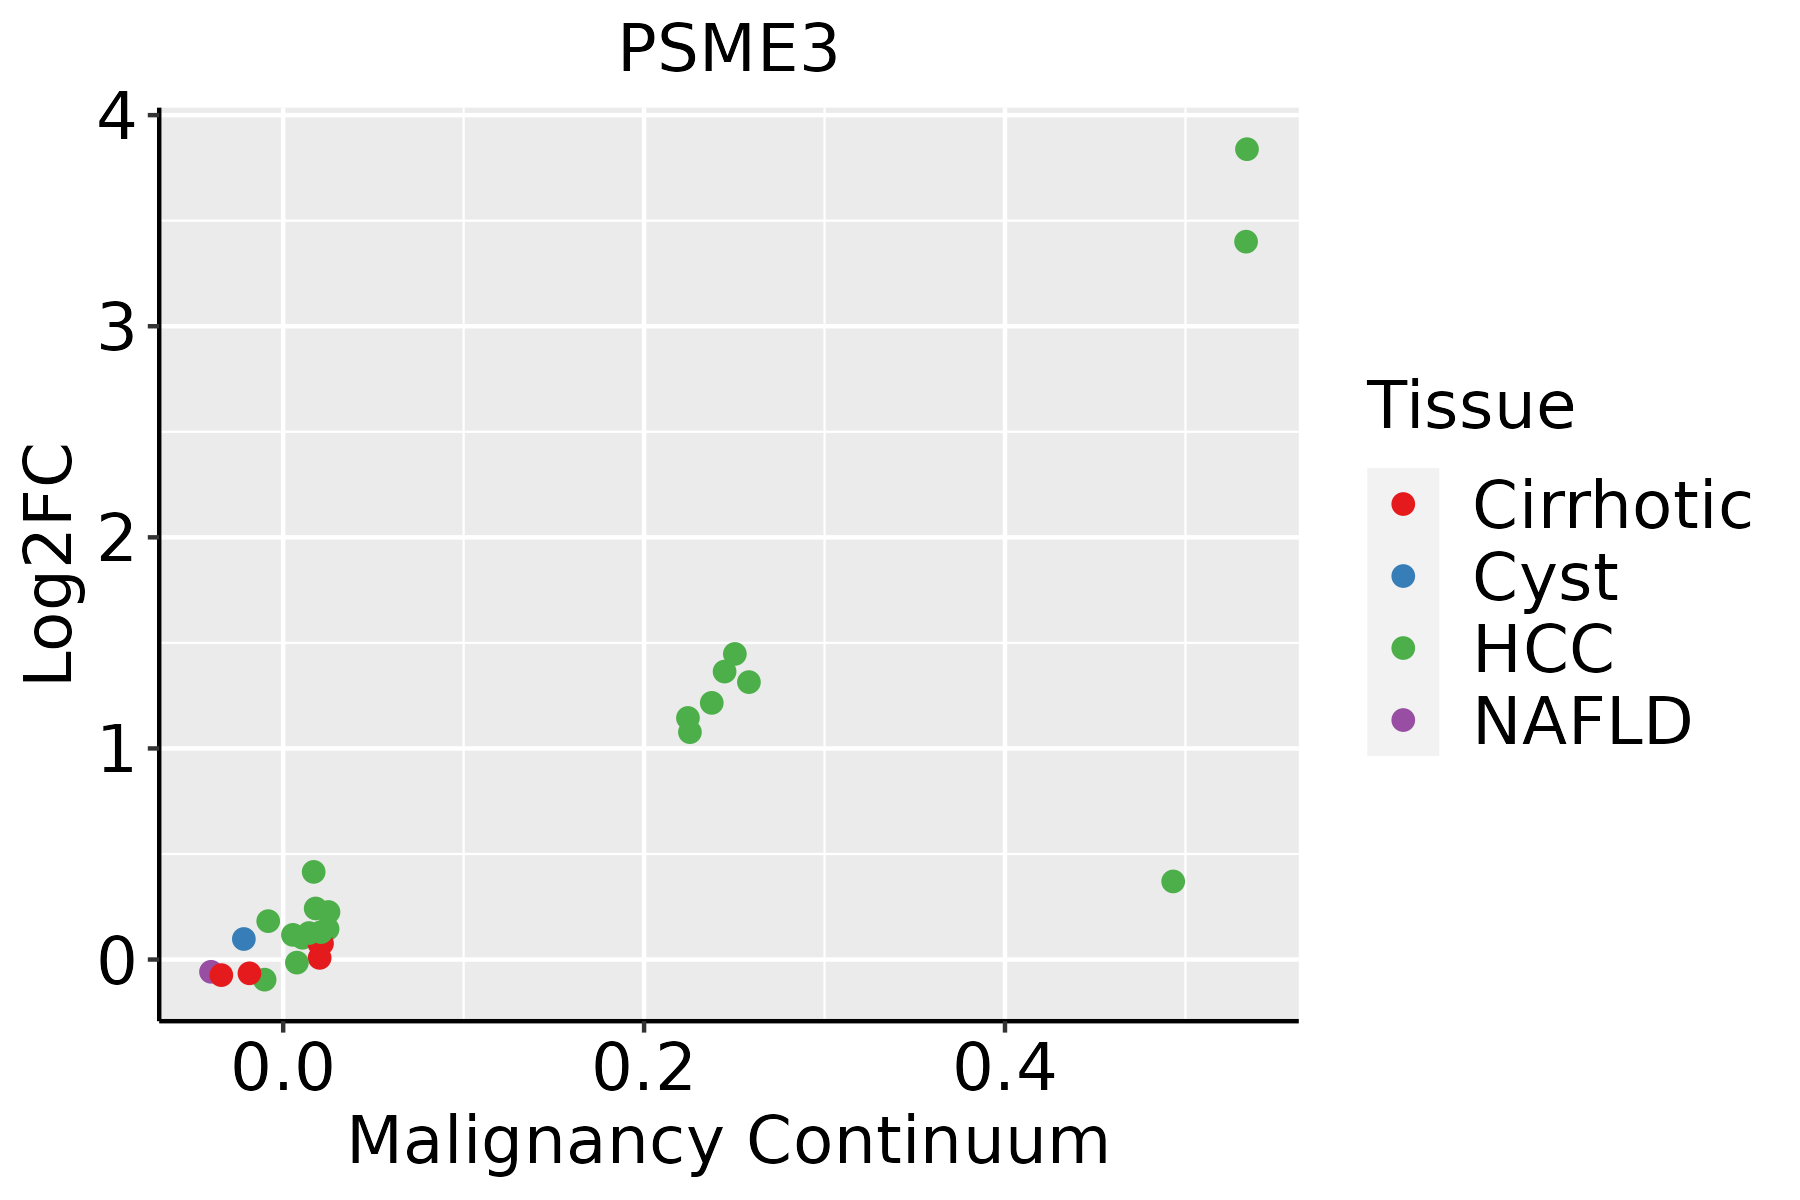 | HCC: Hepatocellular carcinoma |
| NAFLD: Non-alcoholic fatty liver disease | ||
| Oral Cavity |  | EOLP: Erosive Oral lichen planus |
| LP: leukoplakia | ||
| NEOLP: Non-erosive oral lichen planus | ||
| OSCC: Oral squamous cell carcinoma | ||
| Skin |  | AK: Actinic keratosis |
| cSCC: Cutaneous squamous cell carcinoma | ||
| SCCIS:squamous cell carcinoma in situ |
| ∗log2FC in expression of this searched gene in stem-like cells from each diseased tissue sample relative to stem-like cells in normal samples in each tissue plotted against the malignancy continuum. Samples are colored based on if they are from different disease stage. |
Top |
Malignant transformation related pathway analysis |
| Find out the enriched GO biological processes and KEGG pathways involved in transition from healthy to precancer to cancer |
| Tissue | Disease Stage | Enriched GO biological Processes |
| Colorectum | AD |  |
| Colorectum | SER |  |
| Colorectum | MSS |  |
| Colorectum | MSI-H |  |
| Colorectum | FAP |  |
| ∗Top 15 enriched GO BP terms are showed in the bar plot of each disease state in each tissue. Each row represents a significant GO biological process which is colored according to the -log10(p.adjust). |
| Page: 1 2 3 4 5 6 7 8 9 |
| GO ID | Tissue | Disease Stage | Description | Gene Ratio | Bg Ratio | pvalue | p.adjust | Count |
| GO:0042176 | Colorectum | AD | regulation of protein catabolic process | 160/3918 | 391/18723 | 1.06e-19 | 7.34e-17 | 160 |
| GO:1903362 | Colorectum | AD | regulation of cellular protein catabolic process | 109/3918 | 255/18723 | 2.14e-15 | 6.08e-13 | 109 |
| GO:0010498 | Colorectum | AD | proteasomal protein catabolic process | 174/3918 | 490/18723 | 3.18e-14 | 7.66e-12 | 174 |
| GO:0009895 | Colorectum | AD | negative regulation of catabolic process | 124/3918 | 320/18723 | 1.66e-13 | 3.35e-11 | 124 |
| GO:1903050 | Colorectum | AD | regulation of proteolysis involved in cellular protein catabolic process | 92/3918 | 221/18723 | 2.04e-12 | 3.19e-10 | 92 |
| GO:0031330 | Colorectum | AD | negative regulation of cellular catabolic process | 104/3918 | 262/18723 | 2.66e-12 | 3.96e-10 | 104 |
| GO:0045862 | Colorectum | AD | positive regulation of proteolysis | 129/3918 | 372/18723 | 4.04e-10 | 3.46e-08 | 129 |
| GO:0051098 | Colorectum | AD | regulation of binding | 126/3918 | 363/18723 | 6.01e-10 | 4.88e-08 | 126 |
| GO:0042177 | Colorectum | AD | negative regulation of protein catabolic process | 55/3918 | 121/18723 | 1.19e-09 | 8.85e-08 | 55 |
| GO:0061136 | Colorectum | AD | regulation of proteasomal protein catabolic process | 75/3918 | 187/18723 | 1.65e-09 | 1.20e-07 | 75 |
| GO:1903363 | Colorectum | AD | negative regulation of cellular protein catabolic process | 39/3918 | 75/18723 | 2.69e-09 | 1.87e-07 | 39 |
| GO:2001233 | Colorectum | AD | regulation of apoptotic signaling pathway | 119/3918 | 356/18723 | 2.14e-08 | 1.21e-06 | 119 |
| GO:1903051 | Colorectum | AD | negative regulation of proteolysis involved in cellular protein catabolic process | 31/3918 | 64/18723 | 8.71e-07 | 2.98e-05 | 31 |
| GO:0052547 | Colorectum | AD | regulation of peptidase activity | 137/3918 | 461/18723 | 4.12e-06 | 1.12e-04 | 137 |
| GO:0043393 | Colorectum | AD | regulation of protein binding | 68/3918 | 196/18723 | 5.17e-06 | 1.34e-04 | 68 |
| GO:0010952 | Colorectum | AD | positive regulation of peptidase activity | 68/3918 | 197/18723 | 6.30e-06 | 1.59e-04 | 68 |
| GO:2001234 | Colorectum | AD | negative regulation of apoptotic signaling pathway | 74/3918 | 224/18723 | 1.49e-05 | 3.18e-04 | 74 |
| GO:0045861 | Colorectum | AD | negative regulation of proteolysis | 106/3918 | 351/18723 | 2.33e-05 | 4.57e-04 | 106 |
| GO:1901799 | Colorectum | AD | negative regulation of proteasomal protein catabolic process | 23/3918 | 49/18723 | 4.18e-05 | 7.37e-04 | 23 |
| GO:0052548 | Colorectum | AD | regulation of endopeptidase activity | 124/3918 | 432/18723 | 6.58e-05 | 1.07e-03 | 124 |
| Page: 1 2 3 4 5 6 7 8 9 10 11 |
| Pathway ID | Tissue | Disease Stage | Description | Gene Ratio | Bg Ratio | pvalue | p.adjust | qvalue | Count |
| hsa03050 | Colorectum | AD | Proteasome | 29/2092 | 46/8465 | 3.87e-08 | 6.18e-07 | 3.94e-07 | 29 |
| hsa05160 | Colorectum | AD | Hepatitis C | 54/2092 | 157/8465 | 3.87e-03 | 1.96e-02 | 1.25e-02 | 54 |
| hsa030501 | Colorectum | AD | Proteasome | 29/2092 | 46/8465 | 3.87e-08 | 6.18e-07 | 3.94e-07 | 29 |
| hsa051601 | Colorectum | AD | Hepatitis C | 54/2092 | 157/8465 | 3.87e-03 | 1.96e-02 | 1.25e-02 | 54 |
| hsa04612 | Colorectum | SER | Antigen processing and presentation | 25/1580 | 78/8465 | 3.11e-03 | 2.11e-02 | 1.53e-02 | 25 |
| hsa046121 | Colorectum | SER | Antigen processing and presentation | 25/1580 | 78/8465 | 3.11e-03 | 2.11e-02 | 1.53e-02 | 25 |
| hsa030504 | Colorectum | MSS | Proteasome | 29/1875 | 46/8465 | 2.72e-09 | 5.69e-08 | 3.48e-08 | 29 |
| hsa051602 | Colorectum | MSS | Hepatitis C | 52/1875 | 157/8465 | 9.29e-04 | 5.58e-03 | 3.42e-03 | 52 |
| hsa046122 | Colorectum | MSS | Antigen processing and presentation | 27/1875 | 78/8465 | 7.72e-03 | 2.91e-02 | 1.78e-02 | 27 |
| hsa030505 | Colorectum | MSS | Proteasome | 29/1875 | 46/8465 | 2.72e-09 | 5.69e-08 | 3.48e-08 | 29 |
| hsa051603 | Colorectum | MSS | Hepatitis C | 52/1875 | 157/8465 | 9.29e-04 | 5.58e-03 | 3.42e-03 | 52 |
| hsa046123 | Colorectum | MSS | Antigen processing and presentation | 27/1875 | 78/8465 | 7.72e-03 | 2.91e-02 | 1.78e-02 | 27 |
| hsa046124 | Colorectum | MSI-H | Antigen processing and presentation | 23/797 | 78/8465 | 4.15e-07 | 7.91e-06 | 6.63e-06 | 23 |
| hsa046125 | Colorectum | MSI-H | Antigen processing and presentation | 23/797 | 78/8465 | 4.15e-07 | 7.91e-06 | 6.63e-06 | 23 |
| hsa0305028 | Esophagus | ESCC | Proteasome | 44/4205 | 46/8465 | 1.05e-11 | 1.60e-10 | 8.21e-11 | 44 |
| hsa051609 | Esophagus | ESCC | Hepatitis C | 107/4205 | 157/8465 | 1.75e-06 | 1.08e-05 | 5.55e-06 | 107 |
| hsa0461230 | Esophagus | ESCC | Antigen processing and presentation | 51/4205 | 78/8465 | 3.57e-03 | 9.34e-03 | 4.78e-03 | 51 |
| hsa0305037 | Esophagus | ESCC | Proteasome | 44/4205 | 46/8465 | 1.05e-11 | 1.60e-10 | 8.21e-11 | 44 |
| hsa0516016 | Esophagus | ESCC | Hepatitis C | 107/4205 | 157/8465 | 1.75e-06 | 1.08e-05 | 5.55e-06 | 107 |
| hsa04612114 | Esophagus | ESCC | Antigen processing and presentation | 51/4205 | 78/8465 | 3.57e-03 | 9.34e-03 | 4.78e-03 | 51 |
| Page: 1 2 |
Top |
Cell-cell communication analysis |
| Identification of potential cell-cell interactions between two cell types and their ligand-receptor pairs for different disease states |
| Ligand | Receptor | LRpair | Pathway | Tissue | Disease Stage |
| Page: 1 |
Top |
Single-cell gene regulatory network inference analysis |
| Find out the significant the regulons (TFs) and the target genes of each regulon across cell types for different disease states |
| TF | Cell Type | Tissue | Disease Stage | Target Gene | RSS | Regulon Activity |
| ∗The dot plots of a searched regulon are shown for all cell subpopulations in each disease state of each tissue based on the regulon specific score inferred using pySCENIC and by calculating the average expression. |
| Page: 1 |
Top |
Somatic mutation of malignant transformation related genes |
| Annotation of somatic variants for genes involved in malignant transformation |
| Hugo Symbol | Variant Class | Variant Classification | dbSNP RS | HGVSc | HGVSp | HGVSp Short | SWISSPROT | BIOTYPE | SIFT | PolyPhen | Tumor Sample Barcode | Tissue | Histology | Sex | Age | Stage | Therapy Types | Drugs | Outcome |
| PSME3 | SNV | Missense_Mutation | rs751193290 | c.691N>T | p.Arg231Trp | p.R231W | P61289 | protein_coding | tolerated(0.23) | probably_damaging(0.942) | TCGA-C5-A2LZ-01 | Cervix | cervical & endocervical cancer | Female | >=65 | III/IV | Unknown | Unknown | PD |
| PSME3 | SNV | Missense_Mutation | rs751193290 | c.691C>T | p.Arg231Trp | p.R231W | P61289 | protein_coding | tolerated(0.23) | probably_damaging(0.942) | TCGA-DS-A0VN-01 | Cervix | cervical & endocervical cancer | Female | <65 | I/II | Chemotherapy | cisplatin | SD |
| PSME3 | SNV | Missense_Mutation | rs751193290 | c.691N>T | p.Arg231Trp | p.R231W | P61289 | protein_coding | tolerated(0.23) | probably_damaging(0.942) | TCGA-DS-A1OA-01 | Cervix | cervical & endocervical cancer | Female | >=65 | I/II | Chemotherapy | carboplatin | PD |
| PSME3 | SNV | Missense_Mutation | c.431N>A | p.Cys144Tyr | p.C144Y | P61289 | protein_coding | tolerated_low_confidence(0.12) | benign(0) | TCGA-A5-A0G2-01 | Endometrium | uterine corpus endometrioid carcinoma | Female | <65 | III/IV | Unknown | Unknown | SD | |
| PSME3 | SNV | Missense_Mutation | c.620N>A | p.Ala207Asp | p.A207D | P61289 | protein_coding | deleterious(0) | possibly_damaging(0.884) | TCGA-AP-A059-01 | Endometrium | uterine corpus endometrioid carcinoma | Female | >=65 | I/II | Unknown | Unknown | SD | |
| PSME3 | SNV | Missense_Mutation | rs767374760 | c.404N>T | p.Thr135Met | p.T135M | P61289 | protein_coding | tolerated(0.23) | probably_damaging(0.917) | TCGA-AX-A2HD-01 | Endometrium | uterine corpus endometrioid carcinoma | Female | >=65 | III/IV | Unknown | Unknown | SD |
| PSME3 | SNV | Missense_Mutation | rs751193290 | c.691N>T | p.Arg231Trp | p.R231W | P61289 | protein_coding | tolerated(0.23) | probably_damaging(0.942) | TCGA-B5-A11E-01 | Endometrium | uterine corpus endometrioid carcinoma | Female | <65 | I/II | Unknown | Unknown | SD |
| PSME3 | SNV | Missense_Mutation | novel | c.650G>A | p.Arg217His | p.R217H | P61289 | protein_coding | deleterious(0) | benign(0.165) | TCGA-B5-A3FC-01 | Endometrium | uterine corpus endometrioid carcinoma | Female | <65 | I/II | Unknown | Unknown | SD |
| PSME3 | SNV | Missense_Mutation | rs763446052 | c.379N>T | p.Arg127Trp | p.R127W | P61289 | protein_coding | deleterious(0.05) | probably_damaging(0.941) | TCGA-E6-A1LX-01 | Endometrium | uterine corpus endometrioid carcinoma | Female | <65 | I/II | Unknown | Unknown | SD |
| PSME3 | SNV | Missense_Mutation | novel | c.596N>A | p.Arg199Lys | p.R199K | P61289 | protein_coding | deleterious(0.03) | benign(0.022) | TCGA-EO-A22R-01 | Endometrium | uterine corpus endometrioid carcinoma | Female | <65 | I/II | Unknown | Unknown | SD |
| Page: 1 2 |
Top |
Related drugs of malignant transformation related genes |
| Identification of chemicals and drugs interact with genes involved in malignant transfromation |
| (DGIdb 4.0) |
| Entrez ID | Symbol | Category | Interaction Types | Drug Claim Name | Drug Name | PMIDs |
| 10197 | PSME3 | NA | inhibitor | BORTEZOMIB | BORTEZOMIB | |
| 10197 | PSME3 | NA | inhibitor | CARFILZOMIB | CARFILZOMIB |
| Page: 1 |

Copyright 2023-Present -The University of Texas Health Science Center at Houston |