
|
|||||
|
 | |
| |
| |
| |
| |
| |
|
Gene: PSMD9 |
Gene summary for PSMD9 |
| Gene information | Species | Human | Gene symbol | PSMD9 | Gene ID | 5715 |
| Gene name | proteasome 26S subunit, non-ATPase 9 | |
| Gene Alias | Rpn4 | |
| Cytomap | 12q24.31 | |
| Gene Type | protein-coding | GO ID | GO:0002790 | UniProtAcc | O00233 |
Top |
Malignant transformation analysis |
| Identification of the aberrant gene expression in precancerous and cancerous lesions by comparing the gene expression of stem-like cells in diseased tissues with normal stem cells |
| Entrez ID | Symbol | Replicates | Species | Organ | Tissue | Adj P-value | Log2FC | Malignancy |
| 5715 | PSMD9 | HTA11_1938_2000001011 | Human | Colorectum | AD | 4.00e-03 | 1.63e-01 | -0.0811 |
| 5715 | PSMD9 | HTA11_78_2000001011 | Human | Colorectum | AD | 4.96e-02 | 9.84e-02 | -0.1088 |
| 5715 | PSMD9 | HTA11_347_2000001011 | Human | Colorectum | AD | 2.84e-08 | 1.87e-01 | -0.1954 |
| 5715 | PSMD9 | HTA11_83_2000001011 | Human | Colorectum | SER | 2.92e-07 | 2.45e-01 | -0.1526 |
| 5715 | PSMD9 | HTA11_696_2000001011 | Human | Colorectum | AD | 1.96e-10 | 2.09e-01 | -0.1464 |
| 5715 | PSMD9 | HTA11_866_2000001011 | Human | Colorectum | AD | 8.62e-04 | 1.02e-01 | -0.1001 |
| 5715 | PSMD9 | HTA11_1391_2000001011 | Human | Colorectum | AD | 5.72e-12 | 3.03e-01 | -0.059 |
| 5715 | PSMD9 | HTA11_7862_2000001011 | Human | Colorectum | AD | 1.24e-02 | 1.98e-01 | -0.0179 |
| 5715 | PSMD9 | HTA11_866_3004761011 | Human | Colorectum | AD | 3.01e-09 | 2.28e-01 | 0.096 |
| 5715 | PSMD9 | HTA11_4255_2000001011 | Human | Colorectum | SER | 3.40e-02 | 2.22e-01 | 0.0446 |
| 5715 | PSMD9 | HTA11_10711_2000001011 | Human | Colorectum | AD | 4.64e-04 | 1.83e-01 | 0.0338 |
| 5715 | PSMD9 | HTA11_7696_3000711011 | Human | Colorectum | AD | 4.46e-07 | 1.52e-01 | 0.0674 |
| 5715 | PSMD9 | HTA11_6818_2000001011 | Human | Colorectum | AD | 1.38e-07 | 3.43e-01 | 0.0112 |
| 5715 | PSMD9 | HTA11_6818_2000001021 | Human | Colorectum | AD | 5.94e-14 | 3.55e-01 | 0.0588 |
| 5715 | PSMD9 | HTA11_99999970781_79442 | Human | Colorectum | MSS | 2.00e-05 | 1.25e-01 | 0.294 |
| 5715 | PSMD9 | HTA11_99999965062_69753 | Human | Colorectum | MSI-H | 7.89e-03 | 3.22e-01 | 0.3487 |
| 5715 | PSMD9 | HTA11_99999971662_82457 | Human | Colorectum | MSS | 7.11e-14 | 3.05e-01 | 0.3859 |
| 5715 | PSMD9 | HTA11_99999973899_84307 | Human | Colorectum | MSS | 1.46e-02 | 1.84e-01 | 0.2585 |
| 5715 | PSMD9 | HTA11_99999974143_84620 | Human | Colorectum | MSS | 9.63e-08 | 1.82e-01 | 0.3005 |
| 5715 | PSMD9 | LZE3D | Human | Esophagus | HGIN | 6.56e-03 | 8.76e-01 | 0.0668 |
| Page: 1 2 3 4 5 6 7 8 |
| Tissue | Expression Dynamics | Abbreviation |
| Colorectum (GSE201348) | 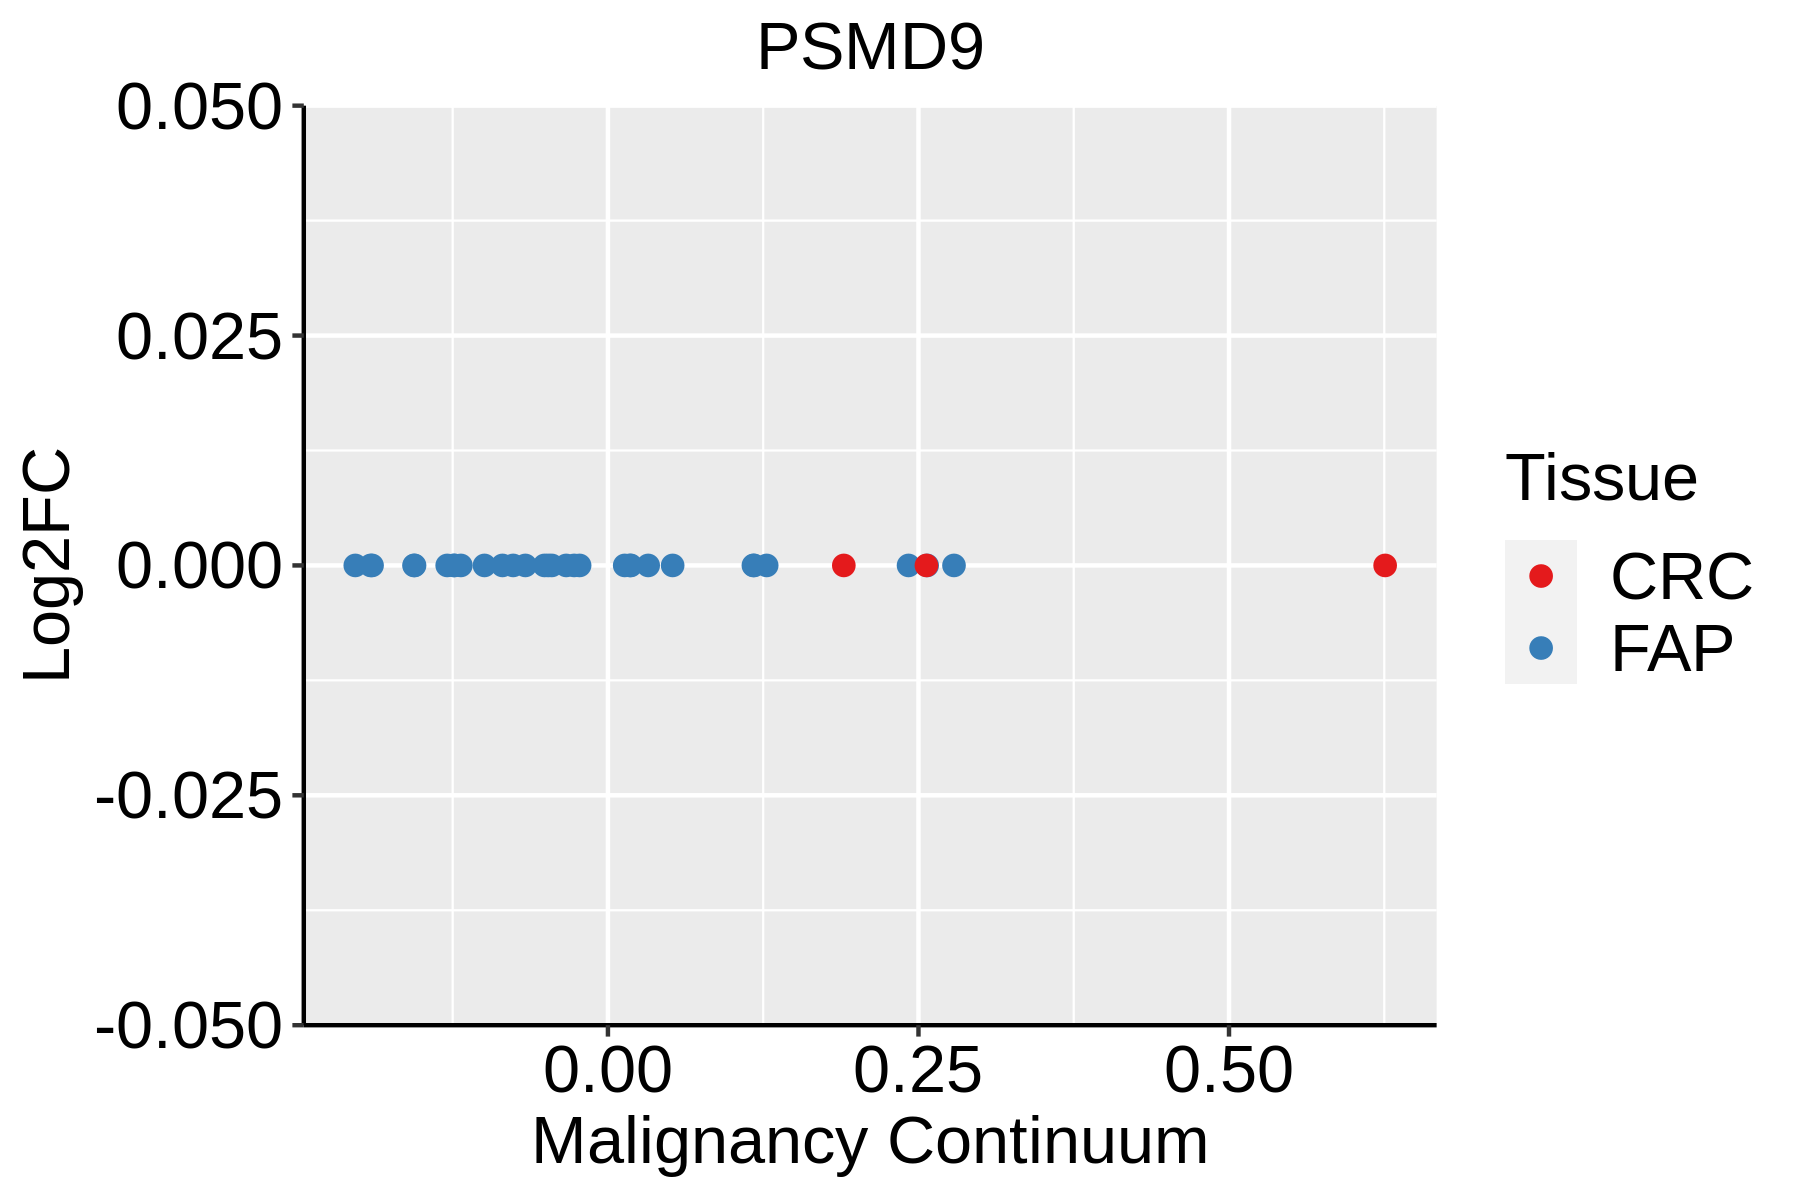 | FAP: Familial adenomatous polyposis |
| CRC: Colorectal cancer | ||
| Colorectum (HTA11) | 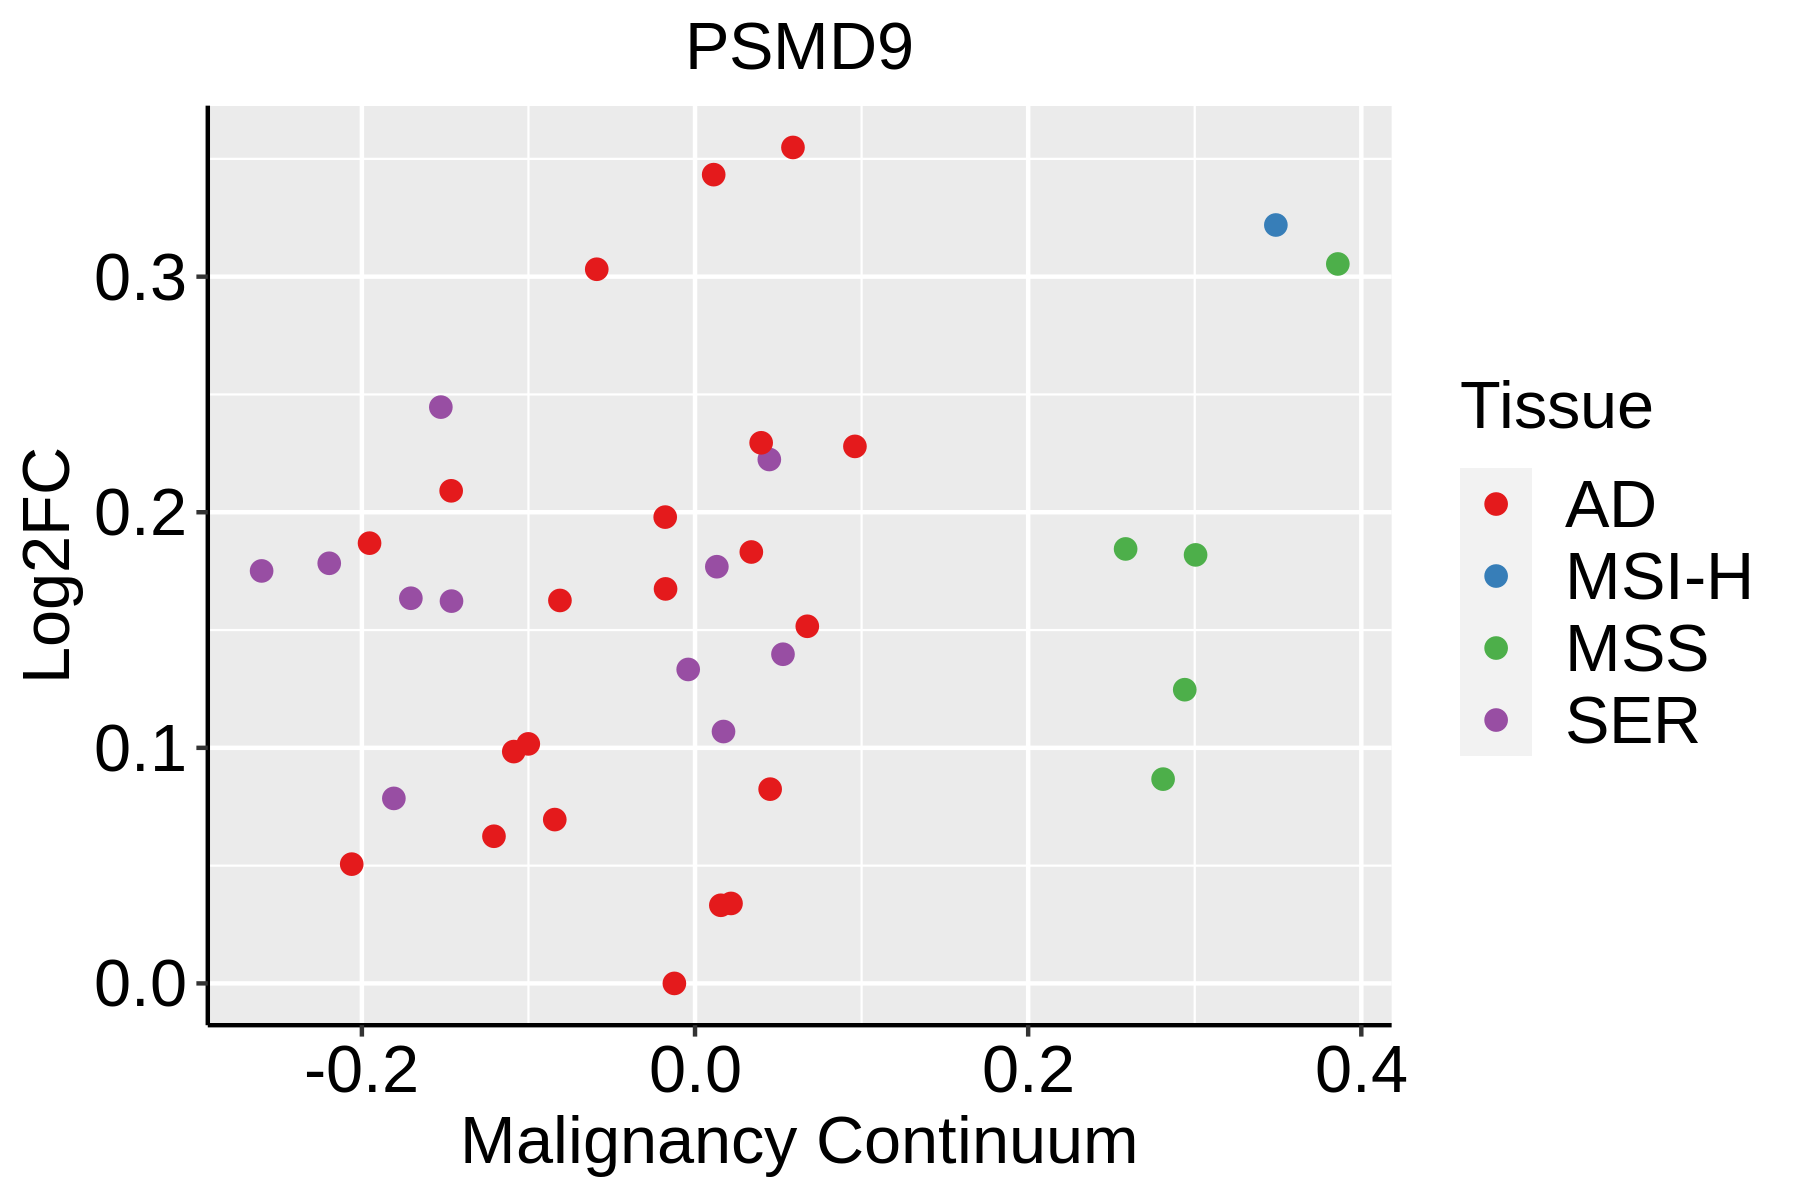 | AD: Adenomas |
| SER: Sessile serrated lesions | ||
| MSI-H: Microsatellite-high colorectal cancer | ||
| MSS: Microsatellite stable colorectal cancer | ||
| Esophagus | 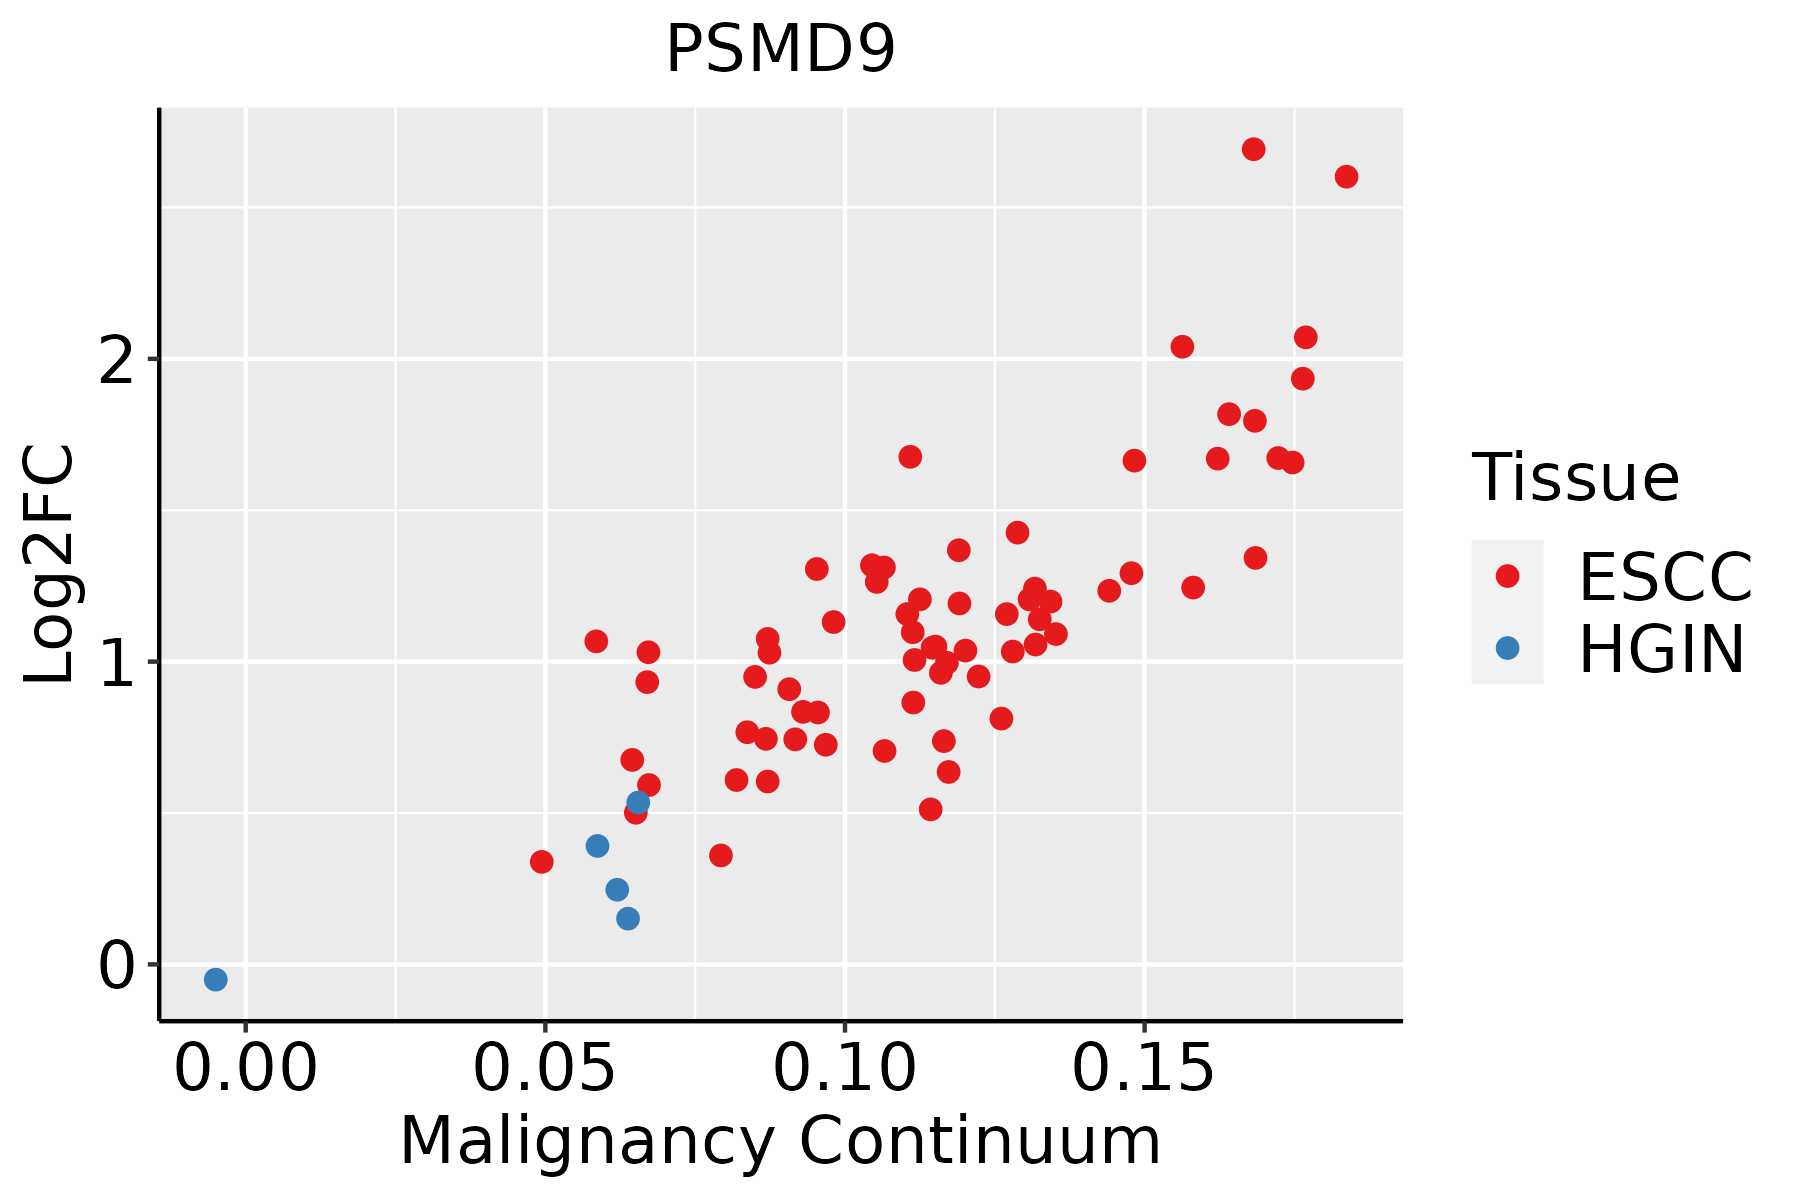 | ESCC: Esophageal squamous cell carcinoma |
| HGIN: High-grade intraepithelial neoplasias | ||
| LGIN: Low-grade intraepithelial neoplasias | ||
| Liver |  | HCC: Hepatocellular carcinoma |
| NAFLD: Non-alcoholic fatty liver disease | ||
| Oral Cavity | 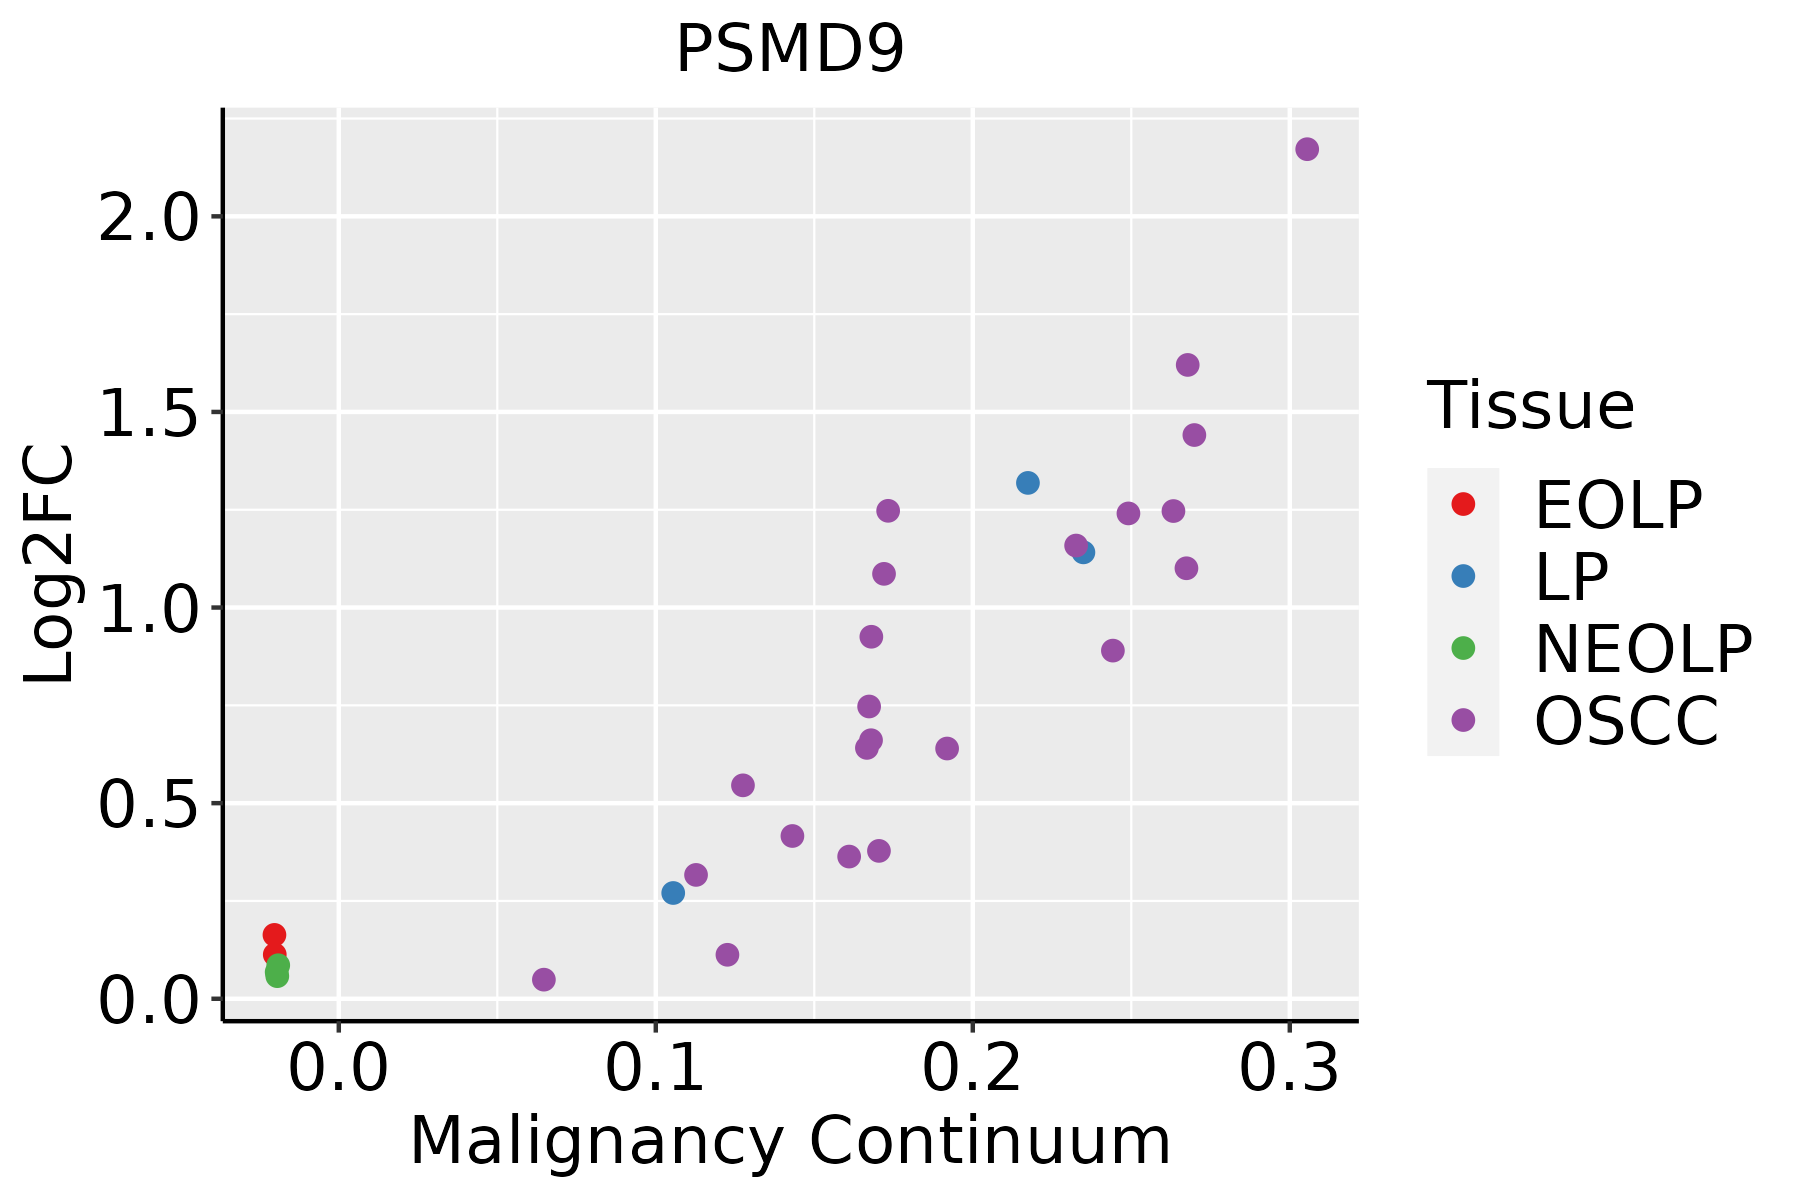 | EOLP: Erosive Oral lichen planus |
| LP: leukoplakia | ||
| NEOLP: Non-erosive oral lichen planus | ||
| OSCC: Oral squamous cell carcinoma | ||
| Skin | 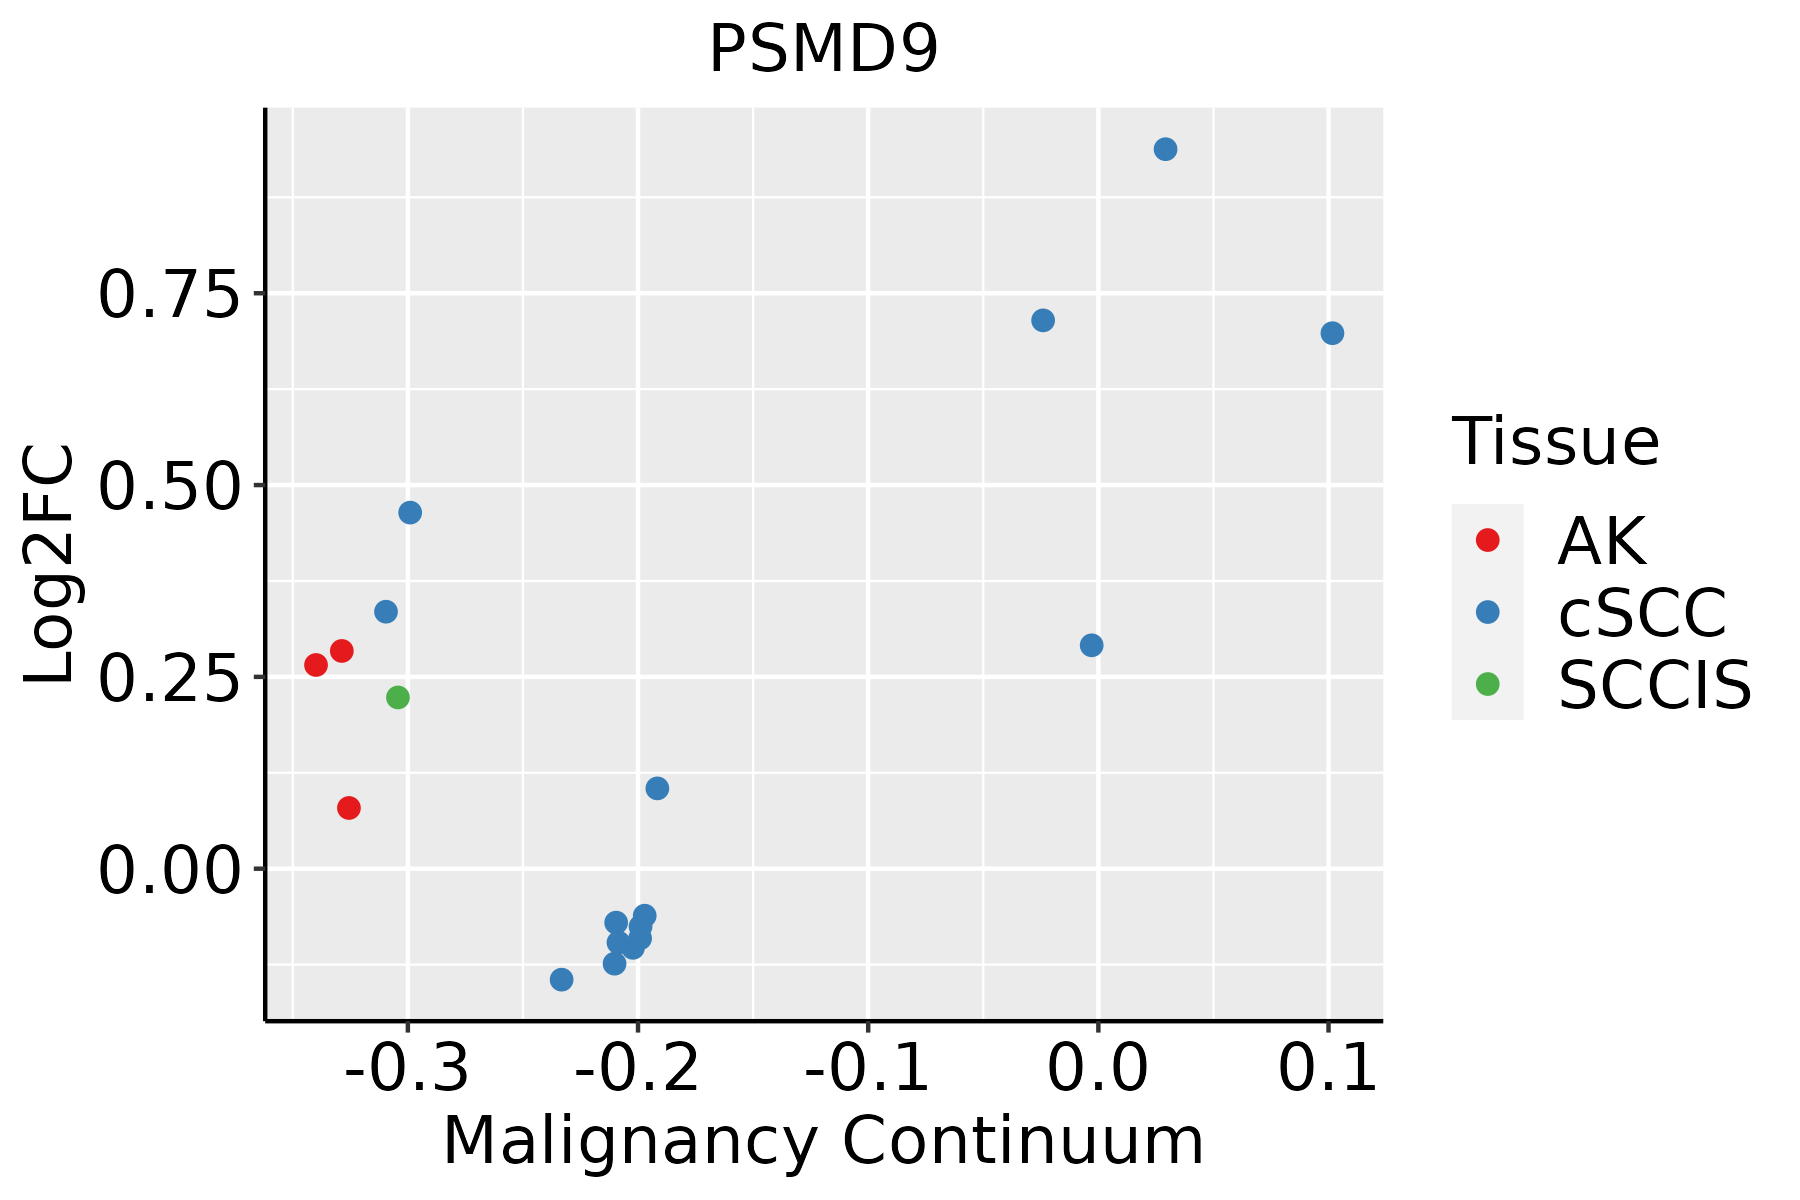 | AK: Actinic keratosis |
| cSCC: Cutaneous squamous cell carcinoma | ||
| SCCIS:squamous cell carcinoma in situ | ||
| Thyroid | 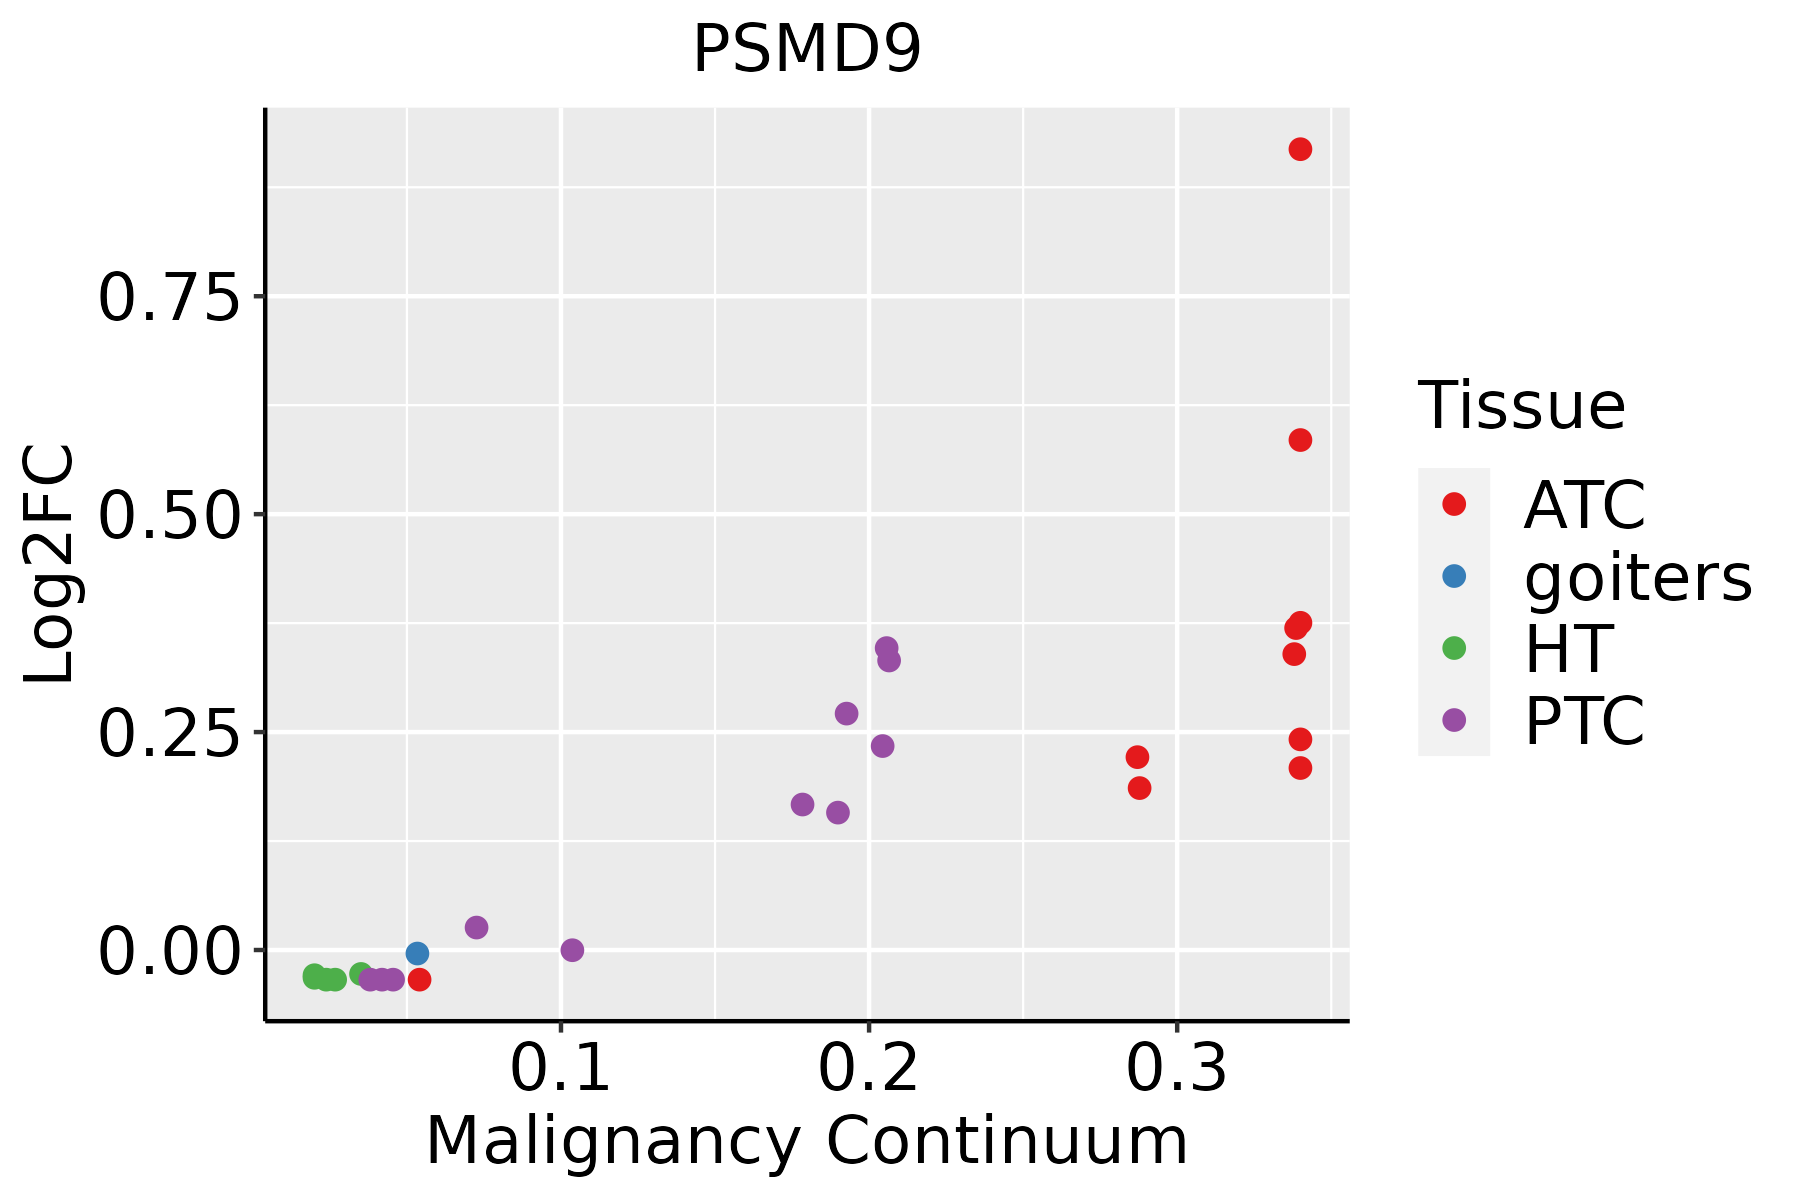 | ATC: Anaplastic thyroid cancer |
| HT: Hashimoto's thyroiditis | ||
| PTC: Papillary thyroid cancer |
| ∗log2FC in expression of this searched gene in stem-like cells from each diseased tissue sample relative to stem-like cells in normal samples in each tissue plotted against the malignancy continuum. Samples are colored based on if they are from different disease stage. |
Top |
Malignant transformation related pathway analysis |
| Find out the enriched GO biological processes and KEGG pathways involved in transition from healthy to precancer to cancer |
| Tissue | Disease Stage | Enriched GO biological Processes |
| Colorectum | AD |  |
| Colorectum | SER |  |
| Colorectum | MSS |  |
| Colorectum | MSI-H |  |
| Colorectum | FAP |  |
| ∗Top 15 enriched GO BP terms are showed in the bar plot of each disease state in each tissue. Each row represents a significant GO biological process which is colored according to the -log10(p.adjust). |
| Page: 1 2 3 4 5 6 7 8 9 |
| GO ID | Tissue | Disease Stage | Description | Gene Ratio | Bg Ratio | pvalue | p.adjust | Count |
| GO:1904951 | Colorectum | AD | positive regulation of establishment of protein localization | 112/3918 | 319/18723 | 2.55e-09 | 1.80e-07 | 112 |
| GO:0051222 | Colorectum | AD | positive regulation of protein transport | 106/3918 | 303/18723 | 8.45e-09 | 5.08e-07 | 106 |
| GO:0050708 | Colorectum | AD | regulation of protein secretion | 83/3918 | 268/18723 | 6.59e-05 | 1.07e-03 | 83 |
| GO:0009306 | Colorectum | AD | protein secretion | 105/3918 | 359/18723 | 1.05e-04 | 1.57e-03 | 105 |
| GO:0035592 | Colorectum | AD | establishment of protein localization to extracellular region | 105/3918 | 360/18723 | 1.18e-04 | 1.73e-03 | 105 |
| GO:0071692 | Colorectum | AD | protein localization to extracellular region | 106/3918 | 368/18723 | 1.86e-04 | 2.49e-03 | 106 |
| GO:0050796 | Colorectum | AD | regulation of insulin secretion | 54/3918 | 165/18723 | 2.60e-04 | 3.25e-03 | 54 |
| GO:0051047 | Colorectum | AD | positive regulation of secretion | 90/3918 | 310/18723 | 4.11e-04 | 4.66e-03 | 90 |
| GO:0030073 | Colorectum | AD | insulin secretion | 61/3918 | 195/18723 | 4.28e-04 | 4.81e-03 | 61 |
| GO:1903532 | Colorectum | AD | positive regulation of secretion by cell | 82/3918 | 282/18723 | 6.85e-04 | 7.00e-03 | 82 |
| GO:0015833 | Colorectum | AD | peptide transport | 77/3918 | 264/18723 | 8.90e-04 | 8.60e-03 | 77 |
| GO:0090087 | Colorectum | AD | regulation of peptide transport | 60/3918 | 202/18723 | 1.94e-03 | 1.58e-02 | 60 |
| GO:0030072 | Colorectum | AD | peptide hormone secretion | 68/3918 | 236/18723 | 2.39e-03 | 1.85e-02 | 68 |
| GO:0002791 | Colorectum | AD | regulation of peptide secretion | 59/3918 | 200/18723 | 2.50e-03 | 1.92e-02 | 59 |
| GO:0090276 | Colorectum | AD | regulation of peptide hormone secretion | 58/3918 | 196/18723 | 2.51e-03 | 1.92e-02 | 58 |
| GO:0002790 | Colorectum | AD | peptide secretion | 69/3918 | 242/18723 | 2.97e-03 | 2.22e-02 | 69 |
| GO:0042886 | Colorectum | AD | amide transport | 83/3918 | 301/18723 | 3.37e-03 | 2.46e-02 | 83 |
| GO:0032024 | Colorectum | AD | positive regulation of insulin secretion | 27/3918 | 78/18723 | 3.52e-03 | 2.54e-02 | 27 |
| GO:0050714 | Colorectum | AD | positive regulation of protein secretion | 42/3918 | 137/18723 | 4.64e-03 | 3.16e-02 | 42 |
| GO:0002792 | Colorectum | AD | negative regulation of peptide secretion | 17/3918 | 44/18723 | 5.46e-03 | 3.56e-02 | 17 |
| Page: 1 2 3 4 5 6 7 |
| Pathway ID | Tissue | Disease Stage | Description | Gene Ratio | Bg Ratio | pvalue | p.adjust | qvalue | Count |
| hsa05012 | Colorectum | AD | Parkinson disease | 147/2092 | 266/8465 | 2.53e-27 | 8.48e-25 | 5.41e-25 | 147 |
| hsa05010 | Colorectum | AD | Alzheimer disease | 174/2092 | 384/8465 | 1.82e-19 | 9.26e-18 | 5.91e-18 | 174 |
| hsa05016 | Colorectum | AD | Huntington disease | 147/2092 | 306/8465 | 1.93e-19 | 9.26e-18 | 5.91e-18 | 147 |
| hsa05020 | Colorectum | AD | Prion disease | 133/2092 | 273/8465 | 2.47e-18 | 8.29e-17 | 5.29e-17 | 133 |
| hsa05014 | Colorectum | AD | Amyotrophic lateral sclerosis | 164/2092 | 364/8465 | 4.28e-18 | 1.27e-16 | 8.09e-17 | 164 |
| hsa05022 | Colorectum | AD | Pathways of neurodegeneration - multiple diseases | 201/2092 | 476/8465 | 4.54e-18 | 1.27e-16 | 8.09e-17 | 201 |
| hsa03050 | Colorectum | AD | Proteasome | 29/2092 | 46/8465 | 3.87e-08 | 6.18e-07 | 3.94e-07 | 29 |
| hsa05017 | Colorectum | AD | Spinocerebellar ataxia | 60/2092 | 143/8465 | 3.78e-06 | 4.35e-05 | 2.78e-05 | 60 |
| hsa050121 | Colorectum | AD | Parkinson disease | 147/2092 | 266/8465 | 2.53e-27 | 8.48e-25 | 5.41e-25 | 147 |
| hsa050101 | Colorectum | AD | Alzheimer disease | 174/2092 | 384/8465 | 1.82e-19 | 9.26e-18 | 5.91e-18 | 174 |
| hsa050161 | Colorectum | AD | Huntington disease | 147/2092 | 306/8465 | 1.93e-19 | 9.26e-18 | 5.91e-18 | 147 |
| hsa050201 | Colorectum | AD | Prion disease | 133/2092 | 273/8465 | 2.47e-18 | 8.29e-17 | 5.29e-17 | 133 |
| hsa050141 | Colorectum | AD | Amyotrophic lateral sclerosis | 164/2092 | 364/8465 | 4.28e-18 | 1.27e-16 | 8.09e-17 | 164 |
| hsa050221 | Colorectum | AD | Pathways of neurodegeneration - multiple diseases | 201/2092 | 476/8465 | 4.54e-18 | 1.27e-16 | 8.09e-17 | 201 |
| hsa030501 | Colorectum | AD | Proteasome | 29/2092 | 46/8465 | 3.87e-08 | 6.18e-07 | 3.94e-07 | 29 |
| hsa050171 | Colorectum | AD | Spinocerebellar ataxia | 60/2092 | 143/8465 | 3.78e-06 | 4.35e-05 | 2.78e-05 | 60 |
| hsa050122 | Colorectum | SER | Parkinson disease | 132/1580 | 266/8465 | 2.72e-31 | 9.03e-29 | 6.55e-29 | 132 |
| hsa050202 | Colorectum | SER | Prion disease | 119/1580 | 273/8465 | 4.61e-22 | 3.06e-20 | 2.22e-20 | 119 |
| hsa050162 | Colorectum | SER | Huntington disease | 127/1580 | 306/8465 | 3.29e-21 | 1.37e-19 | 9.92e-20 | 127 |
| hsa050102 | Colorectum | SER | Alzheimer disease | 146/1580 | 384/8465 | 6.52e-20 | 2.40e-18 | 1.75e-18 | 146 |
| Page: 1 2 3 4 5 6 7 8 |
Top |
Cell-cell communication analysis |
| Identification of potential cell-cell interactions between two cell types and their ligand-receptor pairs for different disease states |
| Ligand | Receptor | LRpair | Pathway | Tissue | Disease Stage |
| Page: 1 |
Top |
Single-cell gene regulatory network inference analysis |
| Find out the significant the regulons (TFs) and the target genes of each regulon across cell types for different disease states |
| TF | Cell Type | Tissue | Disease Stage | Target Gene | RSS | Regulon Activity |
| ∗The dot plots of a searched regulon are shown for all cell subpopulations in each disease state of each tissue based on the regulon specific score inferred using pySCENIC and by calculating the average expression. |
| Page: 1 |
Top |
Somatic mutation of malignant transformation related genes |
| Annotation of somatic variants for genes involved in malignant transformation |
| Hugo Symbol | Variant Class | Variant Classification | dbSNP RS | HGVSc | HGVSp | HGVSp Short | SWISSPROT | BIOTYPE | SIFT | PolyPhen | Tumor Sample Barcode | Tissue | Histology | Sex | Age | Stage | Therapy Types | Drugs | Outcome |
| PSMD9 | SNV | Missense_Mutation | novel | c.586G>T | p.Gly196Trp | p.G196W | O00233 | protein_coding | deleterious(0) | probably_damaging(0.998) | TCGA-BH-A1EN-01 | Breast | breast invasive carcinoma | Female | >=65 | I/II | Unknown | Unknown | SD |
| PSMD9 | SNV | Missense_Mutation | c.20G>A | p.Arg7Lys | p.R7K | O00233 | protein_coding | tolerated_low_confidence(0.94) | benign(0) | TCGA-D8-A13Z-01 | Breast | breast invasive carcinoma | Female | <65 | I/II | Chemotherapy | doxorubicine | SD | |
| PSMD9 | SNV | Missense_Mutation | rs778204603 | c.581G>T | p.Arg194Leu | p.R194L | O00233 | protein_coding | deleterious(0) | probably_damaging(0.991) | TCGA-C5-A2LT-01 | Cervix | cervical & endocervical cancer | Female | <65 | I/II | Chemotherapy | cisplatin | SD |
| PSMD9 | SNV | Missense_Mutation | novel | c.136N>C | p.Ser46Arg | p.S46R | O00233 | protein_coding | tolerated(0.1) | benign(0.027) | TCGA-DS-A1OC-01 | Cervix | cervical & endocervical cancer | Female | <65 | I/II | Chemotherapy | gemcitabine | SD |
| PSMD9 | SNV | Missense_Mutation | novel | c.137N>A | p.Ser46Asn | p.S46N | O00233 | protein_coding | tolerated(0.17) | benign(0.147) | TCGA-DS-A1OC-01 | Cervix | cervical & endocervical cancer | Female | <65 | I/II | Chemotherapy | gemcitabine | SD |
| PSMD9 | SNV | Missense_Mutation | c.73N>C | p.Glu25Gln | p.E25Q | O00233 | protein_coding | tolerated(0.6) | benign(0.003) | TCGA-EK-A2PG-01 | Cervix | cervical & endocervical cancer | Female | >=65 | I/II | Unknown | Unknown | SD | |
| PSMD9 | SNV | Missense_Mutation | c.472N>A | p.Glu158Lys | p.E158K | O00233 | protein_coding | tolerated(0.19) | possibly_damaging(0.56) | TCGA-IR-A3LK-01 | Cervix | cervical & endocervical cancer | Female | >=65 | I/II | Chemotherapy | cisplatin | PD | |
| PSMD9 | SNV | Missense_Mutation | rs758694222 | c.580N>T | p.Arg194Cys | p.R194C | O00233 | protein_coding | deleterious(0) | probably_damaging(0.998) | TCGA-AA-A010-01 | Colorectum | colon adenocarcinoma | Female | <65 | I/II | Chemotherapy | folinic | CR |
| PSMD9 | SNV | Missense_Mutation | novel | c.299T>A | p.Leu100Gln | p.L100Q | O00233 | protein_coding | deleterious(0) | probably_damaging(0.979) | TCGA-AG-A00Y-01 | Colorectum | rectum adenocarcinoma | Male | >=65 | I/II | Unknown | Unknown | PD |
| PSMD9 | SNV | Missense_Mutation | novel | c.659C>A | p.Pro220His | p.P220H | O00233 | protein_coding | deleterious(0) | probably_damaging(0.975) | TCGA-A5-A0G2-01 | Endometrium | uterine corpus endometrioid carcinoma | Female | <65 | III/IV | Unknown | Unknown | SD |
| Page: 1 2 |
Top |
Related drugs of malignant transformation related genes |
| Identification of chemicals and drugs interact with genes involved in malignant transfromation |
| (DGIdb 4.0) |
| Entrez ID | Symbol | Category | Interaction Types | Drug Claim Name | Drug Name | PMIDs |
| 5715 | PSMD9 | NA | inhibitor | BORTEZOMIB | BORTEZOMIB | |
| 5715 | PSMD9 | NA | inhibitor | CARFILZOMIB | CARFILZOMIB |
| Page: 1 |

Copyright 2023-Present -The University of Texas Health Science Center at Houston |