
|
|||||
|
 | |
| |
| |
| |
| |
| |
|
Gene: PSMD7 |
Gene summary for PSMD7 |
| Gene information | Species | Human | Gene symbol | PSMD7 | Gene ID | 5713 |
| Gene name | proteasome 26S subunit, non-ATPase 7 | |
| Gene Alias | MOV34 | |
| Cytomap | 16q23.1 | |
| Gene Type | protein-coding | GO ID | GO:0006508 | UniProtAcc | P51665 |
Top |
Malignant transformation analysis |
| Identification of the aberrant gene expression in precancerous and cancerous lesions by comparing the gene expression of stem-like cells in diseased tissues with normal stem cells |
| Entrez ID | Symbol | Replicates | Species | Organ | Tissue | Adj P-value | Log2FC | Malignancy |
| 5713 | PSMD7 | GSM4909281 | Human | Breast | IDC | 1.02e-04 | 3.04e-01 | 0.21 |
| 5713 | PSMD7 | GSM4909282 | Human | Breast | IDC | 2.41e-13 | 3.51e-01 | -0.0288 |
| 5713 | PSMD7 | GSM4909296 | Human | Breast | IDC | 5.07e-05 | 2.44e-02 | 0.1524 |
| 5713 | PSMD7 | GSM4909297 | Human | Breast | IDC | 1.03e-09 | -2.46e-01 | 0.1517 |
| 5713 | PSMD7 | GSM4909311 | Human | Breast | IDC | 7.63e-25 | -2.39e-01 | 0.1534 |
| 5713 | PSMD7 | GSM4909312 | Human | Breast | IDC | 4.52e-07 | -1.37e-01 | 0.1552 |
| 5713 | PSMD7 | GSM4909317 | Human | Breast | IDC | 4.43e-02 | 2.16e-01 | 0.1355 |
| 5713 | PSMD7 | GSM4909319 | Human | Breast | IDC | 1.66e-24 | -2.80e-01 | 0.1563 |
| 5713 | PSMD7 | GSM4909320 | Human | Breast | IDC | 2.63e-05 | -3.19e-01 | 0.1575 |
| 5713 | PSMD7 | GSM4909321 | Human | Breast | IDC | 1.25e-10 | -6.26e-02 | 0.1559 |
| 5713 | PSMD7 | brca1 | Human | Breast | Precancer | 1.22e-35 | 7.24e-01 | -0.0338 |
| 5713 | PSMD7 | brca2 | Human | Breast | Precancer | 3.63e-11 | 4.02e-01 | -0.024 |
| 5713 | PSMD7 | brca3 | Human | Breast | Precancer | 1.70e-10 | 3.70e-01 | -0.0263 |
| 5713 | PSMD7 | NCCBC14 | Human | Breast | DCIS | 2.51e-02 | 5.19e-02 | 0.2021 |
| 5713 | PSMD7 | NCCBC2 | Human | Breast | DCIS | 1.90e-02 | 2.09e-03 | 0.1554 |
| 5713 | PSMD7 | NCCBC5 | Human | Breast | DCIS | 3.70e-05 | -1.25e-01 | 0.2046 |
| 5713 | PSMD7 | P1 | Human | Breast | IDC | 2.42e-15 | -9.09e-02 | 0.1527 |
| 5713 | PSMD7 | P2 | Human | Breast | IDC | 4.50e-16 | 6.40e-01 | 0.21 |
| 5713 | PSMD7 | DCIS2 | Human | Breast | DCIS | 1.63e-58 | 1.99e-01 | 0.0085 |
| 5713 | PSMD7 | AEH-subject1 | Human | Endometrium | AEH | 3.31e-03 | -2.05e-01 | -0.3059 |
| Page: 1 2 3 4 5 6 7 8 9 10 |
| Tissue | Expression Dynamics | Abbreviation |
| Breast | 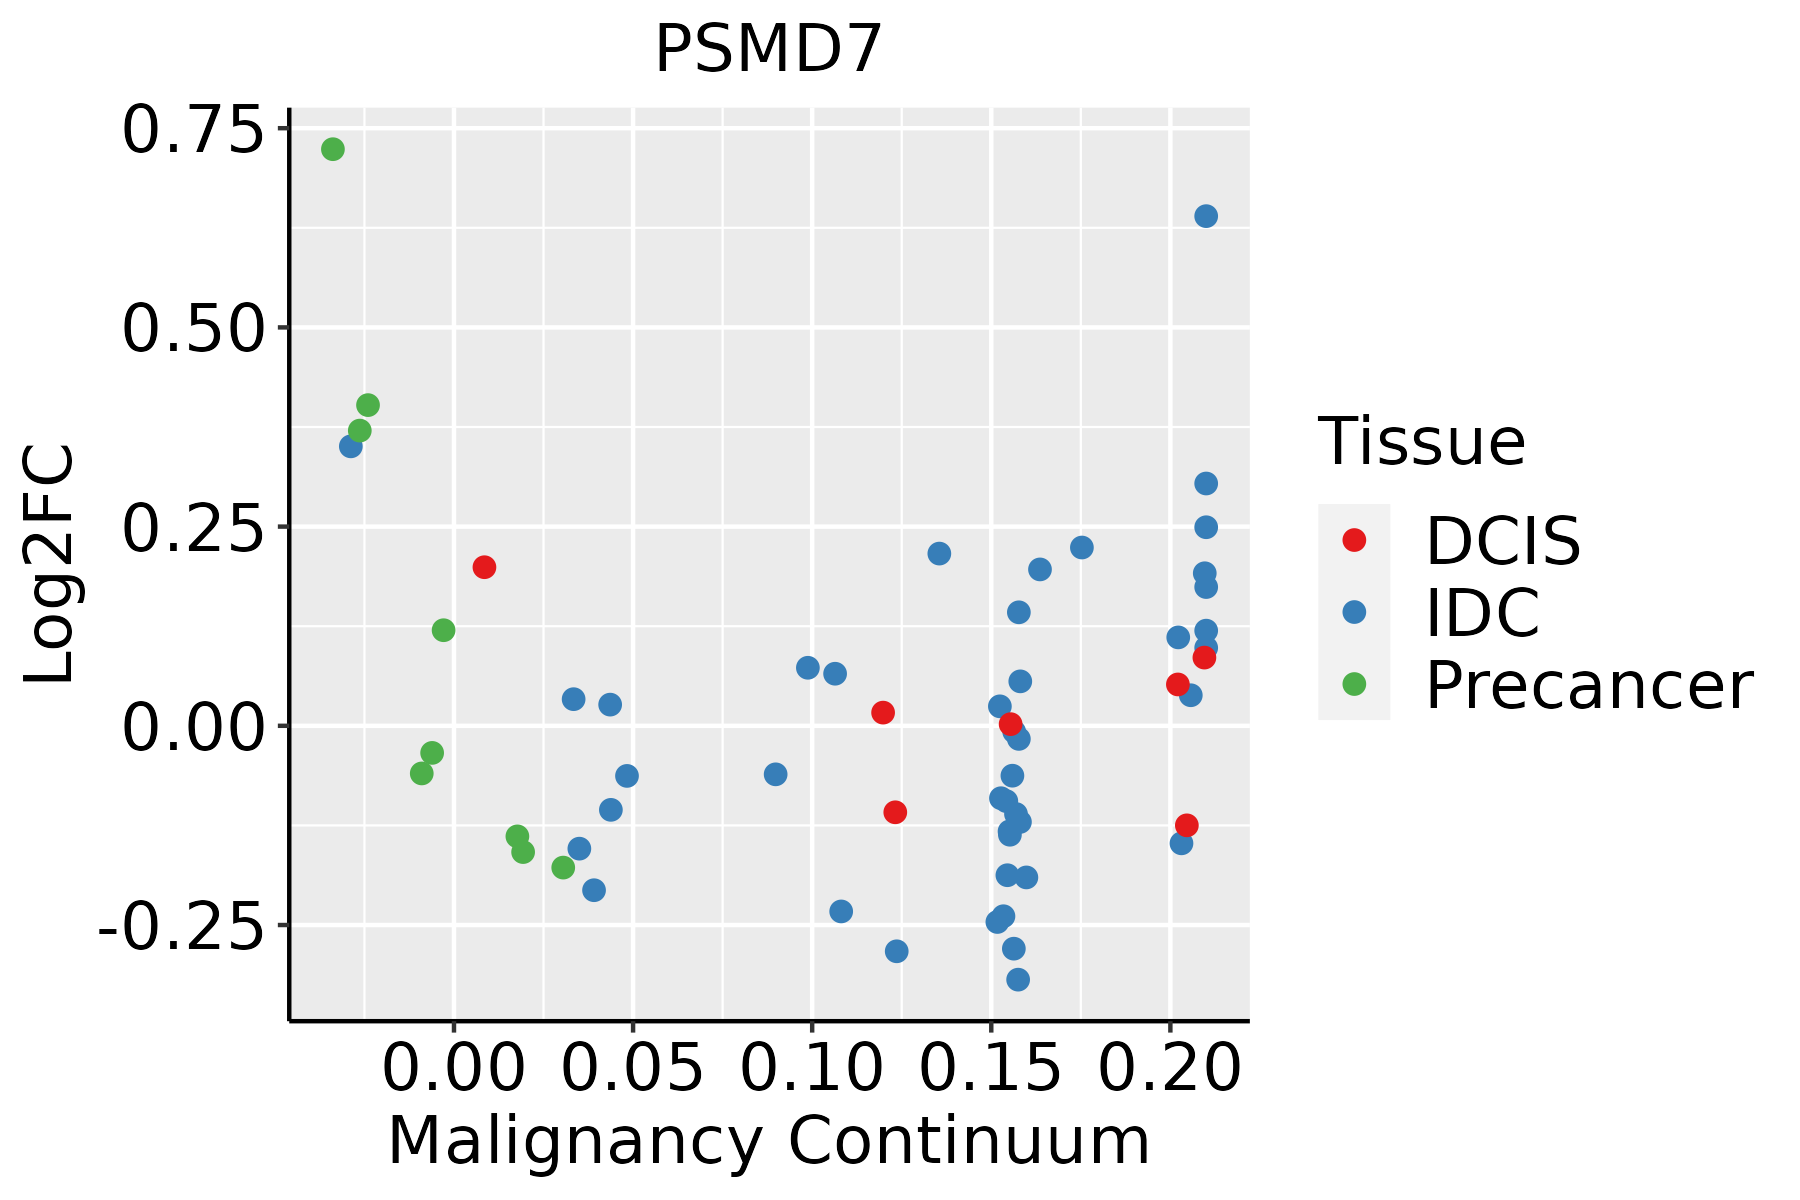 | IDC: Invasive ductal carcinoma |
| DCIS: Ductal carcinoma in situ | ||
| Precancer(BRCA1-mut): Precancerous lesion from BRCA1 mutation carriers | ||
| Endometrium | 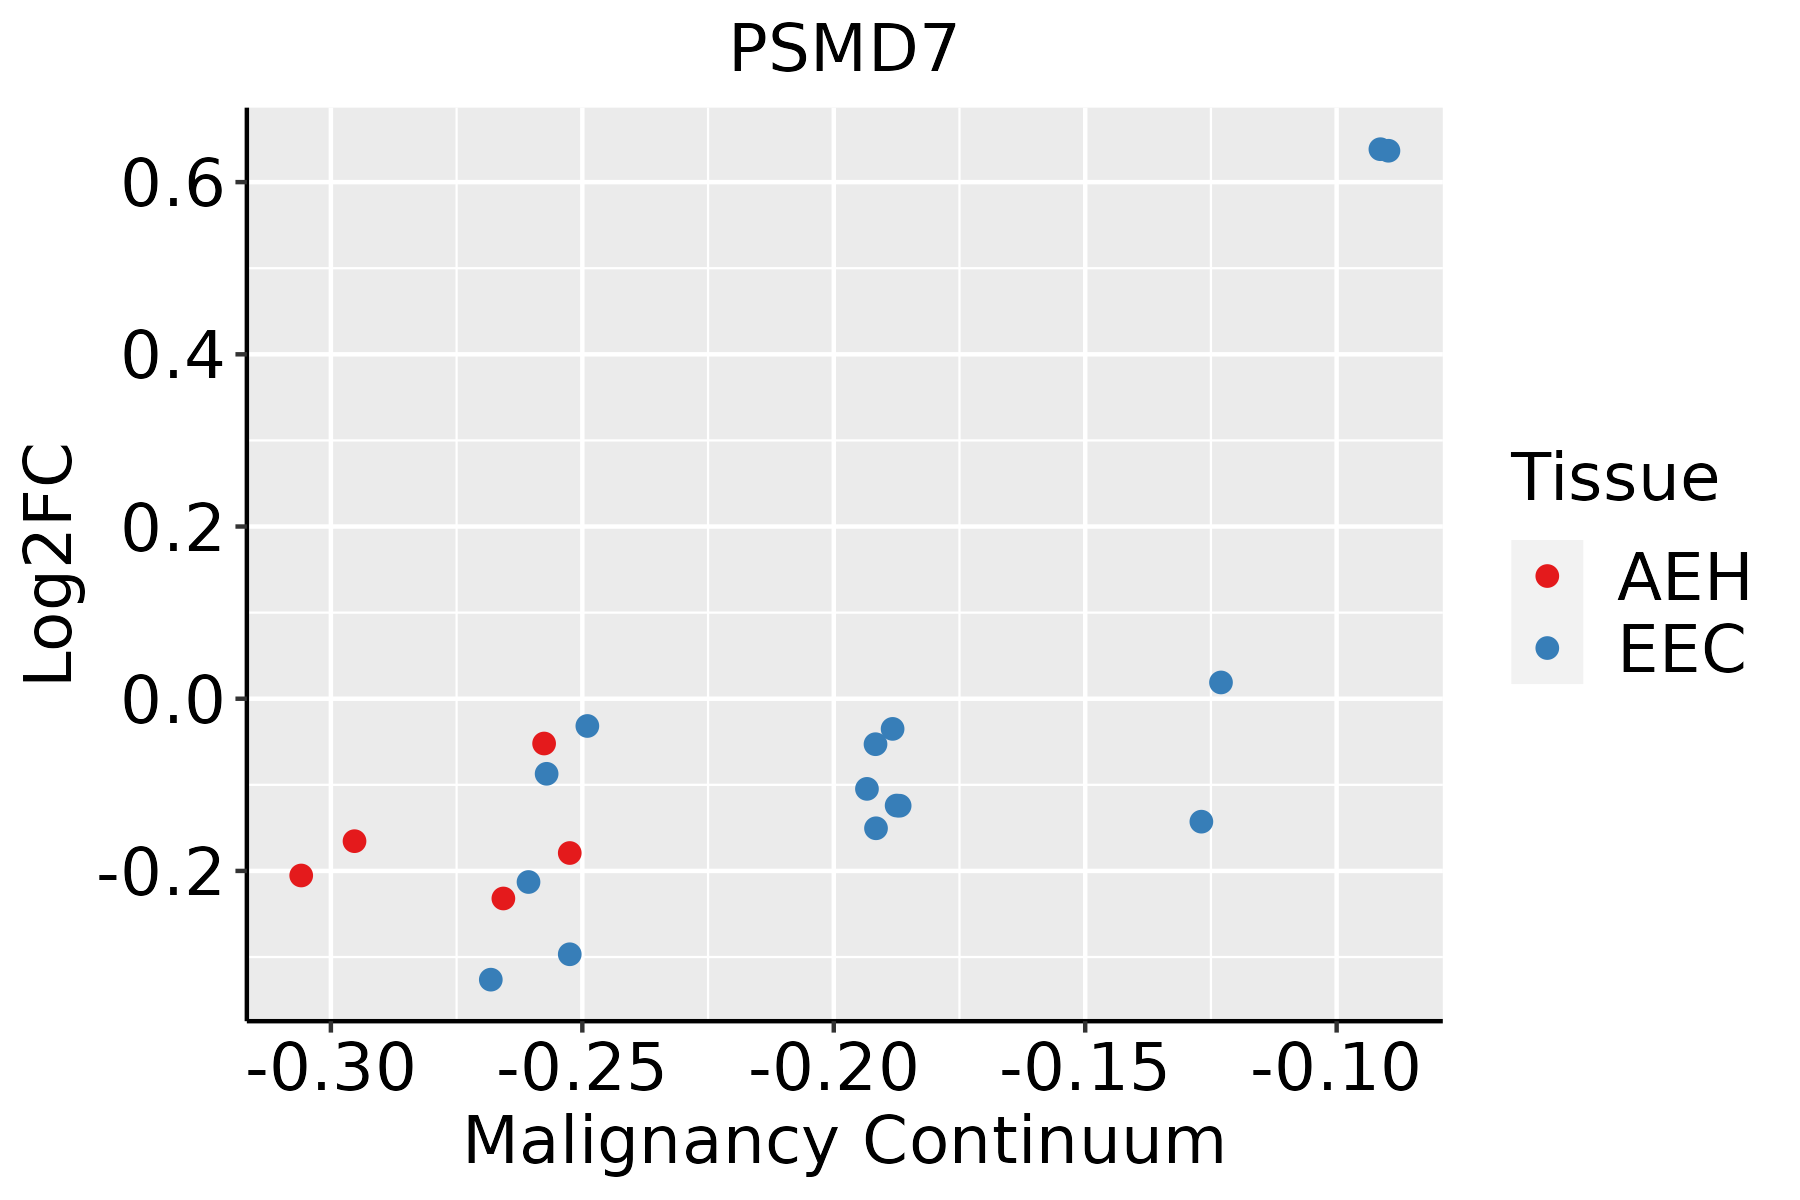 | AEH: Atypical endometrial hyperplasia |
| EEC: Endometrioid Cancer | ||
| Esophagus | 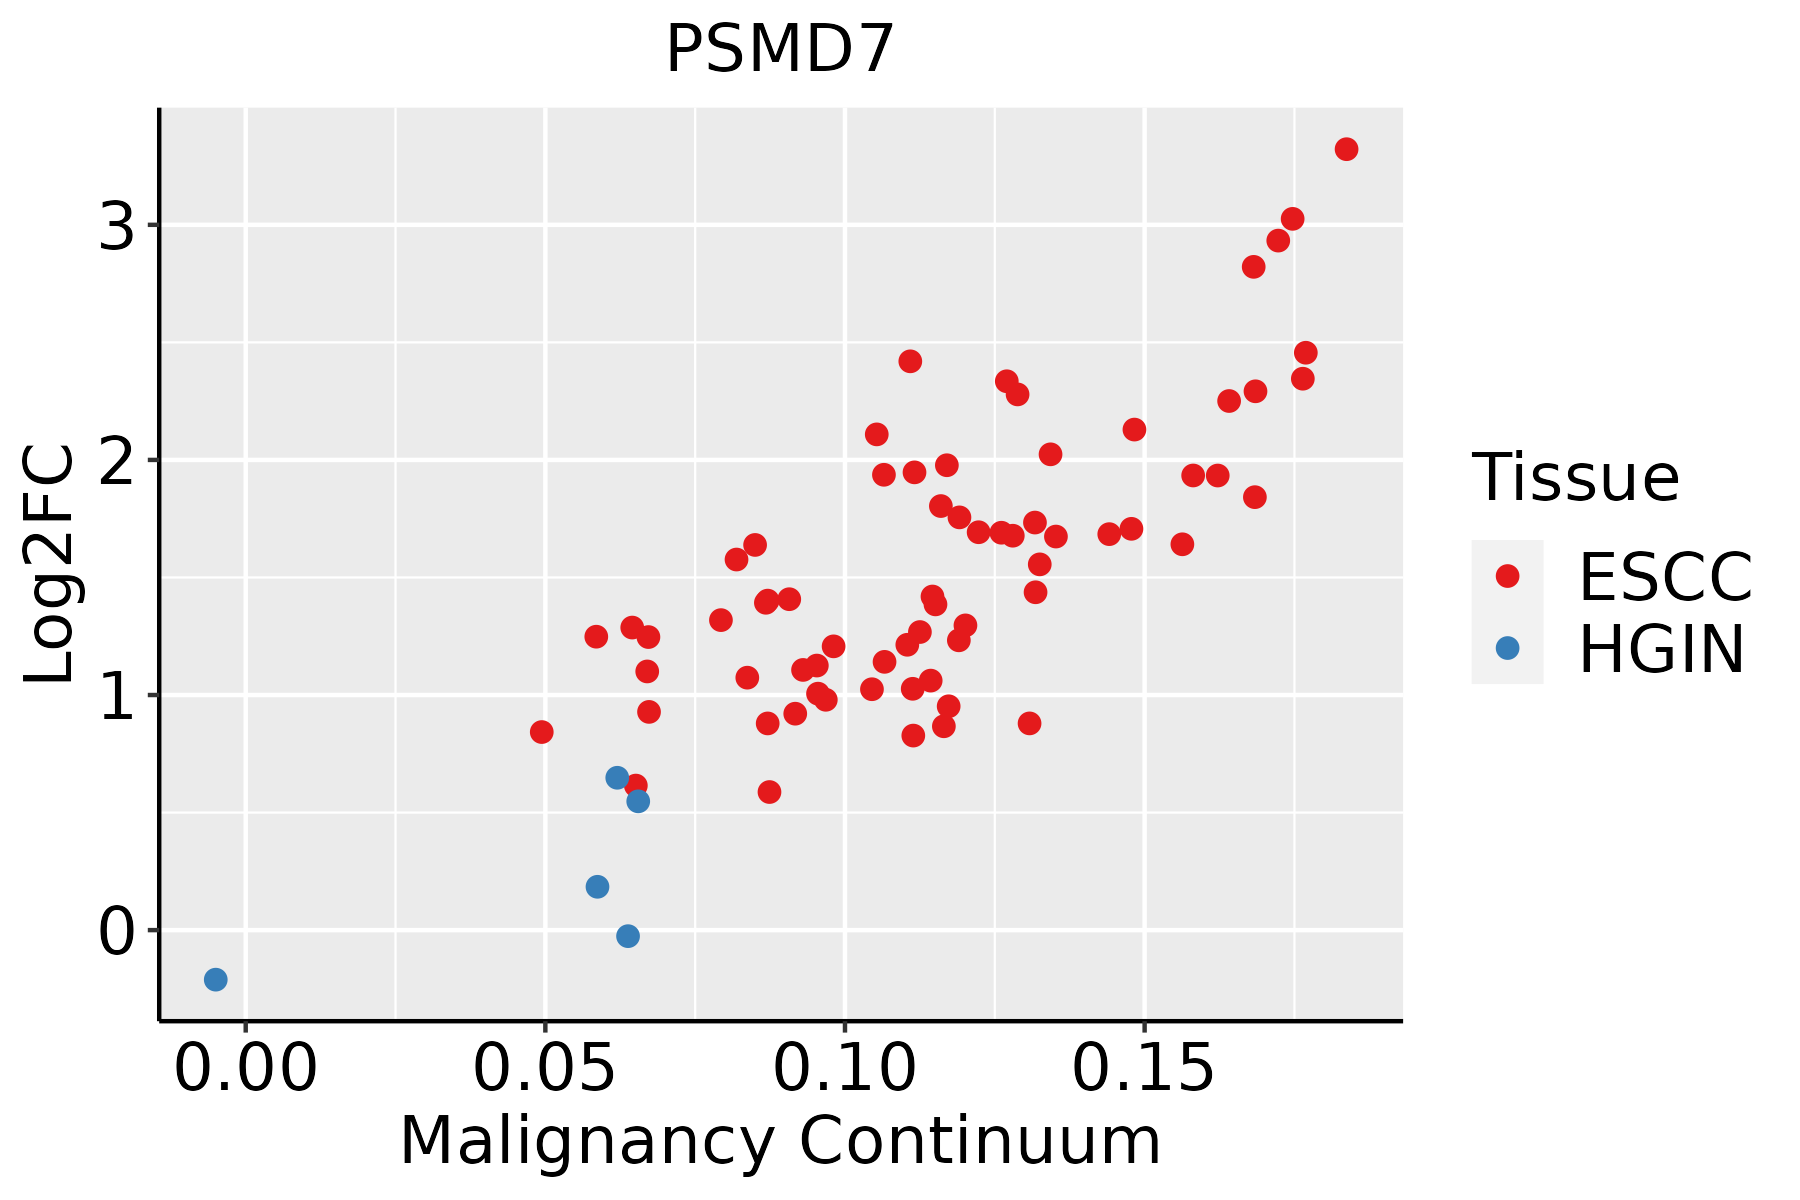 | ESCC: Esophageal squamous cell carcinoma |
| HGIN: High-grade intraepithelial neoplasias | ||
| LGIN: Low-grade intraepithelial neoplasias | ||
| Liver | 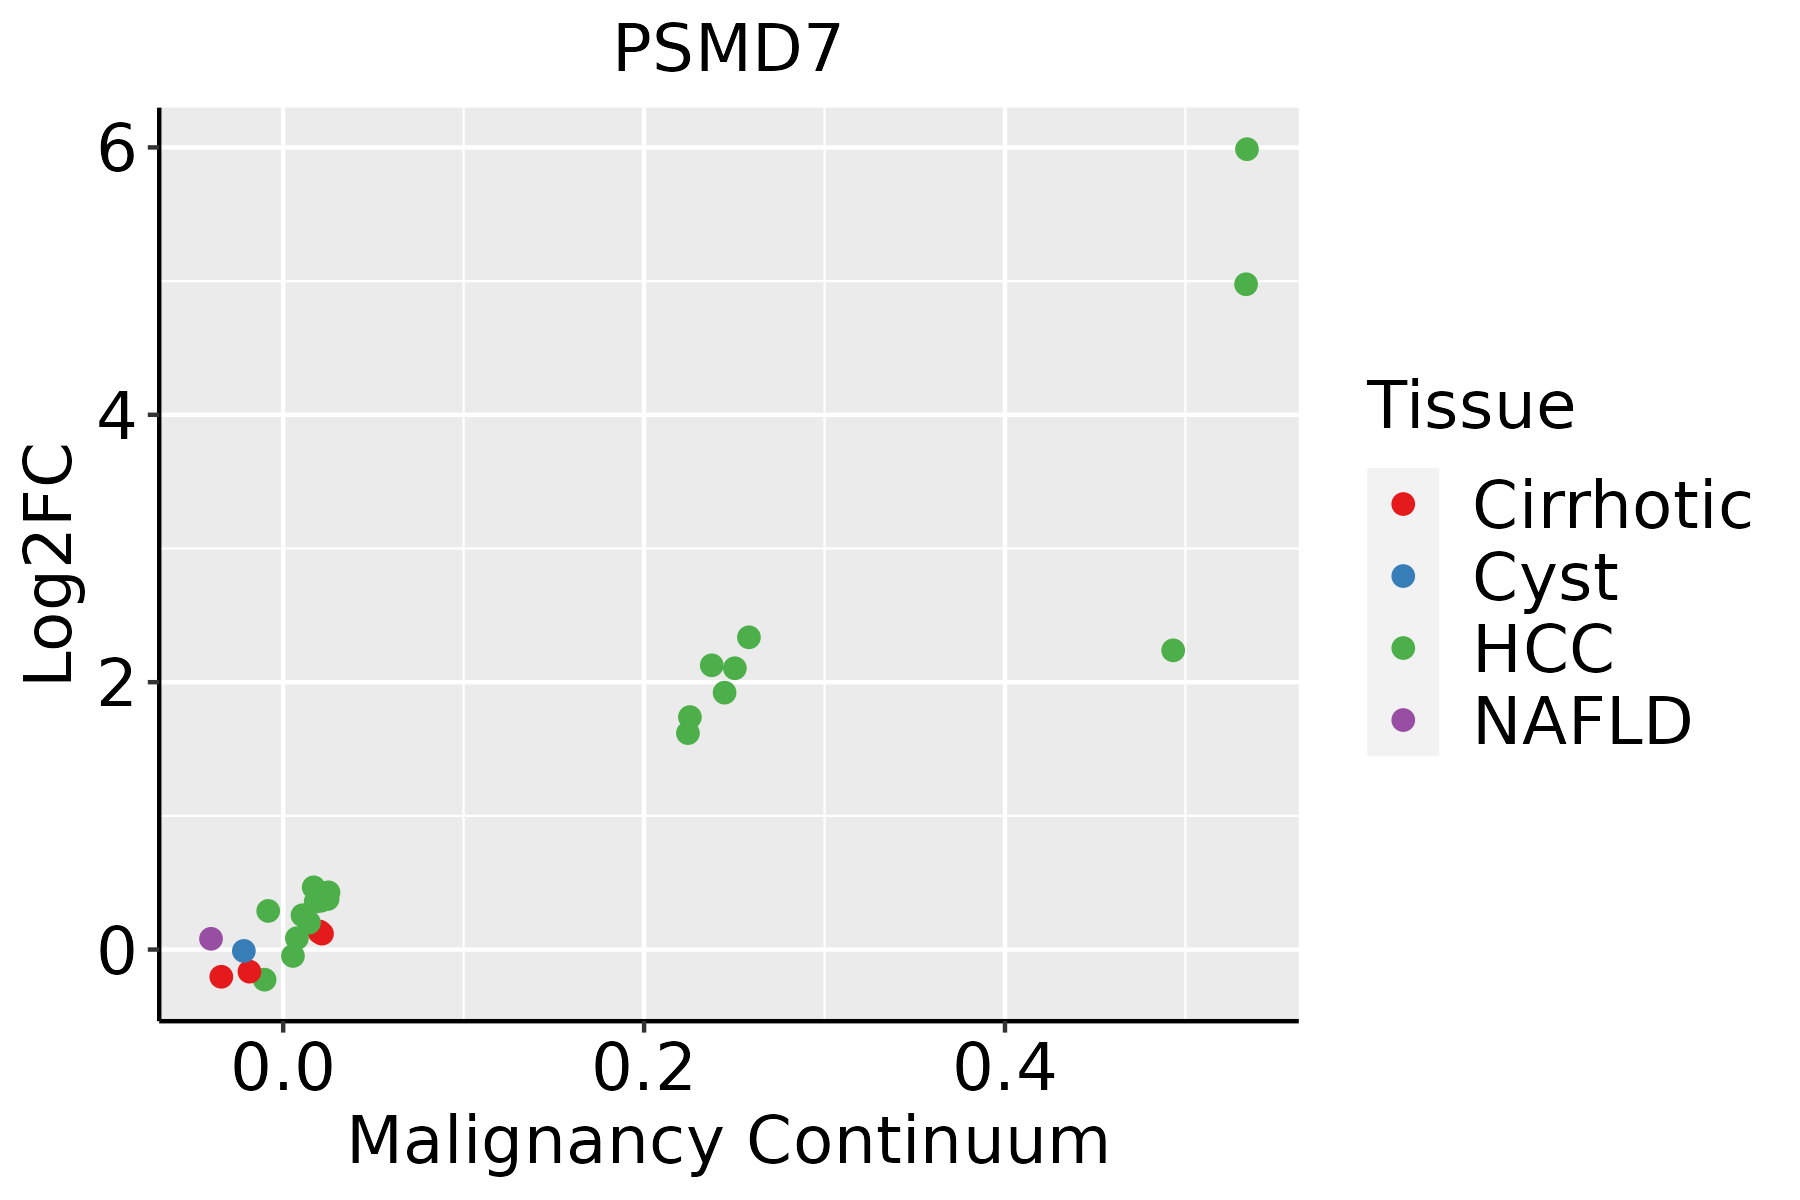 | HCC: Hepatocellular carcinoma |
| NAFLD: Non-alcoholic fatty liver disease | ||
| Oral Cavity | 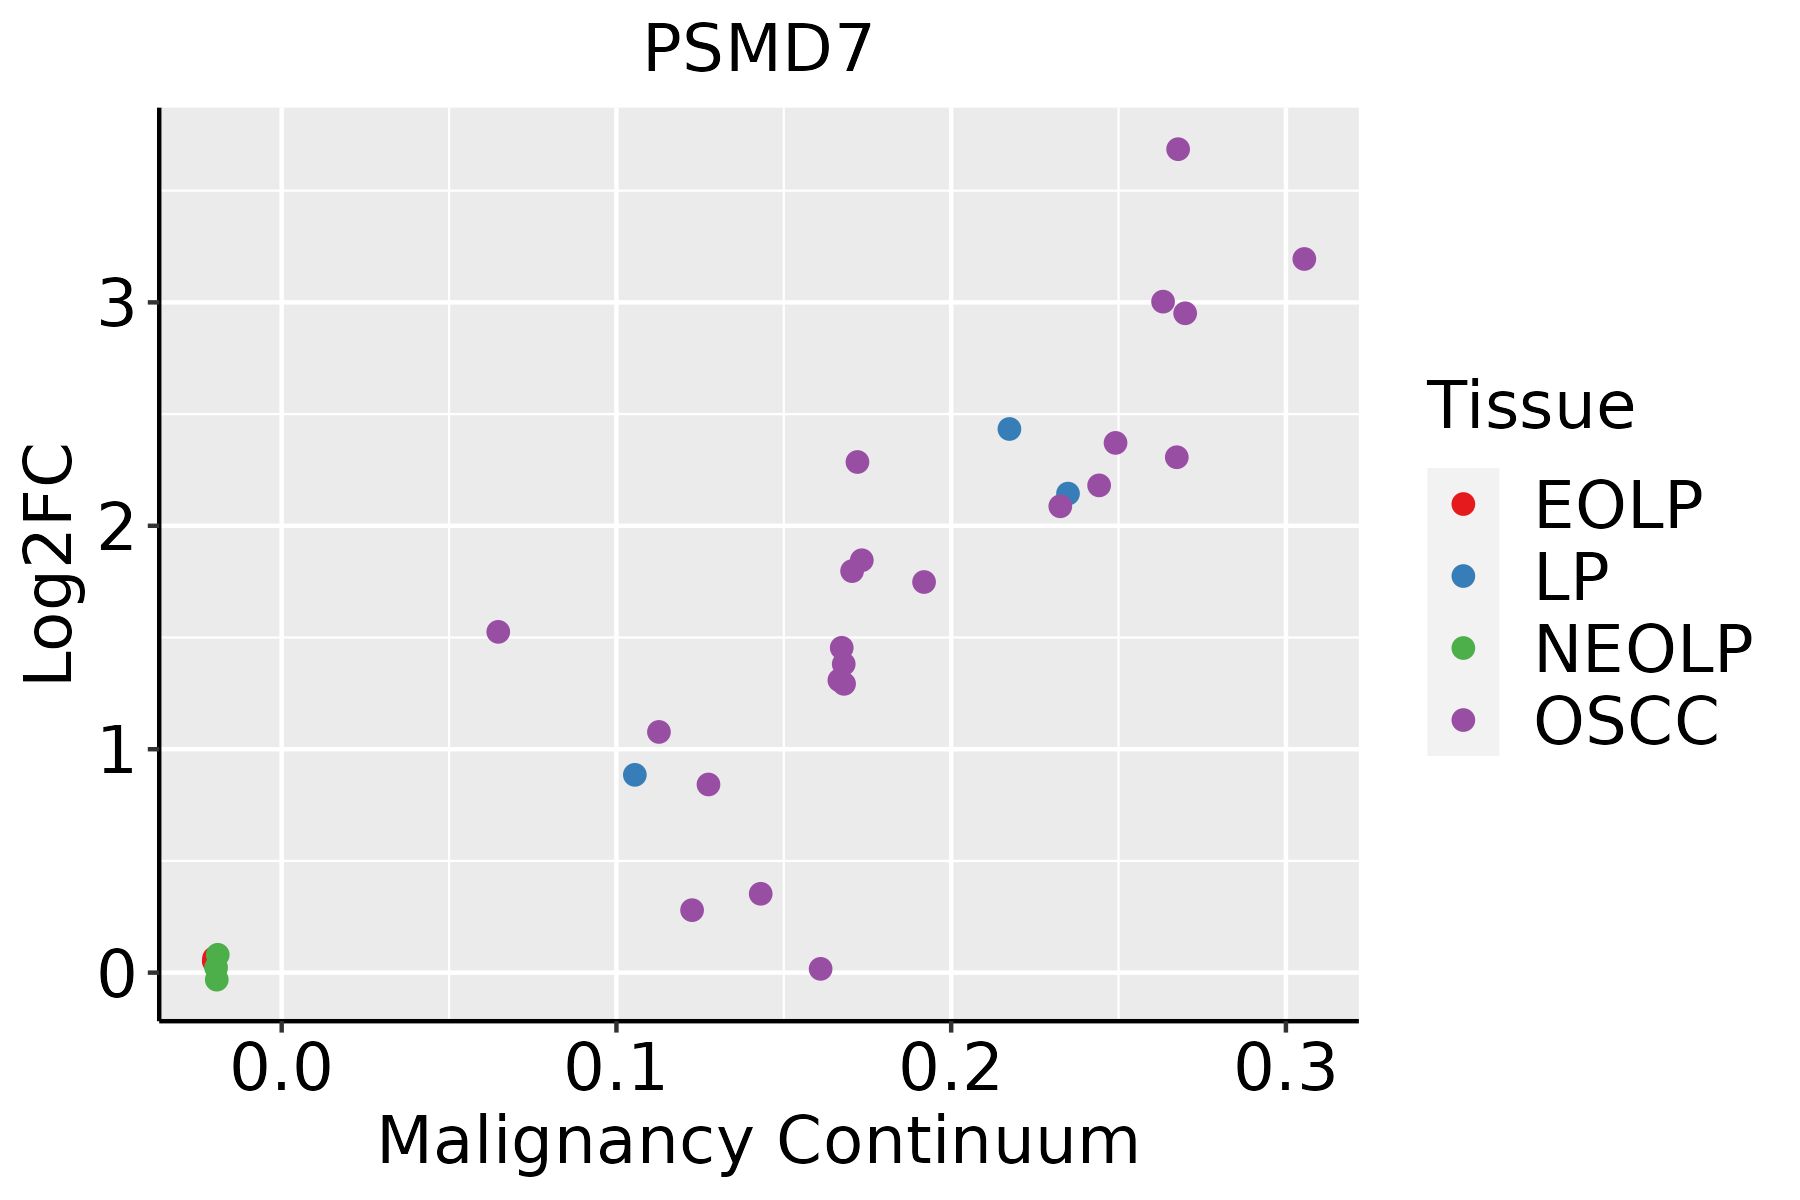 | EOLP: Erosive Oral lichen planus |
| LP: leukoplakia | ||
| NEOLP: Non-erosive oral lichen planus | ||
| OSCC: Oral squamous cell carcinoma | ||
| Prostate | 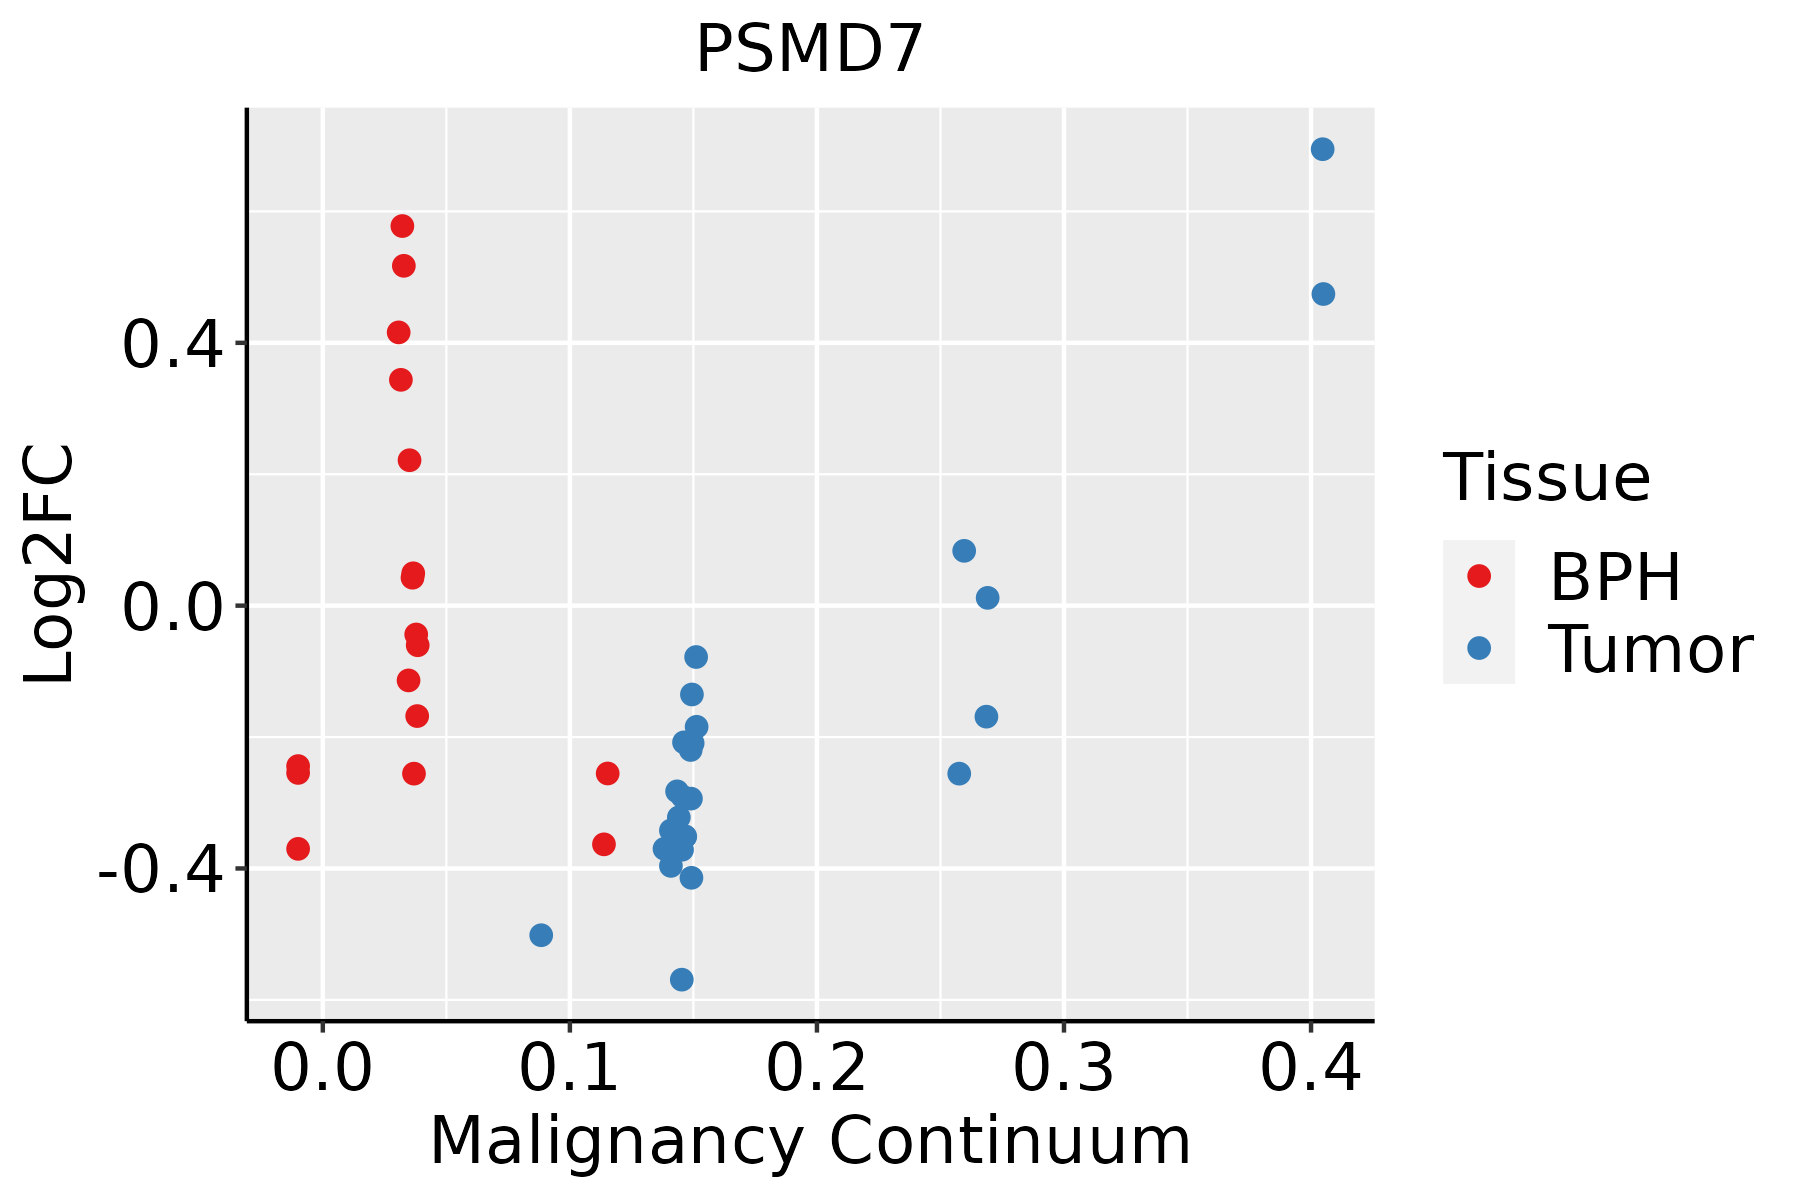 | BPH: Benign Prostatic Hyperplasia |
| Skin | 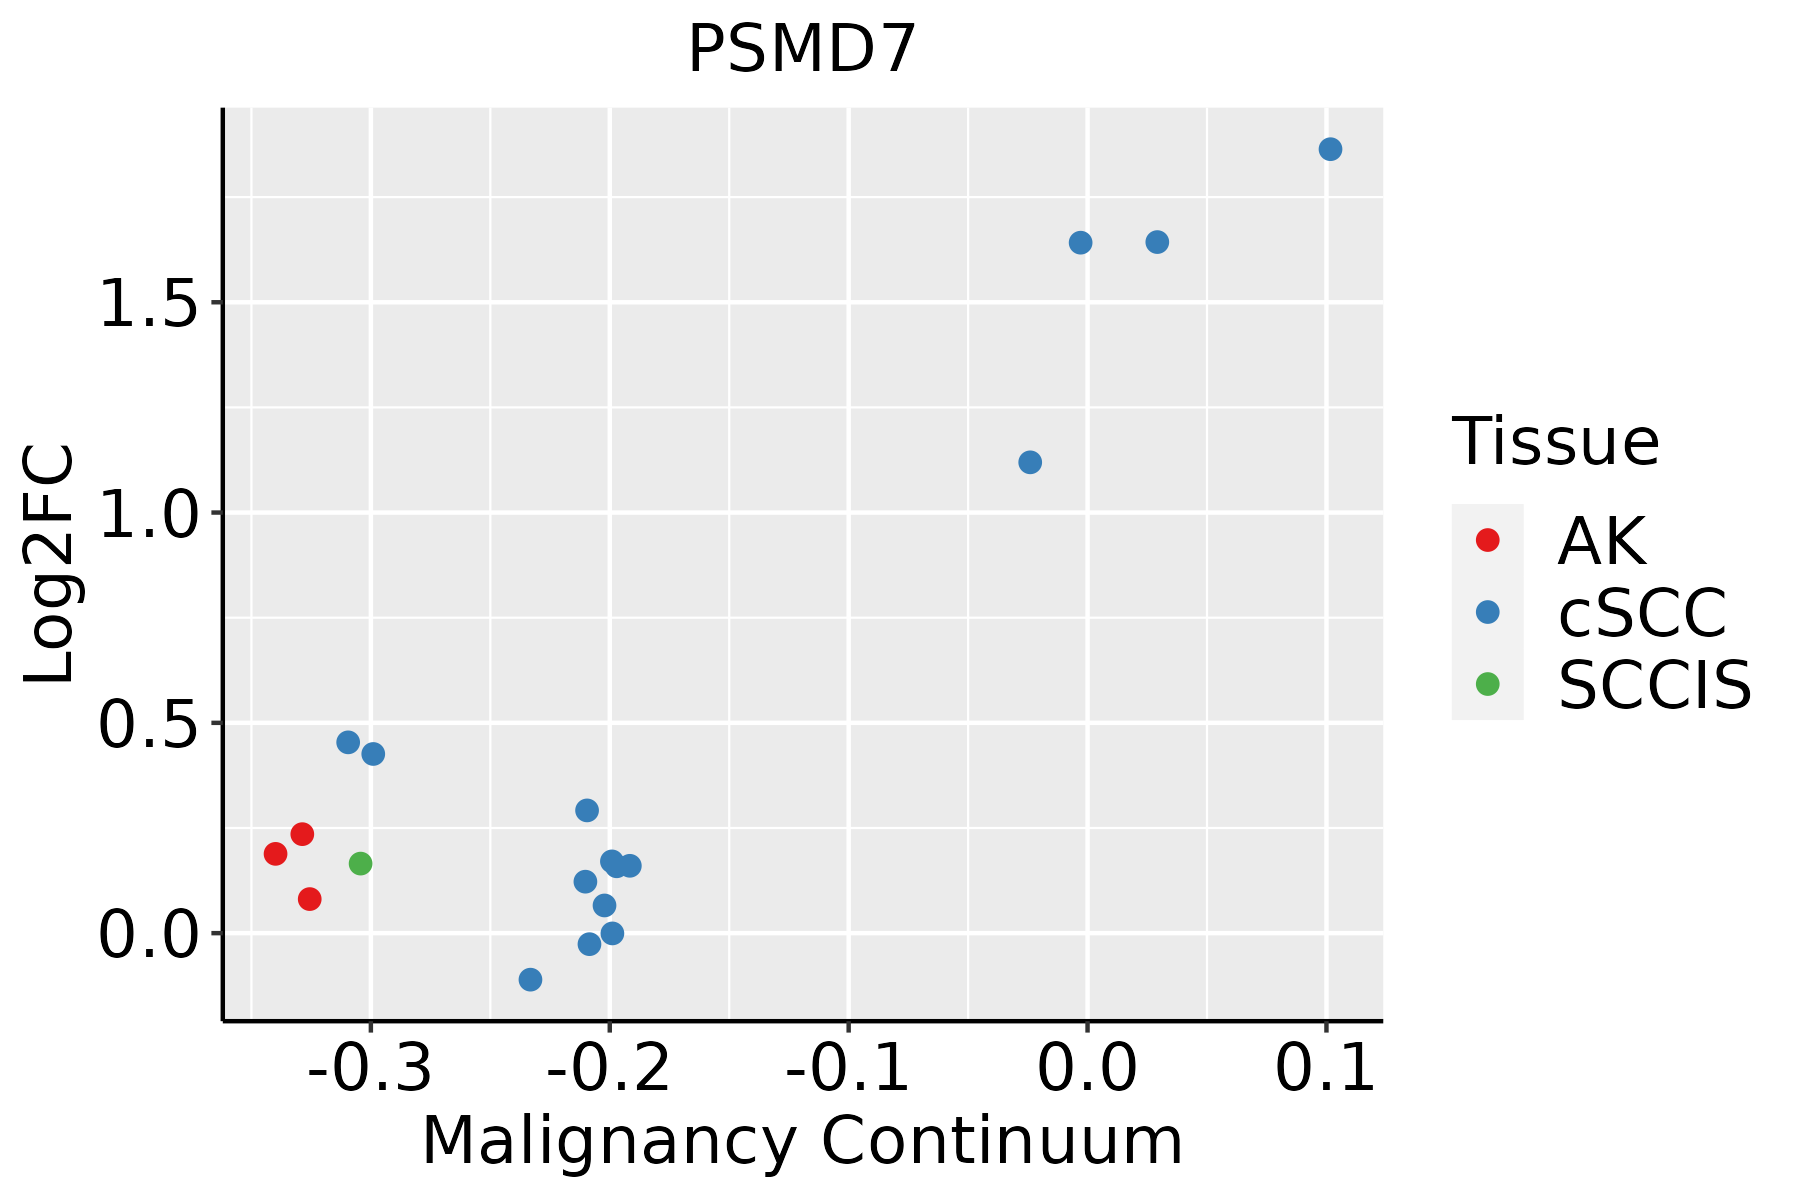 | AK: Actinic keratosis |
| cSCC: Cutaneous squamous cell carcinoma | ||
| SCCIS:squamous cell carcinoma in situ | ||
| Thyroid | 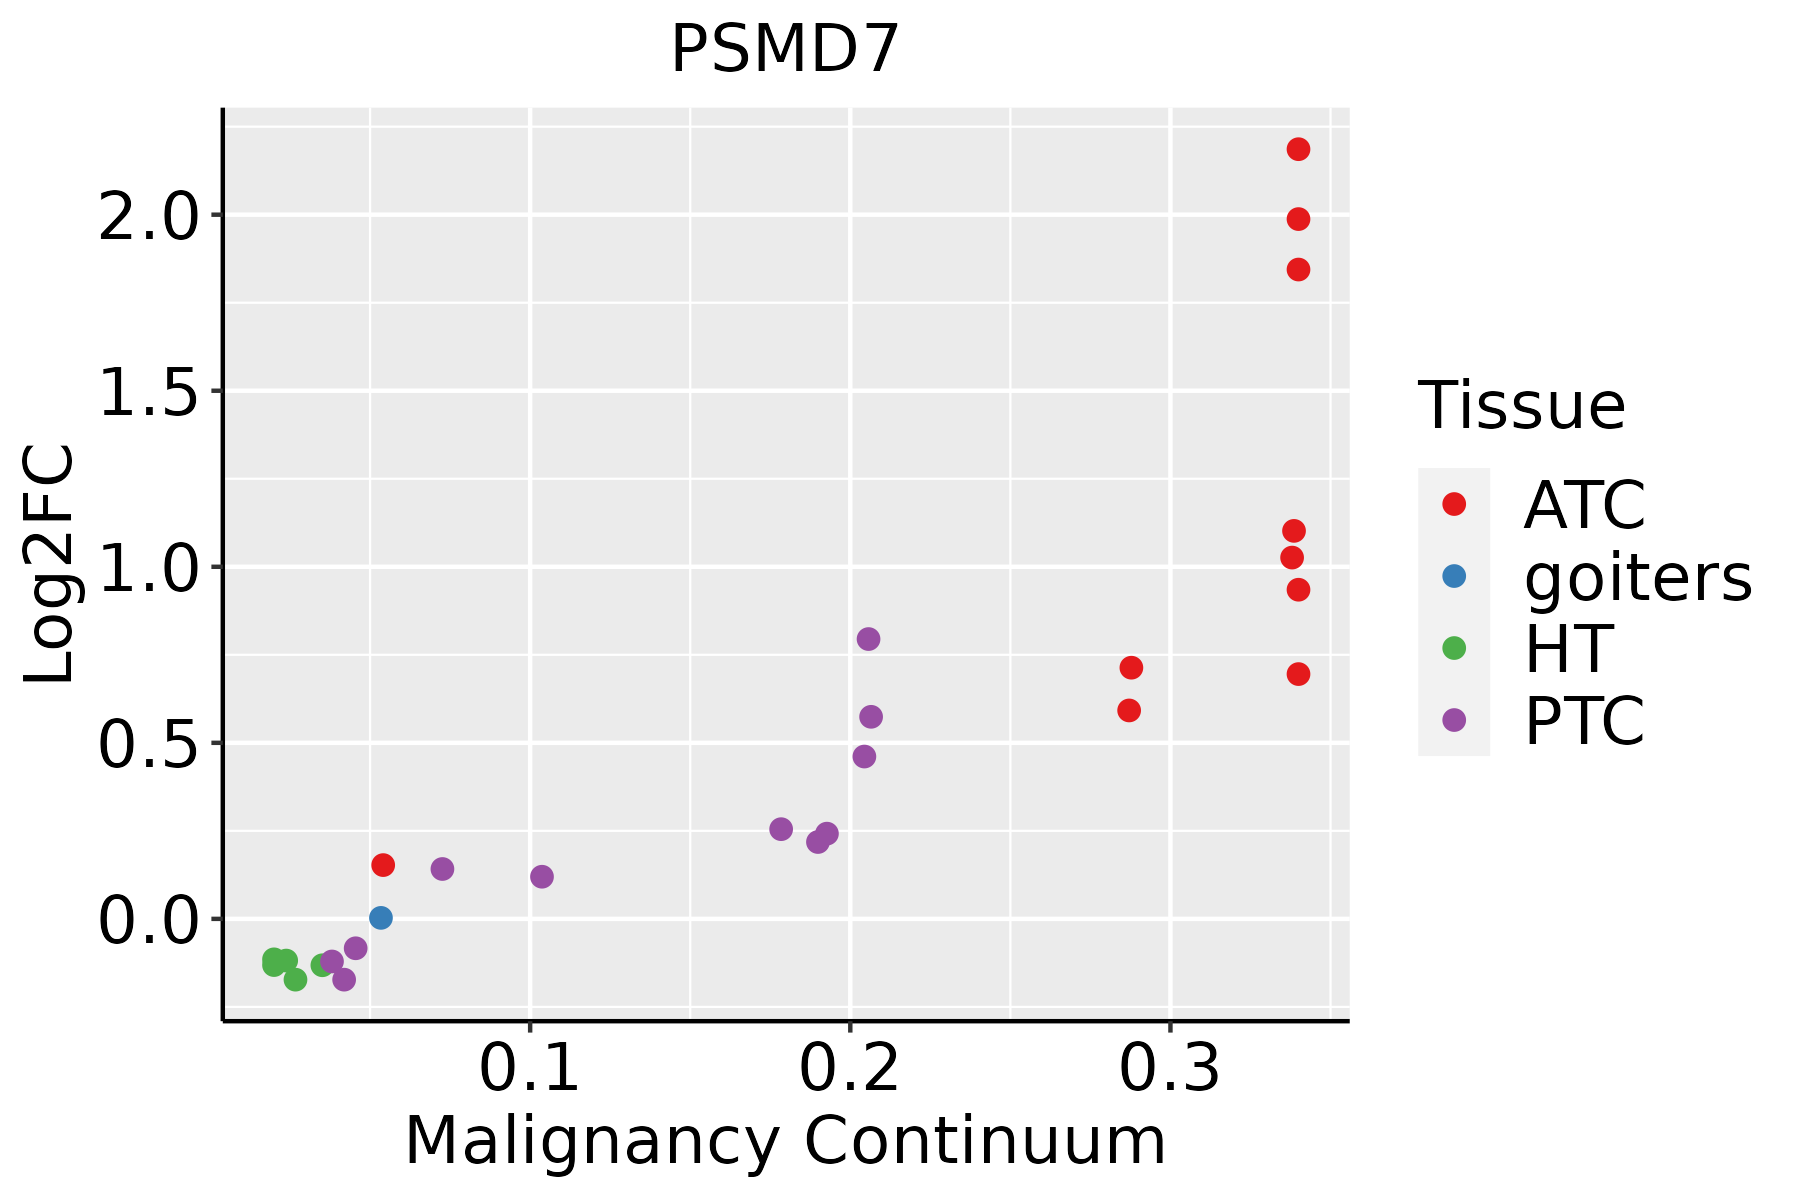 | ATC: Anaplastic thyroid cancer |
| HT: Hashimoto's thyroiditis | ||
| PTC: Papillary thyroid cancer |
| ∗log2FC in expression of this searched gene in stem-like cells from each diseased tissue sample relative to stem-like cells in normal samples in each tissue plotted against the malignancy continuum. Samples are colored based on if they are from different disease stage. |
Top |
Malignant transformation related pathway analysis |
| Find out the enriched GO biological processes and KEGG pathways involved in transition from healthy to precancer to cancer |
| Tissue | Disease Stage | Enriched GO biological Processes |
| Colorectum | AD |  |
| Colorectum | SER |  |
| Colorectum | MSS |  |
| Colorectum | MSI-H |  |
| Colorectum | FAP |  |
| ∗Top 15 enriched GO BP terms are showed in the bar plot of each disease state in each tissue. Each row represents a significant GO biological process which is colored according to the -log10(p.adjust). |
| Page: 1 2 3 4 5 6 7 8 9 |
| GO ID | Tissue | Disease Stage | Description | Gene Ratio | Bg Ratio | pvalue | p.adjust | Count |
| GO:00104989 | Breast | Precancer | proteasomal protein catabolic process | 58/1080 | 490/18723 | 1.54e-07 | 8.05e-06 | 58 |
| GO:00431619 | Breast | Precancer | proteasome-mediated ubiquitin-dependent protein catabolic process | 42/1080 | 412/18723 | 2.49e-04 | 3.72e-03 | 42 |
| GO:001049814 | Breast | IDC | proteasomal protein catabolic process | 75/1434 | 490/18723 | 5.59e-09 | 4.41e-07 | 75 |
| GO:004316114 | Breast | IDC | proteasome-mediated ubiquitin-dependent protein catabolic process | 57/1434 | 412/18723 | 9.55e-06 | 2.68e-04 | 57 |
| GO:001049824 | Breast | DCIS | proteasomal protein catabolic process | 75/1390 | 490/18723 | 1.44e-09 | 1.40e-07 | 75 |
| GO:004316124 | Breast | DCIS | proteasome-mediated ubiquitin-dependent protein catabolic process | 57/1390 | 412/18723 | 3.76e-06 | 1.16e-04 | 57 |
| GO:001049816 | Endometrium | AEH | proteasomal protein catabolic process | 108/2100 | 490/18723 | 2.73e-12 | 4.67e-10 | 108 |
| GO:004316116 | Endometrium | AEH | proteasome-mediated ubiquitin-dependent protein catabolic process | 88/2100 | 412/18723 | 1.54e-09 | 1.36e-07 | 88 |
| GO:001049817 | Endometrium | EEC | proteasomal protein catabolic process | 112/2168 | 490/18723 | 6.99e-13 | 1.40e-10 | 112 |
| GO:004316117 | Endometrium | EEC | proteasome-mediated ubiquitin-dependent protein catabolic process | 92/2168 | 412/18723 | 3.01e-10 | 3.23e-08 | 92 |
| GO:001049826 | Esophagus | HGIN | proteasomal protein catabolic process | 139/2587 | 490/18723 | 1.20e-17 | 3.41e-15 | 139 |
| GO:004316126 | Esophagus | HGIN | proteasome-mediated ubiquitin-dependent protein catabolic process | 114/2587 | 412/18723 | 7.00e-14 | 1.20e-11 | 114 |
| GO:0010498111 | Esophagus | ESCC | proteasomal protein catabolic process | 369/8552 | 490/18723 | 1.13e-41 | 1.80e-38 | 369 |
| GO:0043161111 | Esophagus | ESCC | proteasome-mediated ubiquitin-dependent protein catabolic process | 312/8552 | 412/18723 | 3.53e-36 | 4.48e-33 | 312 |
| GO:001049812 | Liver | Cirrhotic | proteasomal protein catabolic process | 216/4634 | 490/18723 | 2.52e-21 | 9.29e-19 | 216 |
| GO:004316112 | Liver | Cirrhotic | proteasome-mediated ubiquitin-dependent protein catabolic process | 184/4634 | 412/18723 | 4.52e-19 | 8.85e-17 | 184 |
| GO:001049822 | Liver | HCC | proteasomal protein catabolic process | 351/7958 | 490/18723 | 6.92e-40 | 1.46e-36 | 351 |
| GO:004316122 | Liver | HCC | proteasome-mediated ubiquitin-dependent protein catabolic process | 299/7958 | 412/18723 | 7.82e-36 | 8.27e-33 | 299 |
| GO:001049820 | Oral cavity | OSCC | proteasomal protein catabolic process | 336/7305 | 490/18723 | 5.45e-41 | 8.63e-38 | 336 |
| GO:004316120 | Oral cavity | OSCC | proteasome-mediated ubiquitin-dependent protein catabolic process | 285/7305 | 412/18723 | 5.68e-36 | 5.99e-33 | 285 |
| Page: 1 2 |
| Pathway ID | Tissue | Disease Stage | Description | Gene Ratio | Bg Ratio | pvalue | p.adjust | qvalue | Count |
| hsa0501218 | Breast | Precancer | Parkinson disease | 99/684 | 266/8465 | 3.58e-42 | 5.65e-40 | 4.33e-40 | 99 |
| hsa0502016 | Breast | Precancer | Prion disease | 95/684 | 273/8465 | 1.39e-37 | 1.46e-35 | 1.12e-35 | 95 |
| hsa0501616 | Breast | Precancer | Huntington disease | 98/684 | 306/8465 | 2.85e-35 | 2.25e-33 | 1.72e-33 | 98 |
| hsa0501016 | Breast | Precancer | Alzheimer disease | 103/684 | 384/8465 | 1.03e-29 | 4.66e-28 | 3.57e-28 | 103 |
| hsa0501416 | Breast | Precancer | Amyotrophic lateral sclerosis | 98/684 | 364/8465 | 2.13e-28 | 8.41e-27 | 6.44e-27 | 98 |
| hsa0502216 | Breast | Precancer | Pathways of neurodegeneration - multiple diseases | 112/684 | 476/8465 | 6.96e-27 | 2.44e-25 | 1.87e-25 | 112 |
| hsa0305010 | Breast | Precancer | Proteasome | 25/684 | 46/8465 | 4.35e-16 | 9.81e-15 | 7.52e-15 | 25 |
| hsa0501714 | Breast | Precancer | Spinocerebellar ataxia | 29/684 | 143/8465 | 2.79e-06 | 3.83e-05 | 2.94e-05 | 29 |
| hsa0516918 | Breast | Precancer | Epstein-Barr virus infection | 35/684 | 202/8465 | 1.15e-05 | 1.26e-04 | 9.64e-05 | 35 |
| hsa0501219 | Breast | Precancer | Parkinson disease | 99/684 | 266/8465 | 3.58e-42 | 5.65e-40 | 4.33e-40 | 99 |
| hsa0502017 | Breast | Precancer | Prion disease | 95/684 | 273/8465 | 1.39e-37 | 1.46e-35 | 1.12e-35 | 95 |
| hsa0501617 | Breast | Precancer | Huntington disease | 98/684 | 306/8465 | 2.85e-35 | 2.25e-33 | 1.72e-33 | 98 |
| hsa0501017 | Breast | Precancer | Alzheimer disease | 103/684 | 384/8465 | 1.03e-29 | 4.66e-28 | 3.57e-28 | 103 |
| hsa0501417 | Breast | Precancer | Amyotrophic lateral sclerosis | 98/684 | 364/8465 | 2.13e-28 | 8.41e-27 | 6.44e-27 | 98 |
| hsa0502217 | Breast | Precancer | Pathways of neurodegeneration - multiple diseases | 112/684 | 476/8465 | 6.96e-27 | 2.44e-25 | 1.87e-25 | 112 |
| hsa0305013 | Breast | Precancer | Proteasome | 25/684 | 46/8465 | 4.35e-16 | 9.81e-15 | 7.52e-15 | 25 |
| hsa0501715 | Breast | Precancer | Spinocerebellar ataxia | 29/684 | 143/8465 | 2.79e-06 | 3.83e-05 | 2.94e-05 | 29 |
| hsa0516919 | Breast | Precancer | Epstein-Barr virus infection | 35/684 | 202/8465 | 1.15e-05 | 1.26e-04 | 9.64e-05 | 35 |
| hsa0501224 | Breast | IDC | Parkinson disease | 107/867 | 266/8465 | 2.57e-39 | 8.36e-37 | 6.26e-37 | 107 |
| hsa0502023 | Breast | IDC | Prion disease | 102/867 | 273/8465 | 3.70e-34 | 4.01e-32 | 3.00e-32 | 102 |
| Page: 1 2 3 4 5 6 7 8 9 10 11 12 13 |
Top |
Cell-cell communication analysis |
| Identification of potential cell-cell interactions between two cell types and their ligand-receptor pairs for different disease states |
| Ligand | Receptor | LRpair | Pathway | Tissue | Disease Stage |
| Page: 1 |
Top |
Single-cell gene regulatory network inference analysis |
| Find out the significant the regulons (TFs) and the target genes of each regulon across cell types for different disease states |
| TF | Cell Type | Tissue | Disease Stage | Target Gene | RSS | Regulon Activity |
| ∗The dot plots of a searched regulon are shown for all cell subpopulations in each disease state of each tissue based on the regulon specific score inferred using pySCENIC and by calculating the average expression. |
| Page: 1 |
Top |
Somatic mutation of malignant transformation related genes |
| Annotation of somatic variants for genes involved in malignant transformation |
| Hugo Symbol | Variant Class | Variant Classification | dbSNP RS | HGVSc | HGVSp | HGVSp Short | SWISSPROT | BIOTYPE | SIFT | PolyPhen | Tumor Sample Barcode | Tissue | Histology | Sex | Age | Stage | Therapy Types | Drugs | Outcome |
| PSMD7 | SNV | Missense_Mutation | c.148G>A | p.Val50Ile | p.V50I | P51665 | protein_coding | tolerated(0.17) | benign(0.085) | TCGA-AR-A1AI-01 | Breast | breast invasive carcinoma | Female | <65 | I/II | Chemotherapy | cytoxan | PD | |
| PSMD7 | SNV | Missense_Mutation | novel | c.502N>A | p.Glu168Lys | p.E168K | P51665 | protein_coding | deleterious(0.04) | probably_damaging(0.929) | TCGA-PE-A5DE-01 | Breast | breast invasive carcinoma | Female | <65 | I/II | Chemotherapy | taxotere | CR |
| PSMD7 | SNV | Missense_Mutation | novel | c.376N>A | p.Val126Met | p.V126M | P51665 | protein_coding | deleterious(0.05) | possibly_damaging(0.594) | TCGA-ZJ-AAXD-01 | Cervix | cervical & endocervical cancer | Female | <65 | III/IV | Unknown | Unknown | SD |
| PSMD7 | SNV | Missense_Mutation | c.328N>A | p.Glu110Lys | p.E110K | P51665 | protein_coding | deleterious(0) | benign(0.406) | TCGA-AA-3672-01 | Colorectum | colon adenocarcinoma | Female | >=65 | III/IV | Unknown | Unknown | SD | |
| PSMD7 | SNV | Missense_Mutation | novel | c.894N>T | p.Lys298Asn | p.K298N | P51665 | protein_coding | tolerated(0.2) | probably_damaging(0.95) | TCGA-F5-6814-01 | Colorectum | rectum adenocarcinoma | Male | <65 | I/II | Unknown | Unknown | SD |
| PSMD7 | SNV | Missense_Mutation | novel | c.383N>T | p.Pro128Leu | p.P128L | P51665 | protein_coding | deleterious(0.02) | benign(0.014) | TCGA-A5-A0G2-01 | Endometrium | uterine corpus endometrioid carcinoma | Female | <65 | III/IV | Unknown | Unknown | SD |
| PSMD7 | SNV | Missense_Mutation | rs575506029 | c.569N>A | p.Arg190Gln | p.R190Q | P51665 | protein_coding | tolerated(0.16) | benign(0.036) | TCGA-A5-A1OF-01 | Endometrium | uterine corpus endometrioid carcinoma | Female | <65 | I/II | Unknown | Unknown | SD |
| PSMD7 | SNV | Missense_Mutation | novel | c.504N>T | p.Glu168Asp | p.E168D | P51665 | protein_coding | deleterious(0) | probably_damaging(0.977) | TCGA-AJ-A23O-01 | Endometrium | uterine corpus endometrioid carcinoma | Female | >=65 | I/II | Unknown | Unknown | SD |
| PSMD7 | SNV | Missense_Mutation | c.661N>T | p.Pro221Ser | p.P221S | P51665 | protein_coding | deleterious(0.05) | possibly_damaging(0.808) | TCGA-AP-A0LM-01 | Endometrium | uterine corpus endometrioid carcinoma | Female | <65 | III/IV | Chemotherapy | cisplatin | SD | |
| PSMD7 | SNV | Missense_Mutation | c.79N>A | p.Gly27Ser | p.G27S | P51665 | protein_coding | tolerated(0.31) | benign(0.006) | TCGA-AP-A0LP-01 | Endometrium | uterine corpus endometrioid carcinoma | Female | >=65 | I/II | Hormone Therapy | megace | SD |
| Page: 1 2 3 |
Top |
Related drugs of malignant transformation related genes |
| Identification of chemicals and drugs interact with genes involved in malignant transfromation |
| (DGIdb 4.0) |
| Entrez ID | Symbol | Category | Interaction Types | Drug Claim Name | Drug Name | PMIDs |
| 5713 | PSMD7 | PROTEASE | PROTEASOME INHIBITOR | 15221960 | ||
| 5713 | PSMD7 | PROTEASE | BORTEZOMIB | BORTEZOMIB | 24524217 | |
| 5713 | PSMD7 | PROTEASE | inhibitor | CARFILZOMIB | CARFILZOMIB | |
| 5713 | PSMD7 | PROTEASE | CARFILZOMIB | CARFILZOMIB | 24524217 | |
| 5713 | PSMD7 | PROTEASE | inhibitor | CHEMBL451887 | CARFILZOMIB | |
| 5713 | PSMD7 | PROTEASE | inhibitor | BORTEZOMIB | BORTEZOMIB | |
| 5713 | PSMD7 | PROTEASE | inhibitor | CHEMBL325041 | BORTEZOMIB | |
| 5713 | PSMD7 | PROTEASE | inhibitor | CHEMBL2103884 | OPROZOMIB | |
| 5713 | PSMD7 | PROTEASE | inhibitor | CHEMBL3545432 | IXAZOMIB CITRATE |
| Page: 1 |

Copyright 2023-Present -The University of Texas Health Science Center at Houston |