
|
|||||
|
 | |
| |
| |
| |
| |
| |
|
Gene: PSMD5 |
Gene summary for PSMD5 |
| Gene information | Species | Human | Gene symbol | PSMD5 | Gene ID | 5711 |
| Gene name | proteasome 26S subunit, non-ATPase 5 | |
| Gene Alias | S5B | |
| Cytomap | 9q33.2 | |
| Gene Type | protein-coding | GO ID | GO:0008150 | UniProtAcc | Q16401 |
Top |
Malignant transformation analysis |
| Identification of the aberrant gene expression in precancerous and cancerous lesions by comparing the gene expression of stem-like cells in diseased tissues with normal stem cells |
| Entrez ID | Symbol | Replicates | Species | Organ | Tissue | Adj P-value | Log2FC | Malignancy |
| 5711 | PSMD5 | LZE2T | Human | Esophagus | ESCC | 5.26e-03 | 2.83e-01 | 0.082 |
| 5711 | PSMD5 | LZE4T | Human | Esophagus | ESCC | 3.57e-14 | 3.70e-01 | 0.0811 |
| 5711 | PSMD5 | LZE5T | Human | Esophagus | ESCC | 2.10e-02 | 1.43e-01 | 0.0514 |
| 5711 | PSMD5 | LZE20T | Human | Esophagus | ESCC | 2.68e-05 | 1.07e-01 | 0.0662 |
| 5711 | PSMD5 | LZE24T | Human | Esophagus | ESCC | 4.98e-07 | 2.51e-01 | 0.0596 |
| 5711 | PSMD5 | LZE21T | Human | Esophagus | ESCC | 4.07e-02 | 1.51e-01 | 0.0655 |
| 5711 | PSMD5 | LZE6T | Human | Esophagus | ESCC | 1.76e-03 | 1.72e-01 | 0.0845 |
| 5711 | PSMD5 | P2T-E | Human | Esophagus | ESCC | 1.90e-19 | 4.96e-01 | 0.1177 |
| 5711 | PSMD5 | P4T-E | Human | Esophagus | ESCC | 5.13e-30 | 4.18e-01 | 0.1323 |
| 5711 | PSMD5 | P5T-E | Human | Esophagus | ESCC | 5.24e-04 | 5.74e-02 | 0.1327 |
| 5711 | PSMD5 | P8T-E | Human | Esophagus | ESCC | 2.62e-17 | 1.74e-01 | 0.0889 |
| 5711 | PSMD5 | P9T-E | Human | Esophagus | ESCC | 5.88e-11 | 1.03e-01 | 0.1131 |
| 5711 | PSMD5 | P10T-E | Human | Esophagus | ESCC | 1.01e-14 | 3.66e-01 | 0.116 |
| 5711 | PSMD5 | P11T-E | Human | Esophagus | ESCC | 5.54e-11 | 4.83e-01 | 0.1426 |
| 5711 | PSMD5 | P12T-E | Human | Esophagus | ESCC | 3.10e-16 | 4.10e-01 | 0.1122 |
| 5711 | PSMD5 | P15T-E | Human | Esophagus | ESCC | 2.10e-19 | 3.36e-01 | 0.1149 |
| 5711 | PSMD5 | P16T-E | Human | Esophagus | ESCC | 7.35e-19 | 4.11e-01 | 0.1153 |
| 5711 | PSMD5 | P17T-E | Human | Esophagus | ESCC | 6.38e-08 | 3.08e-01 | 0.1278 |
| 5711 | PSMD5 | P19T-E | Human | Esophagus | ESCC | 3.79e-04 | 5.19e-01 | 0.1662 |
| 5711 | PSMD5 | P20T-E | Human | Esophagus | ESCC | 2.76e-18 | 1.83e-01 | 0.1124 |
| Page: 1 2 3 4 5 |
| Tissue | Expression Dynamics | Abbreviation |
| Esophagus |  | ESCC: Esophageal squamous cell carcinoma |
| HGIN: High-grade intraepithelial neoplasias | ||
| LGIN: Low-grade intraepithelial neoplasias | ||
| Liver |  | HCC: Hepatocellular carcinoma |
| NAFLD: Non-alcoholic fatty liver disease | ||
| Oral Cavity |  | EOLP: Erosive Oral lichen planus |
| LP: leukoplakia | ||
| NEOLP: Non-erosive oral lichen planus | ||
| OSCC: Oral squamous cell carcinoma | ||
| Skin | 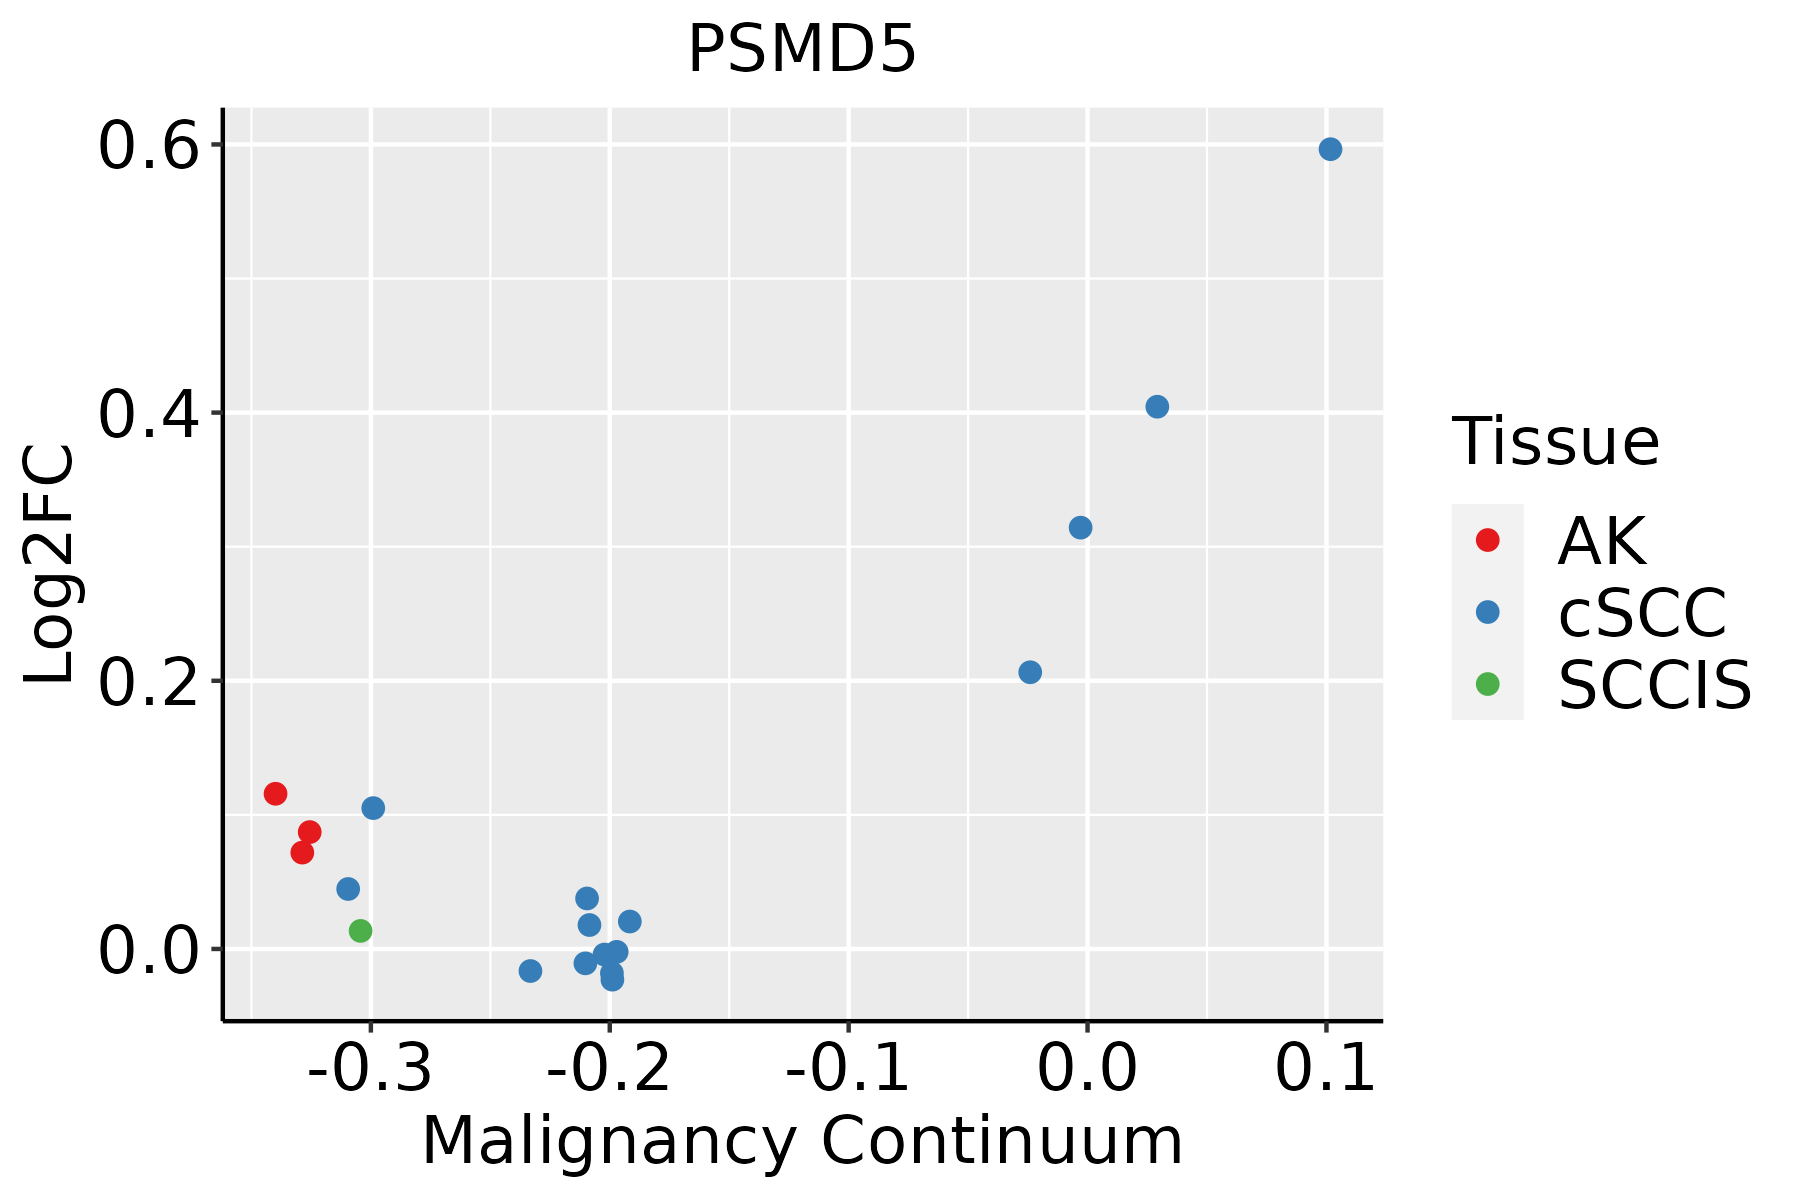 | AK: Actinic keratosis |
| cSCC: Cutaneous squamous cell carcinoma | ||
| SCCIS:squamous cell carcinoma in situ |
| ∗log2FC in expression of this searched gene in stem-like cells from each diseased tissue sample relative to stem-like cells in normal samples in each tissue plotted against the malignancy continuum. Samples are colored based on if they are from different disease stage. |
Top |
Malignant transformation related pathway analysis |
| Find out the enriched GO biological processes and KEGG pathways involved in transition from healthy to precancer to cancer |
| Tissue | Disease Stage | Enriched GO biological Processes |
| Colorectum | AD |  |
| Colorectum | SER |  |
| Colorectum | MSS |  |
| Colorectum | MSI-H |  |
| Colorectum | FAP |  |
| ∗Top 15 enriched GO BP terms are showed in the bar plot of each disease state in each tissue. Each row represents a significant GO biological process which is colored according to the -log10(p.adjust). |
| Page: 1 2 3 4 5 6 7 8 9 |
| GO ID | Tissue | Disease Stage | Description | Gene Ratio | Bg Ratio | pvalue | p.adjust | Count |
| GO:004324811 | Esophagus | ESCC | proteasome assembly | 11/8552 | 12/18723 | 1.26e-03 | 6.06e-03 | 11 |
| GO:00432481 | Liver | HCC | proteasome assembly | 12/7958 | 12/18723 | 3.46e-05 | 3.45e-04 | 12 |
| GO:00432482 | Oral cavity | OSCC | proteasome assembly | 11/7305 | 12/18723 | 2.45e-04 | 1.57e-03 | 11 |
| GO:00432484 | Skin | cSCC | proteasome assembly | 10/4864 | 12/18723 | 5.36e-05 | 5.38e-04 | 10 |
| Page: 1 |
| Pathway ID | Tissue | Disease Stage | Description | Gene Ratio | Bg Ratio | pvalue | p.adjust | qvalue | Count |
| Page: 1 |
Top |
Cell-cell communication analysis |
| Identification of potential cell-cell interactions between two cell types and their ligand-receptor pairs for different disease states |
| Ligand | Receptor | LRpair | Pathway | Tissue | Disease Stage |
| Page: 1 |
Top |
Single-cell gene regulatory network inference analysis |
| Find out the significant the regulons (TFs) and the target genes of each regulon across cell types for different disease states |
| TF | Cell Type | Tissue | Disease Stage | Target Gene | RSS | Regulon Activity |
| ∗The dot plots of a searched regulon are shown for all cell subpopulations in each disease state of each tissue based on the regulon specific score inferred using pySCENIC and by calculating the average expression. |
| Page: 1 |
Top |
Somatic mutation of malignant transformation related genes |
| Annotation of somatic variants for genes involved in malignant transformation |
| Hugo Symbol | Variant Class | Variant Classification | dbSNP RS | HGVSc | HGVSp | HGVSp Short | SWISSPROT | BIOTYPE | SIFT | PolyPhen | Tumor Sample Barcode | Tissue | Histology | Sex | Age | Stage | Therapy Types | Drugs | Outcome |
| PSMD5 | SNV | Missense_Mutation | novel | c.1424N>G | p.Asn475Ser | p.N475S | Q16401 | protein_coding | tolerated(0.44) | benign(0.054) | TCGA-AC-A2FM-01 | Breast | breast invasive carcinoma | Female | >=65 | I/II | Unknown | Unknown | PD |
| PSMD5 | SNV | Missense_Mutation | novel | c.933G>A | p.Met311Ile | p.M311I | Q16401 | protein_coding | deleterious(0.02) | possibly_damaging(0.795) | TCGA-B6-A0IE-01 | Breast | breast invasive carcinoma | Female | <65 | III/IV | Unknown | Unknown | PD |
| PSMD5 | SNV | Missense_Mutation | rs761479099 | c.497N>G | p.Asn166Ser | p.N166S | Q16401 | protein_coding | tolerated(0.54) | benign(0.011) | TCGA-D8-A1JT-01 | Breast | breast invasive carcinoma | Female | >=65 | I/II | Hormone Therapy | arimidex | SD |
| PSMD5 | SNV | Missense_Mutation | c.76C>T | p.His26Tyr | p.H26Y | Q16401 | protein_coding | deleterious(0.01) | benign(0.105) | TCGA-IR-A3LK-01 | Cervix | cervical & endocervical cancer | Female | >=65 | I/II | Chemotherapy | cisplatin | PD | |
| PSMD5 | SNV | Missense_Mutation | rs377476205 | c.1100N>T | p.Ser367Phe | p.S367F | Q16401 | protein_coding | deleterious(0.01) | possibly_damaging(0.878) | TCGA-A6-2680-01 | Colorectum | colon adenocarcinoma | Female | >=65 | I/II | Unknown | Unknown | SD |
| PSMD5 | SNV | Missense_Mutation | c.411N>T | p.Glu137Asp | p.E137D | Q16401 | protein_coding | tolerated(0.29) | benign(0.02) | TCGA-AA-3510-01 | Colorectum | colon adenocarcinoma | Male | >=65 | I/II | Unknown | Unknown | SD | |
| PSMD5 | SNV | Missense_Mutation | c.445N>A | p.Leu149Met | p.L149M | Q16401 | protein_coding | deleterious(0.01) | probably_damaging(0.924) | TCGA-AA-3864-01 | Colorectum | colon adenocarcinoma | Male | >=65 | I/II | Unknown | Unknown | SD | |
| PSMD5 | SNV | Missense_Mutation | novel | c.1409N>A | p.Ala470Glu | p.A470E | Q16401 | protein_coding | deleterious(0.02) | probably_damaging(0.959) | TCGA-AM-5820-01 | Colorectum | colon adenocarcinoma | Female | <65 | I/II | Unknown | Unknown | SD |
| PSMD5 | SNV | Missense_Mutation | rs752722111 | c.1490N>T | p.Thr497Met | p.T497M | Q16401 | protein_coding | deleterious(0.03) | possibly_damaging(0.873) | TCGA-AZ-4308-01 | Colorectum | colon adenocarcinoma | Female | <65 | III/IV | Targeted Molecular therapy | avastin | CR |
| PSMD5 | SNV | Missense_Mutation | rs752722111 | c.1490N>T | p.Thr497Met | p.T497M | Q16401 | protein_coding | deleterious(0.03) | possibly_damaging(0.873) | TCGA-CM-6162-01 | Colorectum | colon adenocarcinoma | Female | <65 | III/IV | Chemotherapy | oxaliplatin | SD |
| Page: 1 2 3 4 5 |
Top |
Related drugs of malignant transformation related genes |
| Identification of chemicals and drugs interact with genes involved in malignant transfromation |
| (DGIdb 4.0) |
| Entrez ID | Symbol | Category | Interaction Types | Drug Claim Name | Drug Name | PMIDs |
| 5711 | PSMD5 | NA | inhibitor | CARFILZOMIB | CARFILZOMIB | |
| 5711 | PSMD5 | NA | inhibitor | BORTEZOMIB | BORTEZOMIB |
| Page: 1 |

Copyright 2023-Present -The University of Texas Health Science Center at Houston |