
|
|||||
|
 | |
| |
| |
| |
| |
| |
|
Gene: PSMD12 |
Gene summary for PSMD12 |
| Gene information | Species | Human | Gene symbol | PSMD12 | Gene ID | 5718 |
| Gene name | proteasome 26S subunit, non-ATPase 12 | |
| Gene Alias | Rpn5 | |
| Cytomap | 17q24.2 | |
| Gene Type | protein-coding | GO ID | GO:0006508 | UniProtAcc | O00232 |
Top |
Malignant transformation analysis |
| Identification of the aberrant gene expression in precancerous and cancerous lesions by comparing the gene expression of stem-like cells in diseased tissues with normal stem cells |
| Entrez ID | Symbol | Replicates | Species | Organ | Tissue | Adj P-value | Log2FC | Malignancy |
| 5718 | PSMD12 | EEC-subject3 | Human | Endometrium | EEC | 4.26e-10 | 4.01e-02 | -0.2525 |
| 5718 | PSMD12 | GSM5276934 | Human | Endometrium | EEC | 5.03e-16 | 5.35e-01 | -0.0913 |
| 5718 | PSMD12 | GSM5276937 | Human | Endometrium | EEC | 9.03e-24 | 6.58e-01 | -0.0897 |
| 5718 | PSMD12 | GSM6177620_NYU_UCEC1_lib1_lib1 | Human | Endometrium | EEC | 8.31e-11 | -3.54e-02 | -0.1869 |
| 5718 | PSMD12 | GSM6177620_NYU_UCEC1_lib2_lib2 | Human | Endometrium | EEC | 1.07e-11 | -2.47e-02 | -0.1875 |
| 5718 | PSMD12 | GSM6177620_NYU_UCEC1_lib3_lib3 | Human | Endometrium | EEC | 2.07e-12 | -1.79e-02 | -0.1883 |
| 5718 | PSMD12 | GSM6177621_NYU_UCEC2_lib1_lib1 | Human | Endometrium | EEC | 6.22e-07 | -3.53e-02 | -0.1934 |
| 5718 | PSMD12 | GSM6177622_NYU_UCEC3_lib1_lib1 | Human | Endometrium | EEC | 4.59e-18 | -1.40e-01 | -0.1917 |
| 5718 | PSMD12 | GSM6177622_NYU_UCEC3_lib2_lib2 | Human | Endometrium | EEC | 1.18e-13 | -5.78e-02 | -0.1916 |
| 5718 | PSMD12 | LZE4T | Human | Esophagus | ESCC | 4.37e-10 | 5.47e-01 | 0.0811 |
| 5718 | PSMD12 | LZE7T | Human | Esophagus | ESCC | 9.46e-05 | 7.99e-01 | 0.0667 |
| 5718 | PSMD12 | LZE8T | Human | Esophagus | ESCC | 6.00e-08 | 3.27e-01 | 0.067 |
| 5718 | PSMD12 | LZE20T | Human | Esophagus | ESCC | 4.19e-02 | 8.82e-02 | 0.0662 |
| 5718 | PSMD12 | LZE22D1 | Human | Esophagus | HGIN | 3.61e-03 | -4.49e-02 | 0.0595 |
| 5718 | PSMD12 | LZE24T | Human | Esophagus | ESCC | 4.19e-17 | 5.81e-01 | 0.0596 |
| 5718 | PSMD12 | LZE6T | Human | Esophagus | ESCC | 8.60e-05 | 7.45e-01 | 0.0845 |
| 5718 | PSMD12 | P1T-E | Human | Esophagus | ESCC | 2.76e-08 | 3.45e-01 | 0.0875 |
| 5718 | PSMD12 | P2T-E | Human | Esophagus | ESCC | 4.27e-40 | 8.52e-01 | 0.1177 |
| 5718 | PSMD12 | P4T-E | Human | Esophagus | ESCC | 2.67e-33 | 8.57e-01 | 0.1323 |
| 5718 | PSMD12 | P5T-E | Human | Esophagus | ESCC | 3.98e-32 | 8.52e-01 | 0.1327 |
| Page: 1 2 3 4 5 6 7 |
| Tissue | Expression Dynamics | Abbreviation |
| Endometrium | 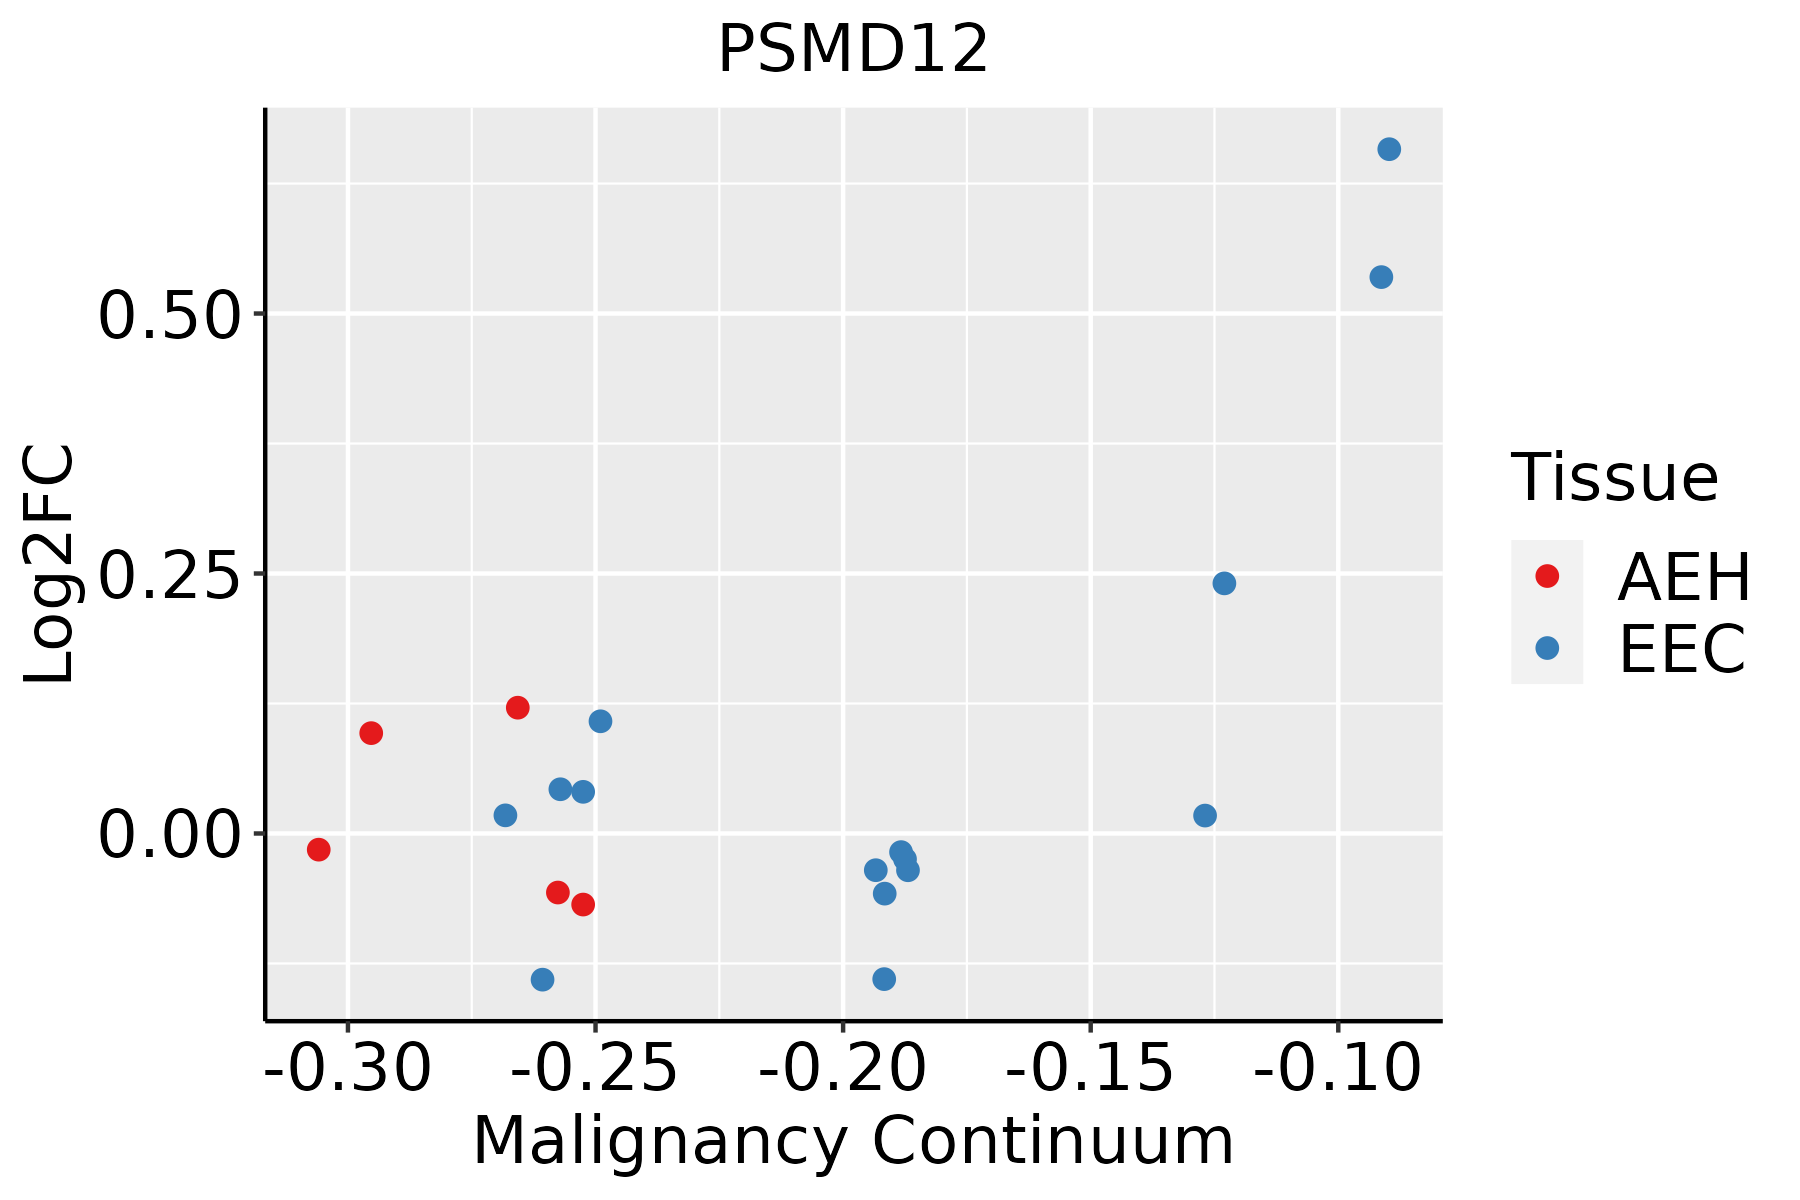 | AEH: Atypical endometrial hyperplasia |
| EEC: Endometrioid Cancer | ||
| Esophagus | 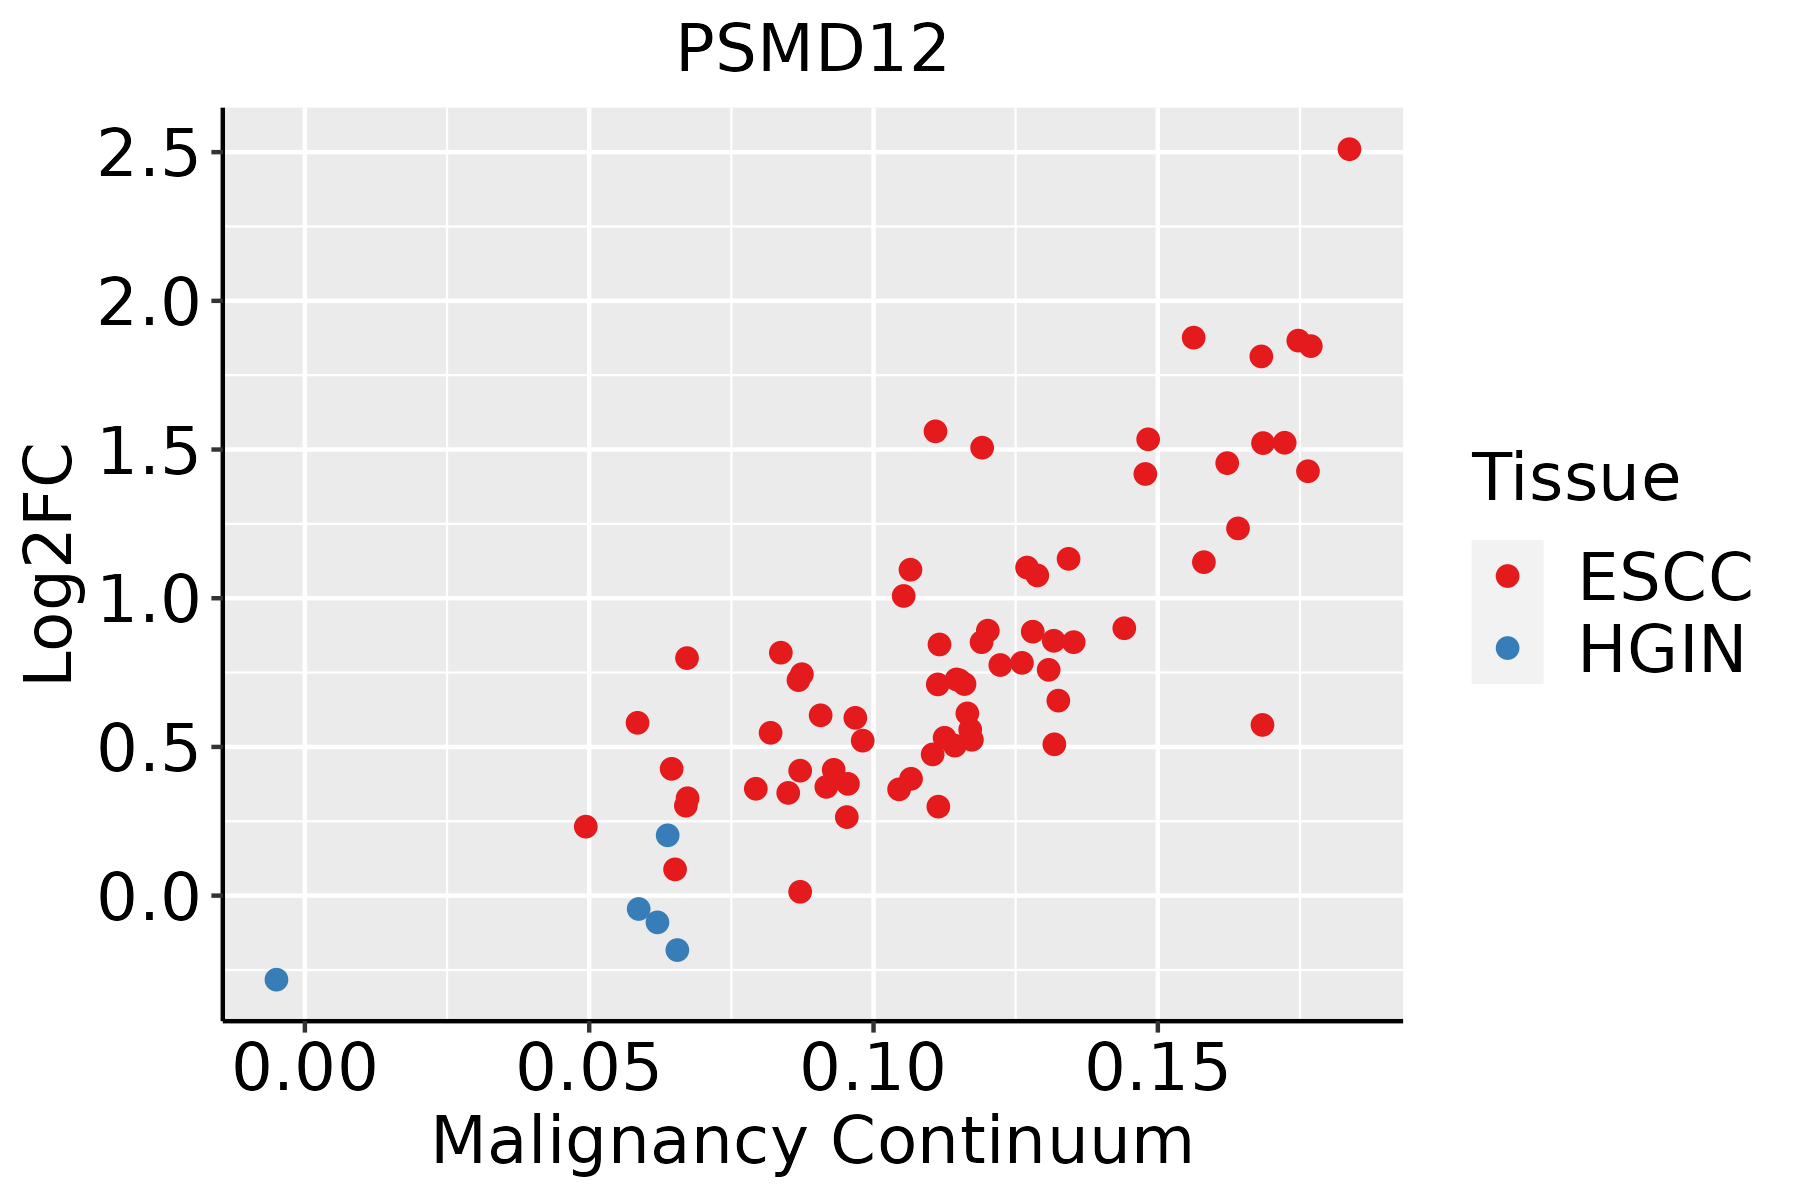 | ESCC: Esophageal squamous cell carcinoma |
| HGIN: High-grade intraepithelial neoplasias | ||
| LGIN: Low-grade intraepithelial neoplasias | ||
| Liver | 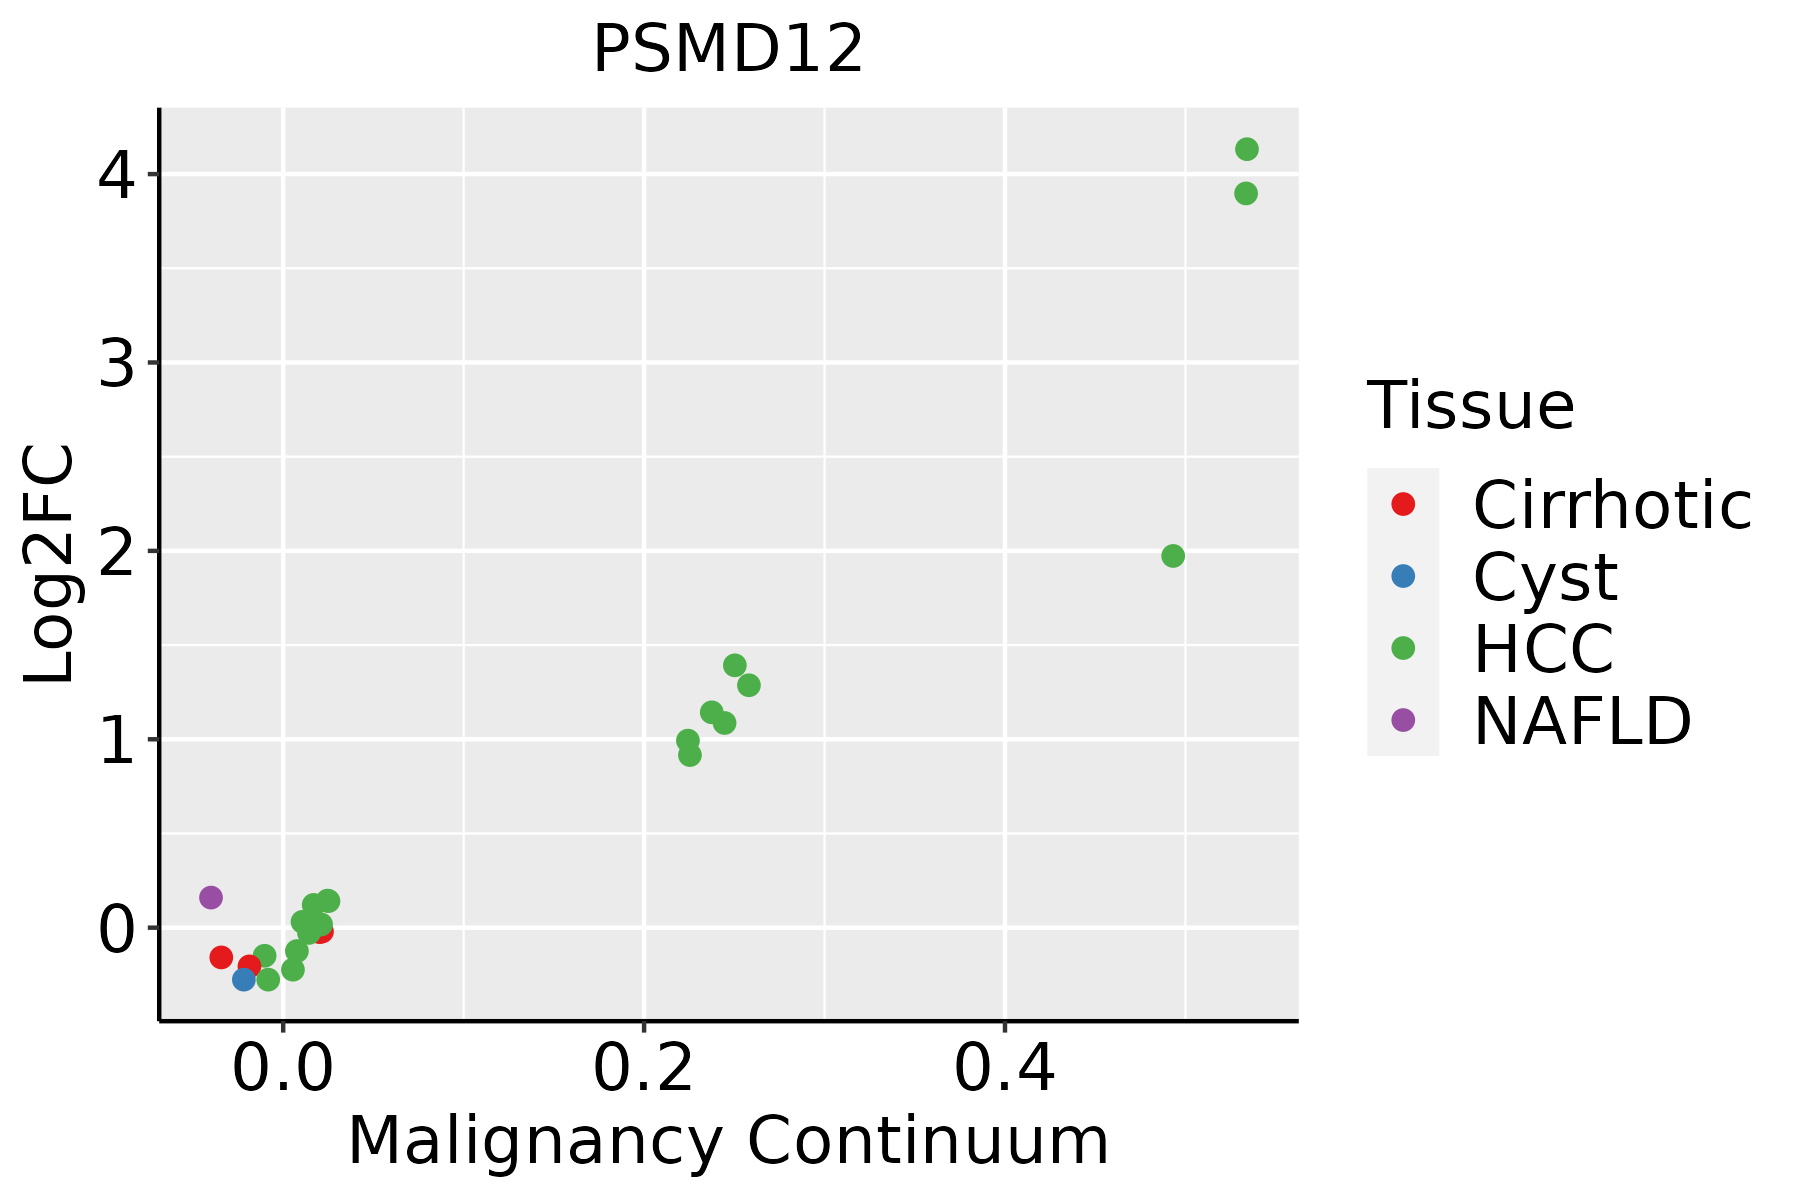 | HCC: Hepatocellular carcinoma |
| NAFLD: Non-alcoholic fatty liver disease | ||
| Oral Cavity |  | EOLP: Erosive Oral lichen planus |
| LP: leukoplakia | ||
| NEOLP: Non-erosive oral lichen planus | ||
| OSCC: Oral squamous cell carcinoma | ||
| Prostate | 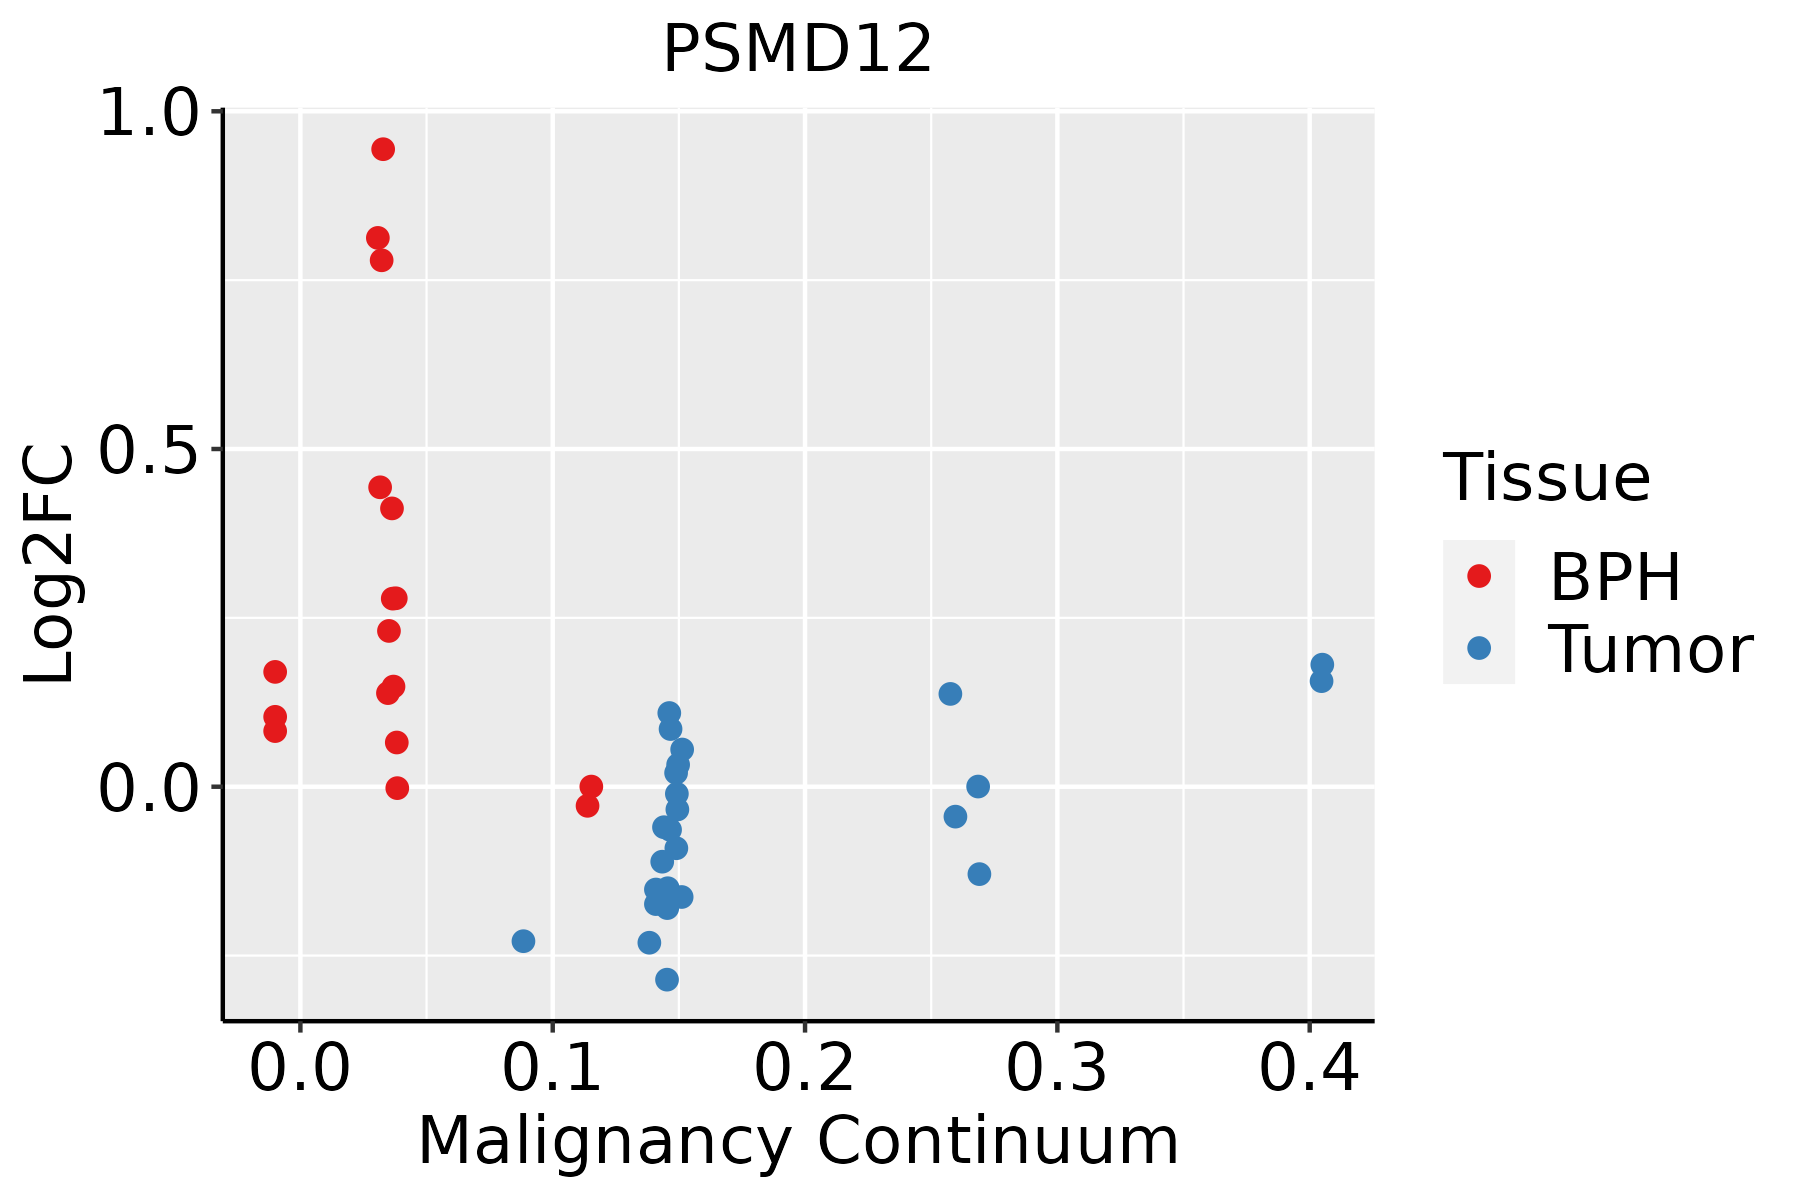 | BPH: Benign Prostatic Hyperplasia |
| Skin | 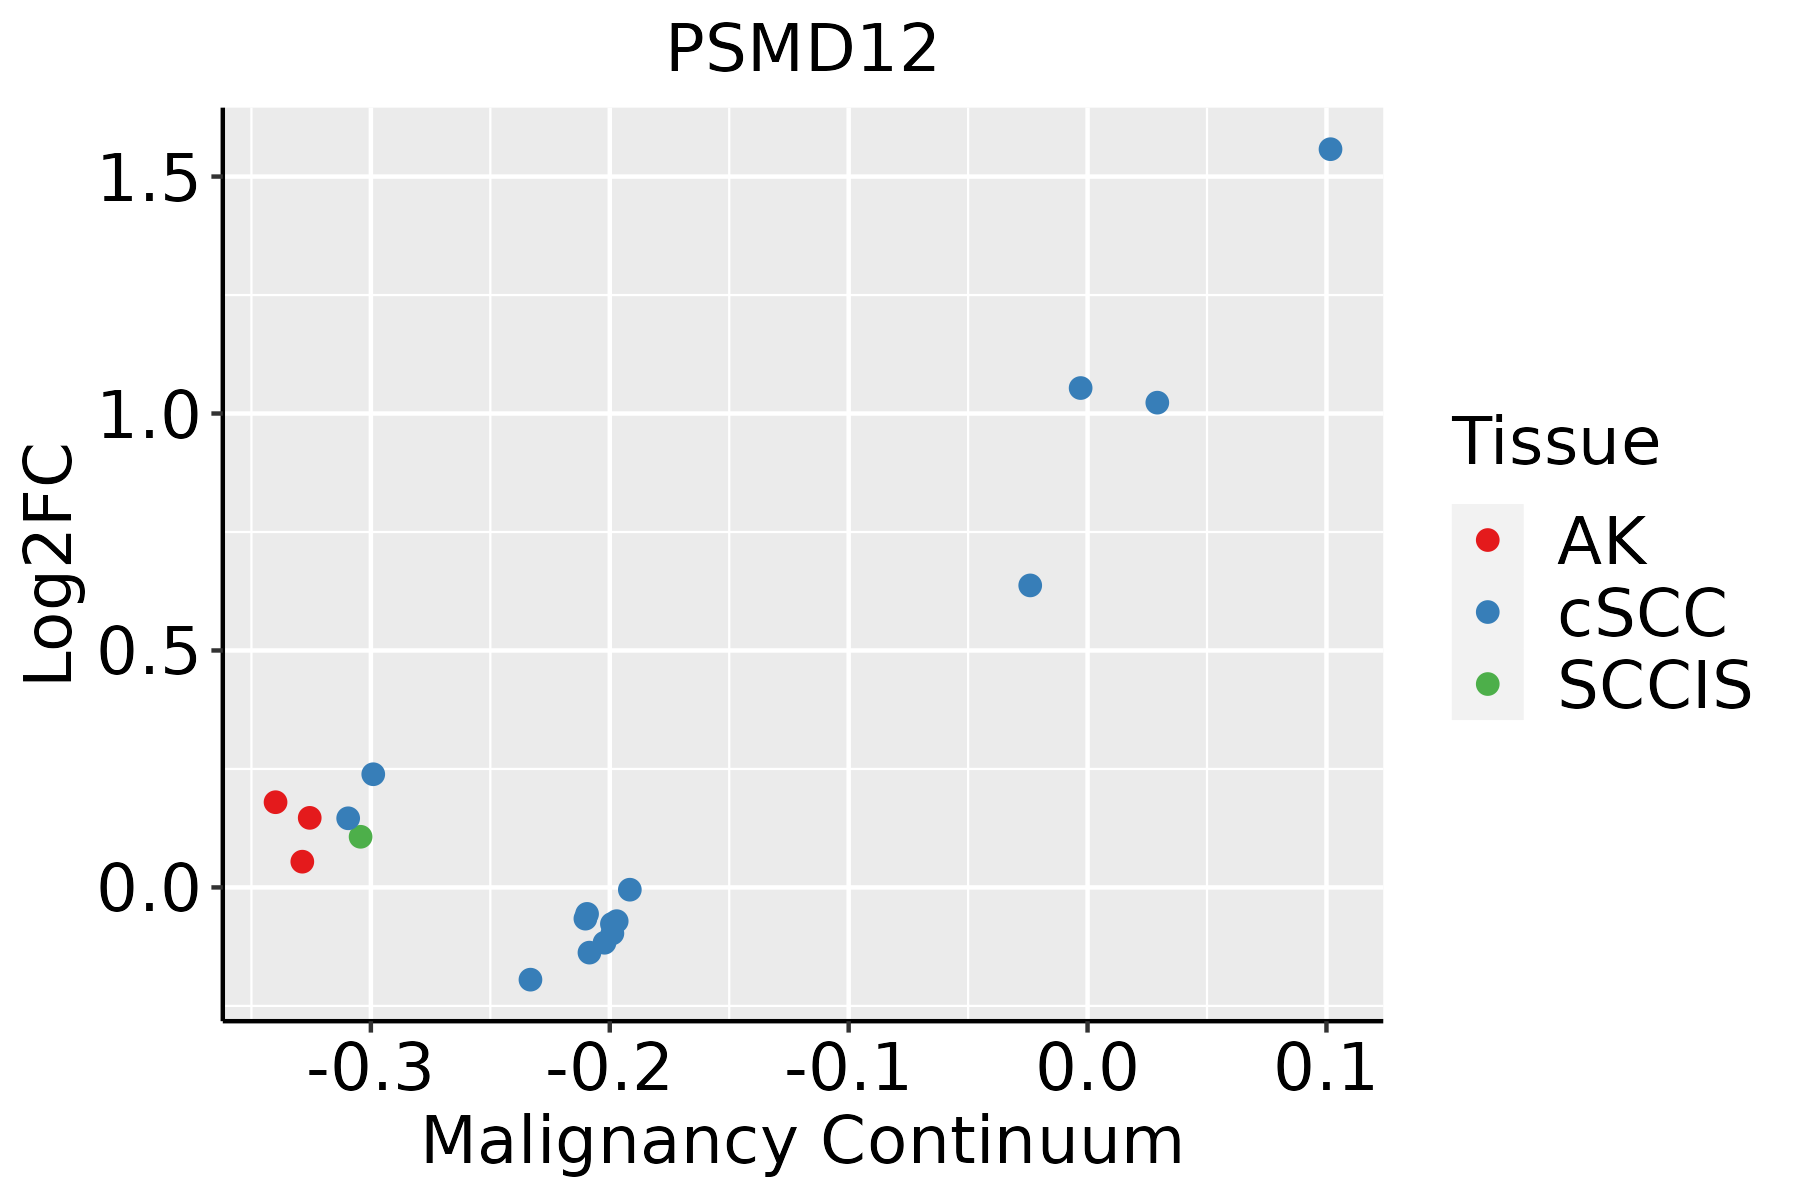 | AK: Actinic keratosis |
| cSCC: Cutaneous squamous cell carcinoma | ||
| SCCIS:squamous cell carcinoma in situ | ||
| Thyroid | 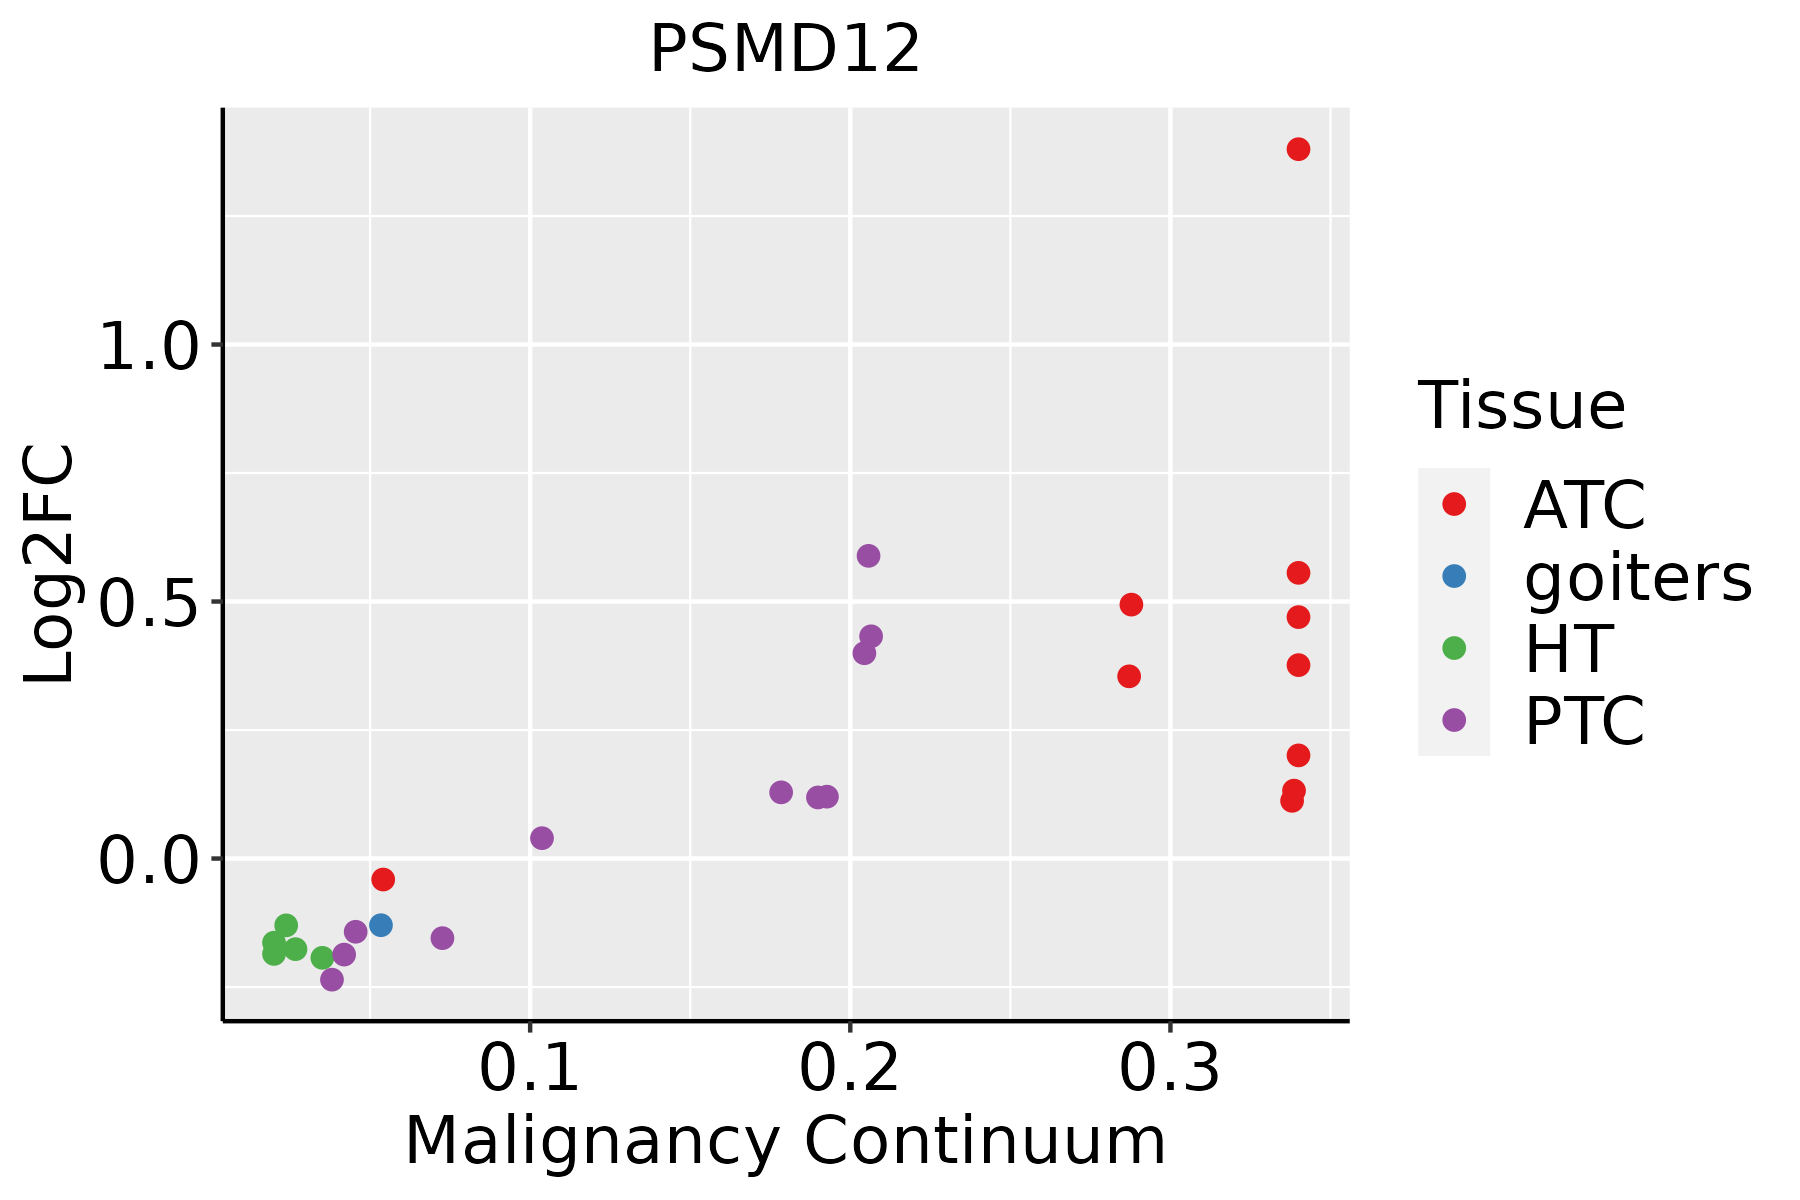 | ATC: Anaplastic thyroid cancer |
| HT: Hashimoto's thyroiditis | ||
| PTC: Papillary thyroid cancer |
| ∗log2FC in expression of this searched gene in stem-like cells from each diseased tissue sample relative to stem-like cells in normal samples in each tissue plotted against the malignancy continuum. Samples are colored based on if they are from different disease stage. |
Top |
Malignant transformation related pathway analysis |
| Find out the enriched GO biological processes and KEGG pathways involved in transition from healthy to precancer to cancer |
| Tissue | Disease Stage | Enriched GO biological Processes |
| Colorectum | AD |  |
| Colorectum | SER |  |
| Colorectum | MSS |  |
| Colorectum | MSI-H |  |
| Colorectum | FAP |  |
| ∗Top 15 enriched GO BP terms are showed in the bar plot of each disease state in each tissue. Each row represents a significant GO biological process which is colored according to the -log10(p.adjust). |
| Page: 1 2 3 4 5 6 7 8 9 |
| GO ID | Tissue | Disease Stage | Description | Gene Ratio | Bg Ratio | pvalue | p.adjust | Count |
| GO:001049817 | Endometrium | EEC | proteasomal protein catabolic process | 112/2168 | 490/18723 | 6.99e-13 | 1.40e-10 | 112 |
| GO:004316117 | Endometrium | EEC | proteasome-mediated ubiquitin-dependent protein catabolic process | 92/2168 | 412/18723 | 3.01e-10 | 3.23e-08 | 92 |
| GO:001049826 | Esophagus | HGIN | proteasomal protein catabolic process | 139/2587 | 490/18723 | 1.20e-17 | 3.41e-15 | 139 |
| GO:004316126 | Esophagus | HGIN | proteasome-mediated ubiquitin-dependent protein catabolic process | 114/2587 | 412/18723 | 7.00e-14 | 1.20e-11 | 114 |
| GO:0010498111 | Esophagus | ESCC | proteasomal protein catabolic process | 369/8552 | 490/18723 | 1.13e-41 | 1.80e-38 | 369 |
| GO:0043161111 | Esophagus | ESCC | proteasome-mediated ubiquitin-dependent protein catabolic process | 312/8552 | 412/18723 | 3.53e-36 | 4.48e-33 | 312 |
| GO:001049812 | Liver | Cirrhotic | proteasomal protein catabolic process | 216/4634 | 490/18723 | 2.52e-21 | 9.29e-19 | 216 |
| GO:004316112 | Liver | Cirrhotic | proteasome-mediated ubiquitin-dependent protein catabolic process | 184/4634 | 412/18723 | 4.52e-19 | 8.85e-17 | 184 |
| GO:001049822 | Liver | HCC | proteasomal protein catabolic process | 351/7958 | 490/18723 | 6.92e-40 | 1.46e-36 | 351 |
| GO:004316122 | Liver | HCC | proteasome-mediated ubiquitin-dependent protein catabolic process | 299/7958 | 412/18723 | 7.82e-36 | 8.27e-33 | 299 |
| GO:001049820 | Oral cavity | OSCC | proteasomal protein catabolic process | 336/7305 | 490/18723 | 5.45e-41 | 8.63e-38 | 336 |
| GO:004316120 | Oral cavity | OSCC | proteasome-mediated ubiquitin-dependent protein catabolic process | 285/7305 | 412/18723 | 5.68e-36 | 5.99e-33 | 285 |
| GO:0010498110 | Oral cavity | LP | proteasomal protein catabolic process | 224/4623 | 490/18723 | 9.57e-25 | 4.00e-22 | 224 |
| GO:0043161110 | Oral cavity | LP | proteasome-mediated ubiquitin-dependent protein catabolic process | 190/4623 | 412/18723 | 1.08e-21 | 2.93e-19 | 190 |
| GO:001049818 | Prostate | BPH | proteasomal protein catabolic process | 153/3107 | 490/18723 | 4.13e-16 | 7.51e-14 | 153 |
| GO:004316118 | Prostate | BPH | proteasome-mediated ubiquitin-dependent protein catabolic process | 127/3107 | 412/18723 | 3.84e-13 | 3.60e-11 | 127 |
| GO:001049819 | Prostate | Tumor | proteasomal protein catabolic process | 158/3246 | 490/18723 | 3.05e-16 | 6.76e-14 | 158 |
| GO:004316119 | Prostate | Tumor | proteasome-mediated ubiquitin-dependent protein catabolic process | 130/3246 | 412/18723 | 7.97e-13 | 8.00e-11 | 130 |
| GO:001049828 | Skin | cSCC | proteasomal protein catabolic process | 243/4864 | 490/18723 | 7.85e-30 | 4.10e-27 | 243 |
| GO:004316128 | Skin | cSCC | proteasome-mediated ubiquitin-dependent protein catabolic process | 205/4864 | 412/18723 | 1.46e-25 | 4.16e-23 | 205 |
| Page: 1 2 |
| Pathway ID | Tissue | Disease Stage | Description | Gene Ratio | Bg Ratio | pvalue | p.adjust | qvalue | Count |
| hsa0501227 | Endometrium | EEC | Parkinson disease | 117/1237 | 266/8465 | 5.97e-32 | 9.82e-30 | 7.32e-30 | 117 |
| hsa0501625 | Endometrium | EEC | Huntington disease | 120/1237 | 306/8465 | 3.86e-27 | 4.23e-25 | 3.15e-25 | 120 |
| hsa0502025 | Endometrium | EEC | Prion disease | 111/1237 | 273/8465 | 1.01e-26 | 8.27e-25 | 6.16e-25 | 111 |
| hsa0501425 | Endometrium | EEC | Amyotrophic lateral sclerosis | 128/1237 | 364/8465 | 9.83e-24 | 4.04e-22 | 3.01e-22 | 128 |
| hsa0501025 | Endometrium | EEC | Alzheimer disease | 126/1237 | 384/8465 | 2.25e-20 | 7.40e-19 | 5.52e-19 | 126 |
| hsa0502225 | Endometrium | EEC | Pathways of neurodegeneration - multiple diseases | 140/1237 | 476/8465 | 9.49e-18 | 2.60e-16 | 1.94e-16 | 140 |
| hsa0501723 | Endometrium | EEC | Spinocerebellar ataxia | 43/1237 | 143/8465 | 1.46e-06 | 2.01e-05 | 1.50e-05 | 43 |
| hsa0516925 | Endometrium | EEC | Epstein-Barr virus infection | 47/1237 | 202/8465 | 6.17e-04 | 4.41e-03 | 3.29e-03 | 47 |
| hsa0501236 | Endometrium | EEC | Parkinson disease | 117/1237 | 266/8465 | 5.97e-32 | 9.82e-30 | 7.32e-30 | 117 |
| hsa0501635 | Endometrium | EEC | Huntington disease | 120/1237 | 306/8465 | 3.86e-27 | 4.23e-25 | 3.15e-25 | 120 |
| hsa0502035 | Endometrium | EEC | Prion disease | 111/1237 | 273/8465 | 1.01e-26 | 8.27e-25 | 6.16e-25 | 111 |
| hsa0501435 | Endometrium | EEC | Amyotrophic lateral sclerosis | 128/1237 | 364/8465 | 9.83e-24 | 4.04e-22 | 3.01e-22 | 128 |
| hsa0501035 | Endometrium | EEC | Alzheimer disease | 126/1237 | 384/8465 | 2.25e-20 | 7.40e-19 | 5.52e-19 | 126 |
| hsa0502235 | Endometrium | EEC | Pathways of neurodegeneration - multiple diseases | 140/1237 | 476/8465 | 9.49e-18 | 2.60e-16 | 1.94e-16 | 140 |
| hsa0501733 | Endometrium | EEC | Spinocerebellar ataxia | 43/1237 | 143/8465 | 1.46e-06 | 2.01e-05 | 1.50e-05 | 43 |
| hsa0516934 | Endometrium | EEC | Epstein-Barr virus infection | 47/1237 | 202/8465 | 6.17e-04 | 4.41e-03 | 3.29e-03 | 47 |
| hsa0501239 | Esophagus | HGIN | Parkinson disease | 124/1383 | 266/8465 | 5.95e-32 | 9.70e-30 | 7.70e-30 | 124 |
| hsa0501630 | Esophagus | HGIN | Huntington disease | 129/1383 | 306/8465 | 6.81e-28 | 7.41e-26 | 5.88e-26 | 129 |
| hsa0502030 | Esophagus | HGIN | Prion disease | 117/1383 | 273/8465 | 4.15e-26 | 3.38e-24 | 2.69e-24 | 117 |
| hsa0501430 | Esophagus | HGIN | Amyotrophic lateral sclerosis | 140/1383 | 364/8465 | 2.13e-25 | 1.16e-23 | 9.19e-24 | 140 |
| Page: 1 2 3 4 5 6 7 8 |
Top |
Cell-cell communication analysis |
| Identification of potential cell-cell interactions between two cell types and their ligand-receptor pairs for different disease states |
| Ligand | Receptor | LRpair | Pathway | Tissue | Disease Stage |
| Page: 1 |
Top |
Single-cell gene regulatory network inference analysis |
| Find out the significant the regulons (TFs) and the target genes of each regulon across cell types for different disease states |
| TF | Cell Type | Tissue | Disease Stage | Target Gene | RSS | Regulon Activity |
| PSMD12 | MYOFIB | Breast | ADJ | GHITM,YBX3,ACTR3, etc. | 2.80e-01 |  |
| PSMD12 | MYOFIB | Breast | Healthy | GHITM,YBX3,ACTR3, etc. | 1.80e-01 |  |
| PSMD12 | MYOFIB | Breast | Precancer | GHITM,YBX3,ACTR3, etc. | 2.82e-01 |  |
| PSMD12 | CD8TRM | Prostate | ADJ | HSPD1,EIF2S1,MESD, etc. | 0.00e+00 |  |
| PSMD12 | PLA | Prostate | BPH | HSPD1,EIF2S1,MESD, etc. | 1.36e-02 |  |
| PSMD12 | MDSC | Prostate | BPH | HSPD1,EIF2S1,MESD, etc. | 0.00e+00 | |
| PSMD12 | TH1 | Prostate | BPH | HSPD1,EIF2S1,MESD, etc. | 1.94e-03 | |
| PSMD12 | BMEM | Prostate | BPH | HSPD1,EIF2S1,MESD, etc. | 0.00e+00 | |
| PSMD12 | pDC | Prostate | Healthy | HSPD1,EIF2S1,MESD, etc. | 1.76e-01 |  |
| PSMD12 | CD8TRM | Prostate | Tumor | HSPD1,EIF2S1,MESD, etc. | 4.09e-03 |  |
| ∗The dot plots of a searched regulon are shown for all cell subpopulations in each disease state of each tissue based on the regulon specific score inferred using pySCENIC and by calculating the average expression. |
| Page: 1 2 |
Top |
Somatic mutation of malignant transformation related genes |
| Annotation of somatic variants for genes involved in malignant transformation |
| Hugo Symbol | Variant Class | Variant Classification | dbSNP RS | HGVSc | HGVSp | HGVSp Short | SWISSPROT | BIOTYPE | SIFT | PolyPhen | Tumor Sample Barcode | Tissue | Histology | Sex | Age | Stage | Therapy Types | Drugs | Outcome |
| PSMD12 | SNV | Missense_Mutation | rs751498177 | c.281N>A | p.Arg94Gln | p.R94Q | O00232 | protein_coding | deleterious(0.01) | probably_damaging(0.987) | TCGA-AN-A0AK-01 | Breast | breast invasive carcinoma | Female | >=65 | I/II | Unknown | Unknown | SD |
| PSMD12 | SNV | Missense_Mutation | c.892N>C | p.Glu298Gln | p.E298Q | O00232 | protein_coding | tolerated(0.43) | benign(0.003) | TCGA-D8-A1J8-01 | Breast | breast invasive carcinoma | Female | >=65 | I/II | Hormone Therapy | nolvadex | SD | |
| PSMD12 | SNV | Missense_Mutation | c.913N>A | p.Leu305Ile | p.L305I | O00232 | protein_coding | tolerated(0.06) | possibly_damaging(0.531) | TCGA-E9-A22G-01 | Breast | breast invasive carcinoma | Female | <65 | I/II | Chemotherapy | doxorubicin | SD | |
| PSMD12 | SNV | Missense_Mutation | novel | c.78N>T | p.Gln26His | p.Q26H | O00232 | protein_coding | deleterious(0.02) | benign(0.212) | TCGA-PL-A8LZ-01 | Breast | breast invasive carcinoma | Female | <65 | III/IV | Chemotherapy | paclitaxel | SD |
| PSMD12 | insertion | Nonsense_Mutation | novel | c.835_836insCTGTAAACCCTTTATCTGTACTGATTGTTGTACACTCTTAATCTAAAATTT | p.Pro278_Phe279insSerValAsnProLeuSerValLeuIleValValHisSerTerSerLysIle | p.P278_F279insSVNPLSVLIVVHS*SKI | O00232 | protein_coding | TCGA-C8-A1HI-01 | Breast | breast invasive carcinoma | Female | <65 | III/IV | Unknown | Unknown | SD | ||
| PSMD12 | SNV | Missense_Mutation | novel | c.1024G>T | p.Gly342Cys | p.G342C | O00232 | protein_coding | deleterious(0.03) | possibly_damaging(0.489) | TCGA-C5-A7UI-01 | Cervix | cervical & endocervical cancer | Female | <65 | I/II | Unknown | Unknown | SD |
| PSMD12 | SNV | Missense_Mutation | novel | c.797N>T | p.Ala266Val | p.A266V | O00232 | protein_coding | tolerated(0.59) | benign(0.061) | TCGA-AA-3984-01 | Colorectum | colon adenocarcinoma | Female | <65 | I/II | Unknown | Unknown | SD |
| PSMD12 | SNV | Missense_Mutation | rs755100338 | c.602N>A | p.Arg201Gln | p.R201Q | O00232 | protein_coding | tolerated(0.55) | probably_damaging(0.987) | TCGA-AA-A00N-01 | Colorectum | colon adenocarcinoma | Male | >=65 | I/II | Unknown | Unknown | PD |
| PSMD12 | SNV | Missense_Mutation | novel | c.397N>A | p.Glu133Lys | p.E133K | O00232 | protein_coding | deleterious(0.02) | benign(0.148) | TCGA-AZ-4315-01 | Colorectum | colon adenocarcinoma | Male | <65 | I/II | Unknown | Unknown | SD |
| PSMD12 | SNV | Missense_Mutation | c.356N>A | p.Pro119His | p.P119H | O00232 | protein_coding | deleterious(0.04) | benign(0.001) | TCGA-D5-6530-01 | Colorectum | colon adenocarcinoma | Male | <65 | I/II | Unknown | Unknown | SD |
| Page: 1 2 3 4 5 |
Top |
Related drugs of malignant transformation related genes |
| Identification of chemicals and drugs interact with genes involved in malignant transfromation |
| (DGIdb 4.0) |
| Entrez ID | Symbol | Category | Interaction Types | Drug Claim Name | Drug Name | PMIDs |
| 5718 | PSMD12 | NA | inhibitor | CHEMBL3545432 | IXAZOMIB CITRATE | |
| 5718 | PSMD12 | NA | inhibitor | BORTEZOMIB | BORTEZOMIB | |
| 5718 | PSMD12 | NA | inhibitor | CARFILZOMIB | CARFILZOMIB | |
| 5718 | PSMD12 | NA | CARFILZOMIB | CARFILZOMIB | 24524217 | |
| 5718 | PSMD12 | NA | inhibitor | CHEMBL2103884 | OPROZOMIB | |
| 5718 | PSMD12 | NA | inhibitor | CHEMBL325041 | BORTEZOMIB | |
| 5718 | PSMD12 | NA | BORTEZOMIB | BORTEZOMIB | 24524217 | |
| 5718 | PSMD12 | NA | inhibitor | CHEMBL451887 | CARFILZOMIB |
| Page: 1 |

Copyright 2023-Present -The University of Texas Health Science Center at Houston |