
|
|||||
|
 | |
| |
| |
| |
| |
| |
|
Gene: PSMD11 |
Gene summary for PSMD11 |
| Gene information | Species | Human | Gene symbol | PSMD11 | Gene ID | 5717 |
| Gene name | proteasome 26S subunit, non-ATPase 11 | |
| Gene Alias | Rpn6 | |
| Cytomap | 17q11.2 | |
| Gene Type | protein-coding | GO ID | GO:0006508 | UniProtAcc | O00231 |
Top |
Malignant transformation analysis |
| Identification of the aberrant gene expression in precancerous and cancerous lesions by comparing the gene expression of stem-like cells in diseased tissues with normal stem cells |
| Entrez ID | Symbol | Replicates | Species | Organ | Tissue | Adj P-value | Log2FC | Malignancy |
| 5717 | PSMD11 | GSM4909293 | Human | Breast | IDC | 9.09e-50 | 8.85e-01 | 0.1581 |
| 5717 | PSMD11 | GSM4909294 | Human | Breast | IDC | 5.65e-04 | -1.64e-01 | 0.2022 |
| 5717 | PSMD11 | GSM4909296 | Human | Breast | IDC | 2.29e-11 | -2.61e-01 | 0.1524 |
| 5717 | PSMD11 | GSM4909297 | Human | Breast | IDC | 1.78e-07 | -1.68e-01 | 0.1517 |
| 5717 | PSMD11 | GSM4909298 | Human | Breast | IDC | 1.71e-02 | -1.37e-01 | 0.1551 |
| 5717 | PSMD11 | GSM4909311 | Human | Breast | IDC | 1.31e-17 | -2.23e-01 | 0.1534 |
| 5717 | PSMD11 | GSM4909312 | Human | Breast | IDC | 1.92e-06 | -1.44e-01 | 0.1552 |
| 5717 | PSMD11 | GSM4909319 | Human | Breast | IDC | 1.58e-24 | -1.97e-01 | 0.1563 |
| 5717 | PSMD11 | GSM4909321 | Human | Breast | IDC | 3.14e-07 | -3.93e-02 | 0.1559 |
| 5717 | PSMD11 | brca1 | Human | Breast | Precancer | 6.82e-11 | 4.69e-01 | -0.0338 |
| 5717 | PSMD11 | brca2 | Human | Breast | Precancer | 7.64e-06 | 3.13e-01 | -0.024 |
| 5717 | PSMD11 | M2 | Human | Breast | IDC | 5.48e-46 | 1.41e+00 | 0.21 |
| 5717 | PSMD11 | NCCBC5 | Human | Breast | DCIS | 1.54e-12 | 2.72e-01 | 0.2046 |
| 5717 | PSMD11 | P1 | Human | Breast | IDC | 1.02e-07 | -1.13e-01 | 0.1527 |
| 5717 | PSMD11 | P2 | Human | Breast | IDC | 1.28e-48 | 1.18e+00 | 0.21 |
| 5717 | PSMD11 | DCIS2 | Human | Breast | DCIS | 1.72e-53 | 1.68e-01 | 0.0085 |
| 5717 | PSMD11 | HTA11_347_2000001011 | Human | Colorectum | AD | 1.23e-02 | 3.38e-01 | -0.1954 |
| 5717 | PSMD11 | HTA11_99999970781_79442 | Human | Colorectum | MSS | 5.36e-11 | 6.45e-01 | 0.294 |
| 5717 | PSMD11 | HTA11_99999965062_69753 | Human | Colorectum | MSI-H | 2.05e-04 | 1.33e+00 | 0.3487 |
| 5717 | PSMD11 | HTA11_99999971662_82457 | Human | Colorectum | MSS | 9.75e-09 | 4.63e-01 | 0.3859 |
| Page: 1 2 3 4 5 6 7 8 9 |
| Tissue | Expression Dynamics | Abbreviation |
| Breast | 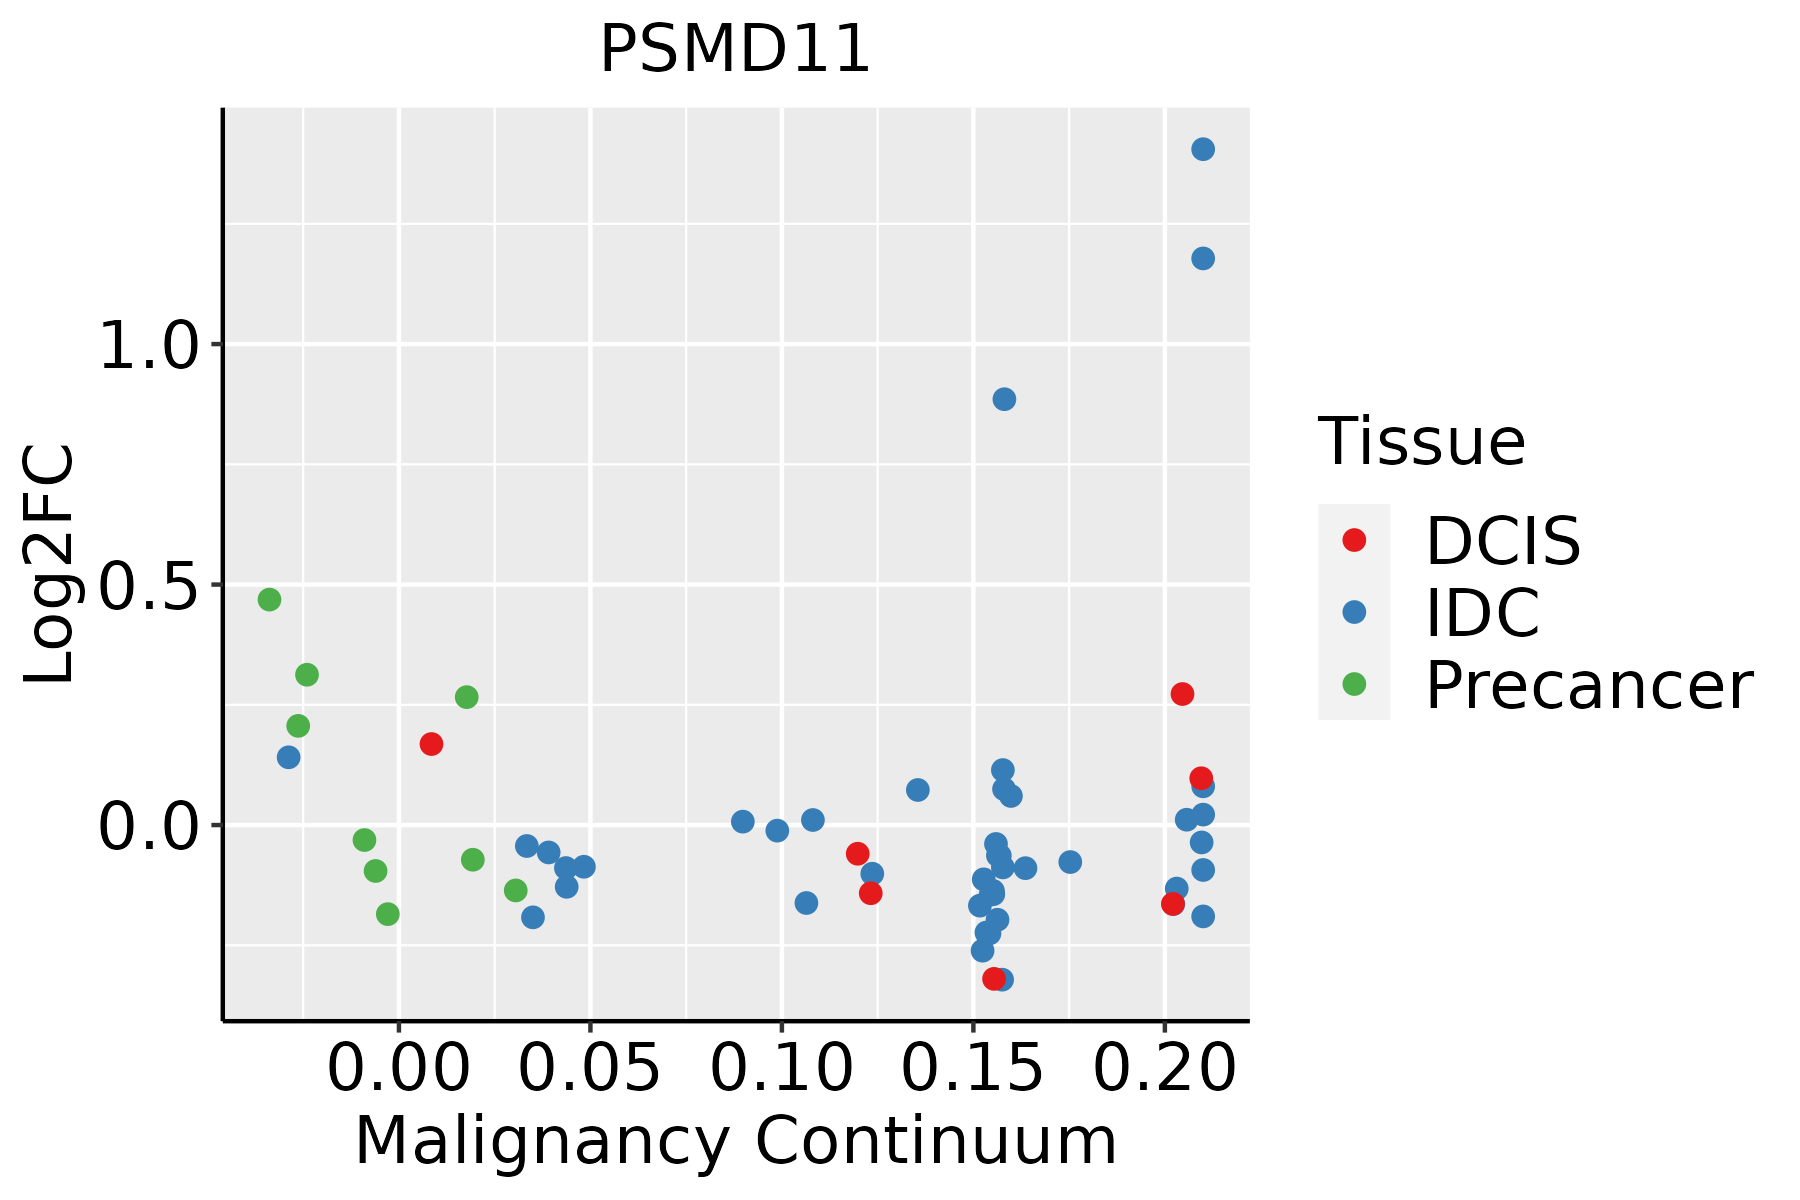 | IDC: Invasive ductal carcinoma |
| DCIS: Ductal carcinoma in situ | ||
| Precancer(BRCA1-mut): Precancerous lesion from BRCA1 mutation carriers | ||
| Colorectum (GSE201348) |  | FAP: Familial adenomatous polyposis |
| CRC: Colorectal cancer | ||
| Colorectum (HTA11) |  | AD: Adenomas |
| SER: Sessile serrated lesions | ||
| MSI-H: Microsatellite-high colorectal cancer | ||
| MSS: Microsatellite stable colorectal cancer | ||
| Endometrium |  | AEH: Atypical endometrial hyperplasia |
| EEC: Endometrioid Cancer | ||
| Esophagus | 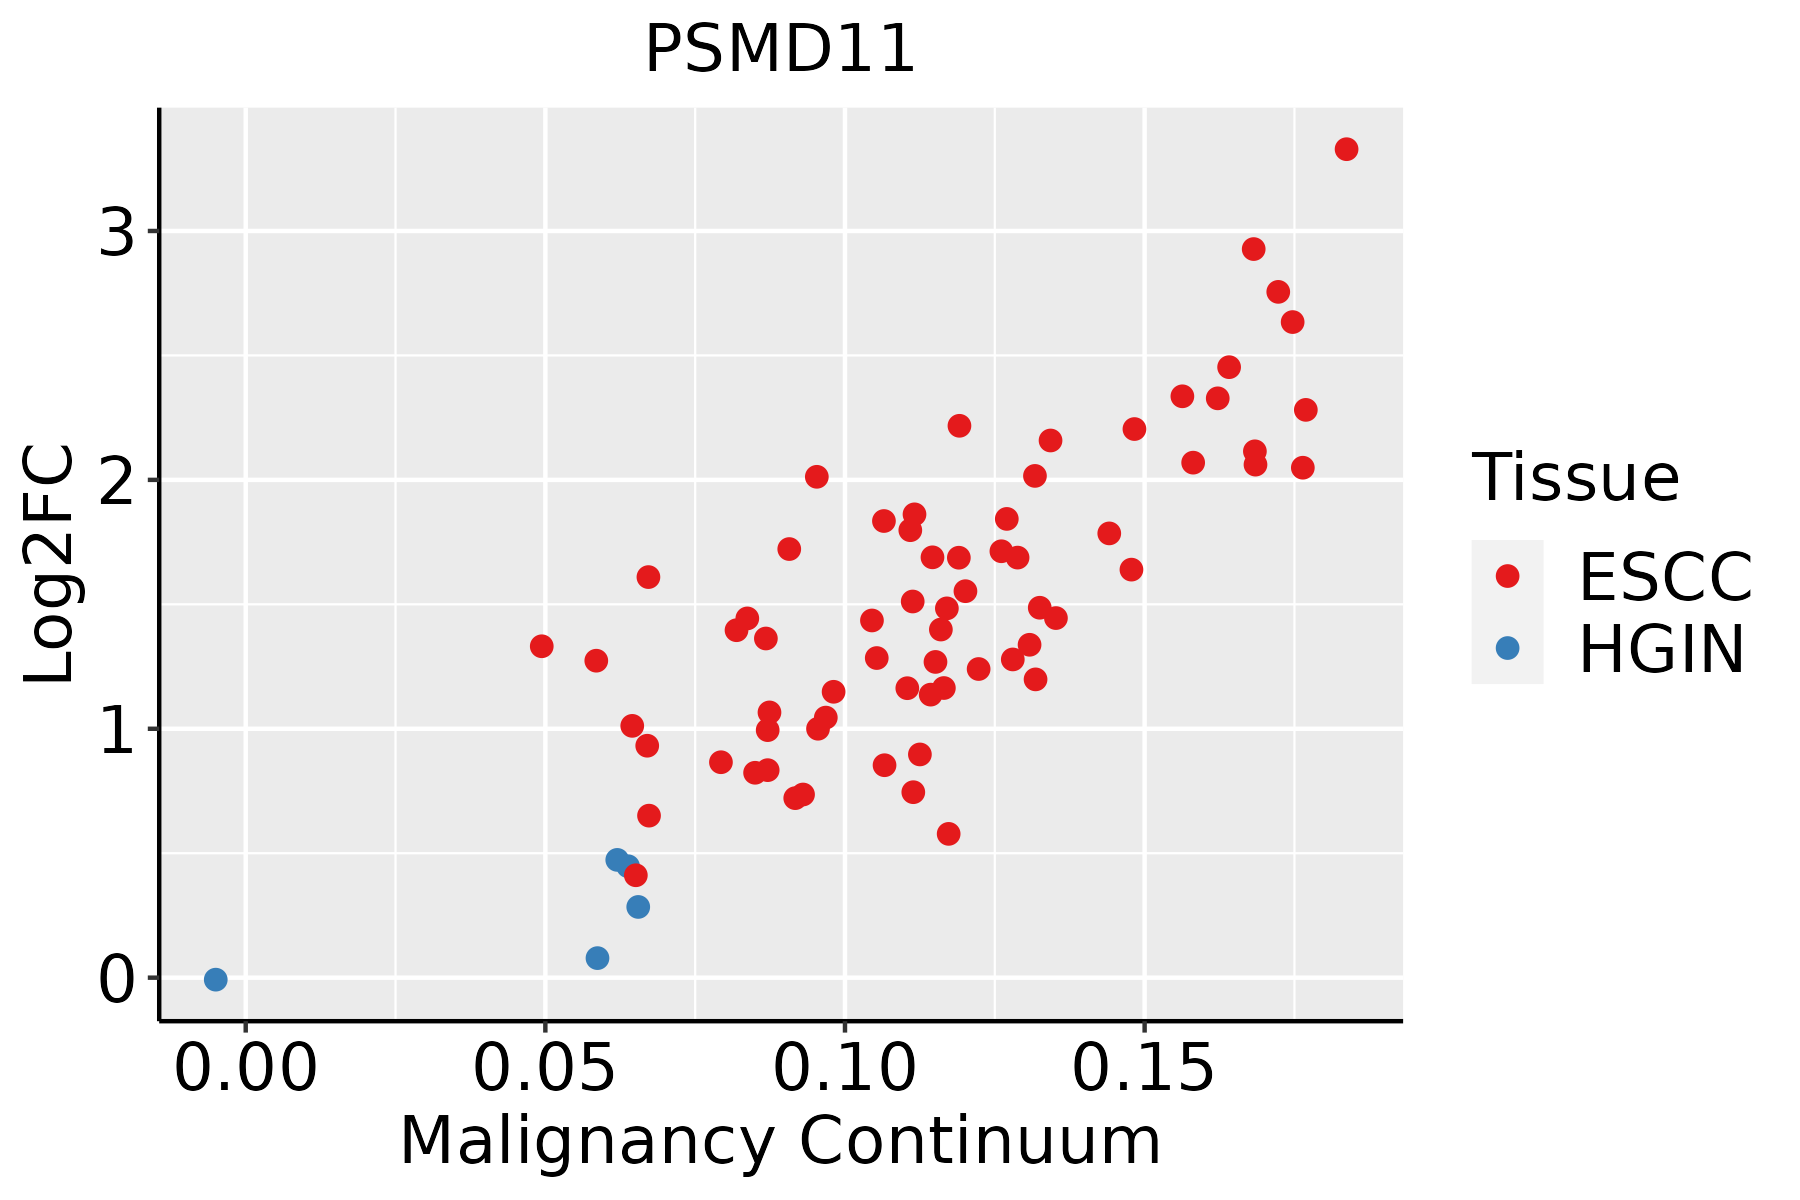 | ESCC: Esophageal squamous cell carcinoma |
| HGIN: High-grade intraepithelial neoplasias | ||
| LGIN: Low-grade intraepithelial neoplasias | ||
| Liver | 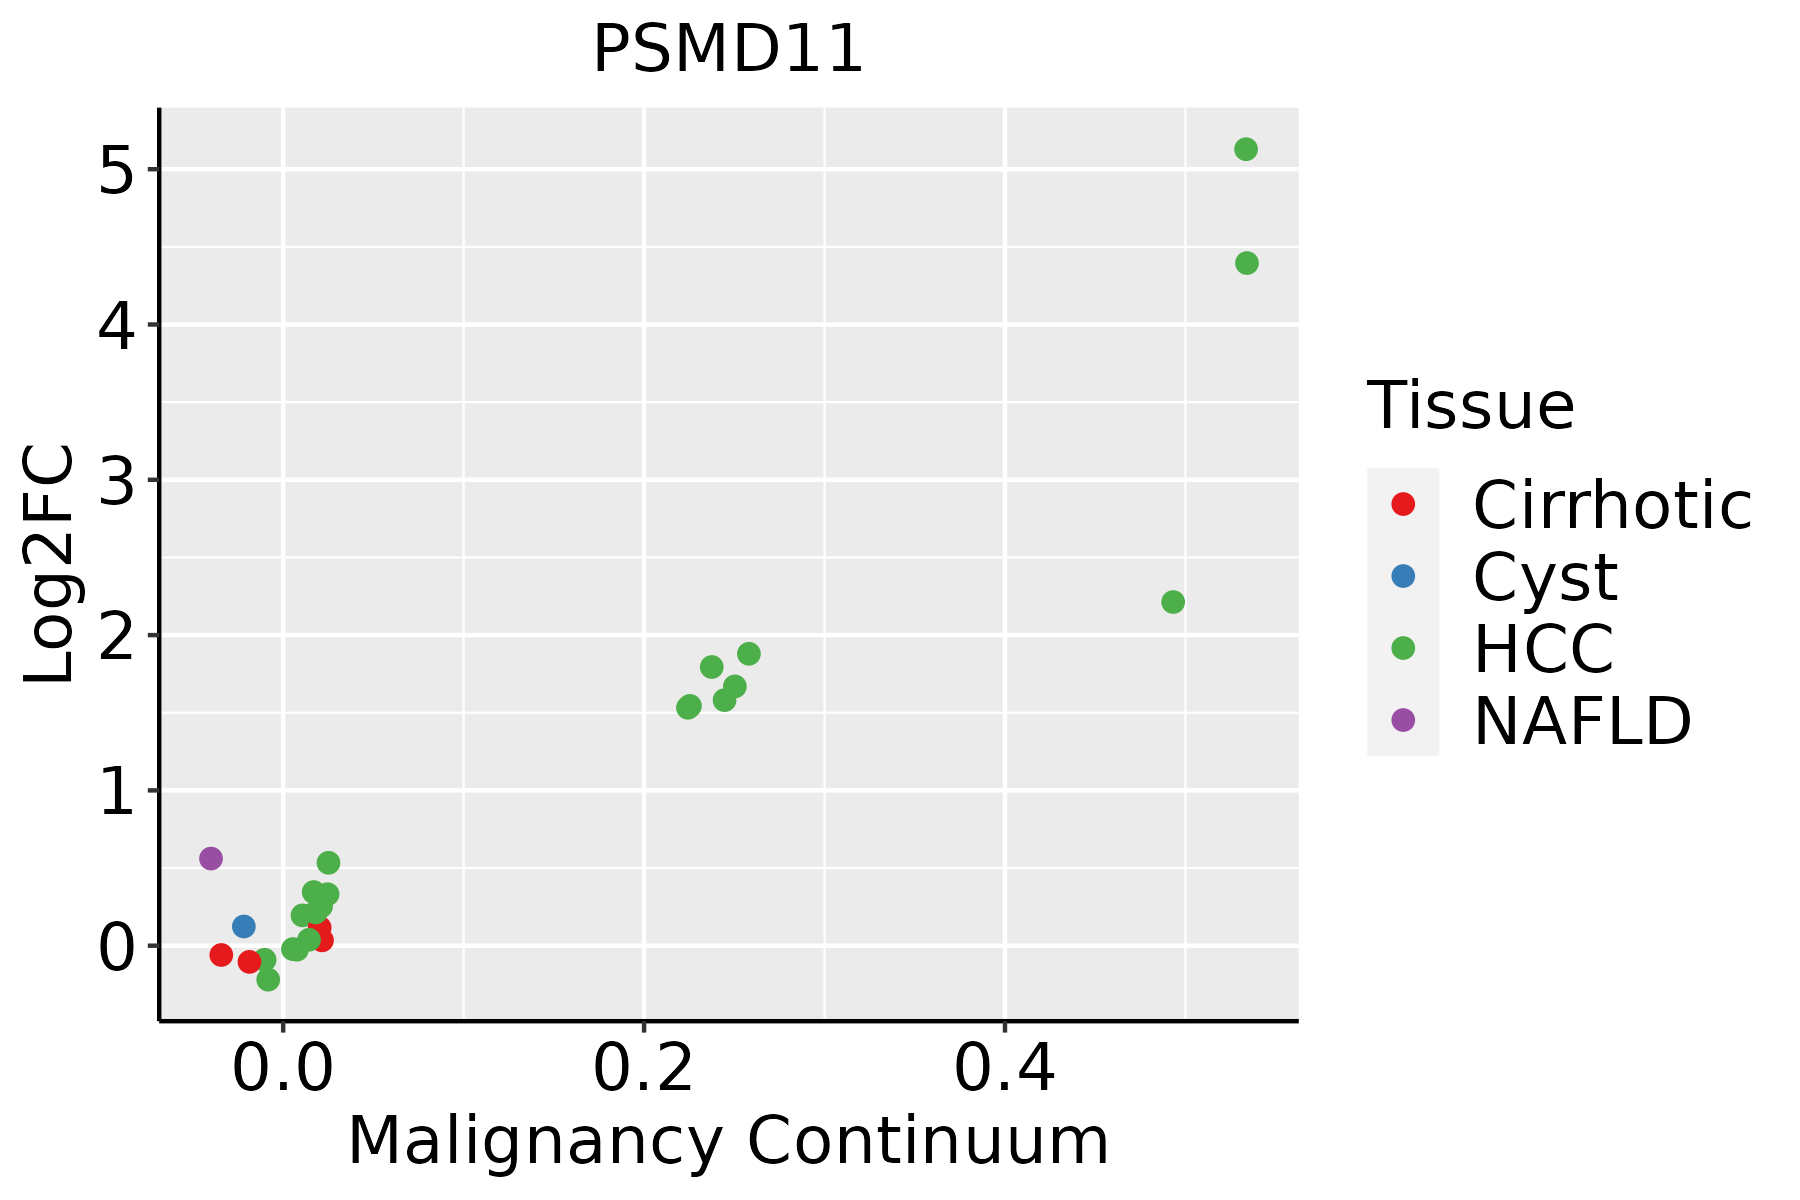 | HCC: Hepatocellular carcinoma |
| NAFLD: Non-alcoholic fatty liver disease | ||
| Oral Cavity | 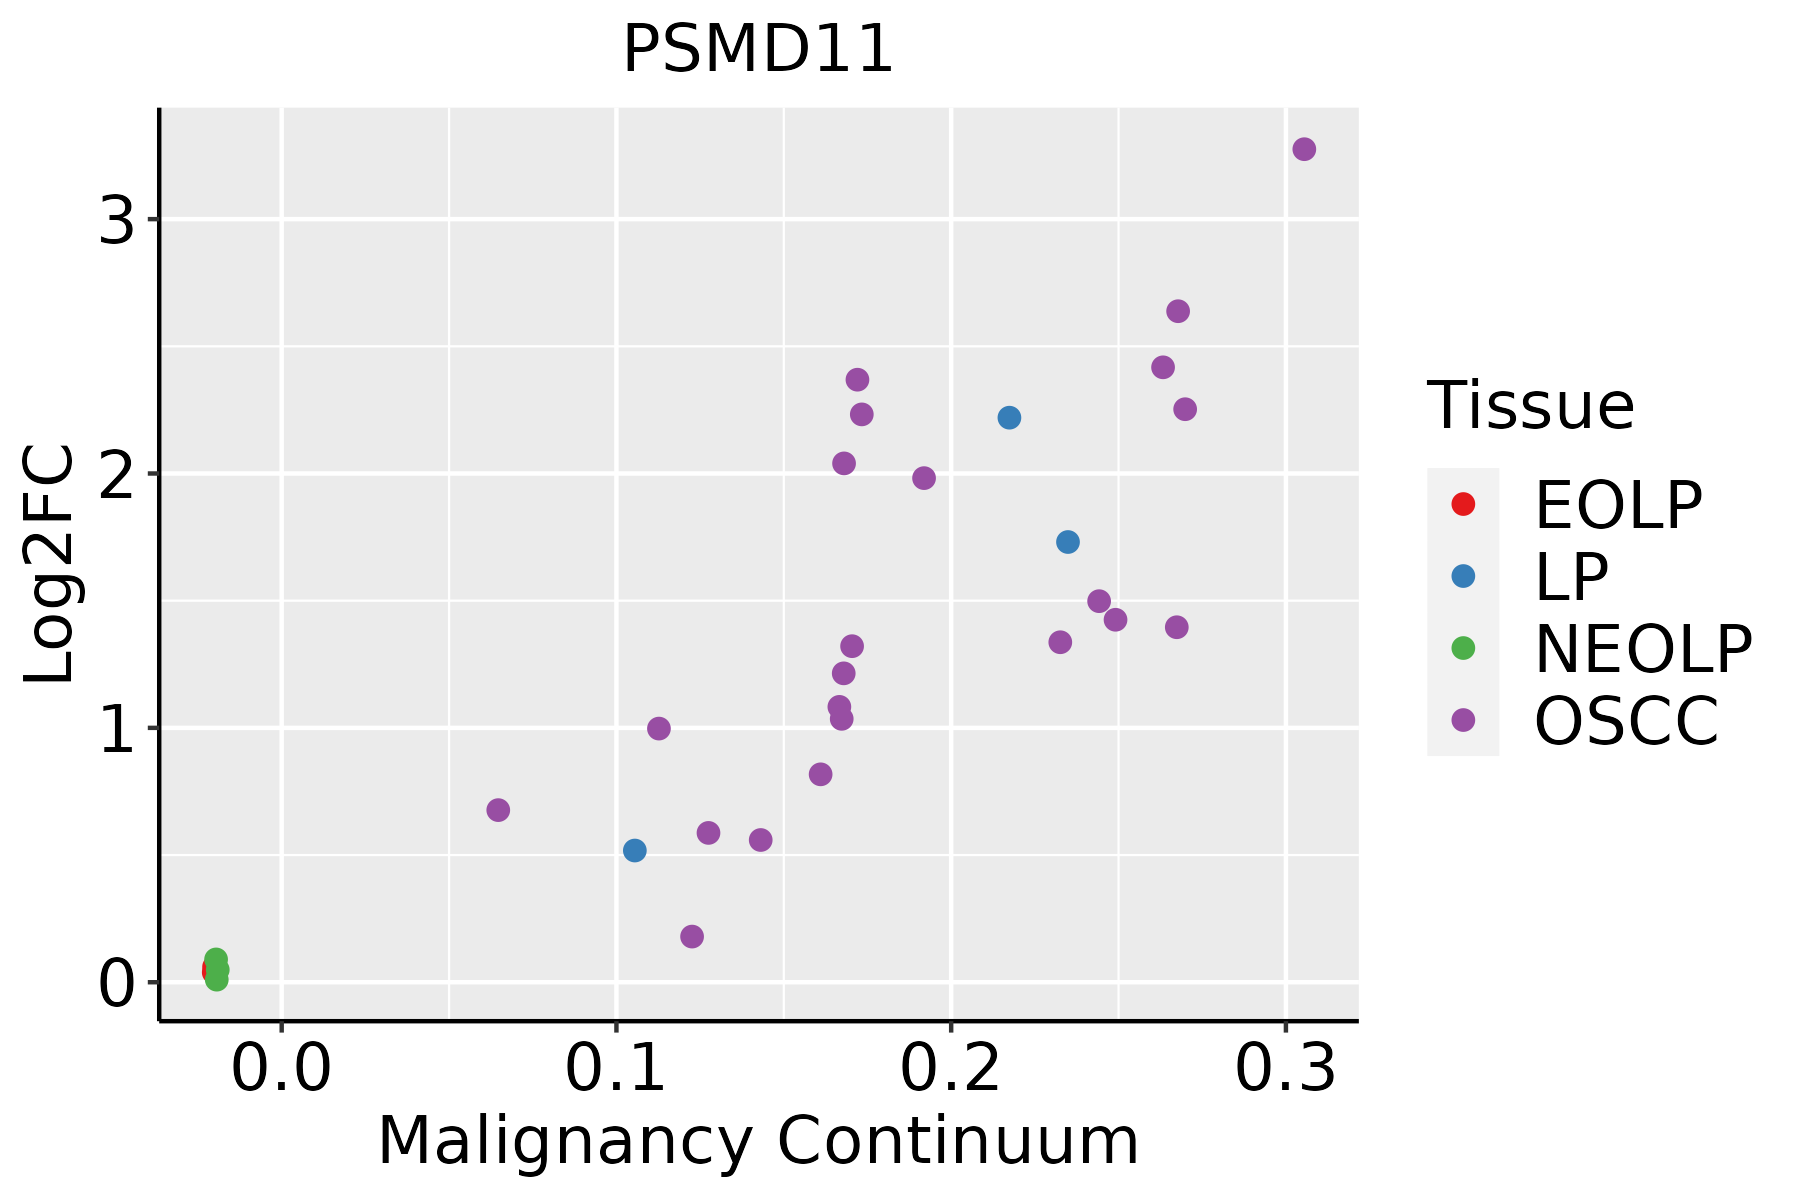 | EOLP: Erosive Oral lichen planus |
| LP: leukoplakia | ||
| NEOLP: Non-erosive oral lichen planus | ||
| OSCC: Oral squamous cell carcinoma | ||
| Prostate | 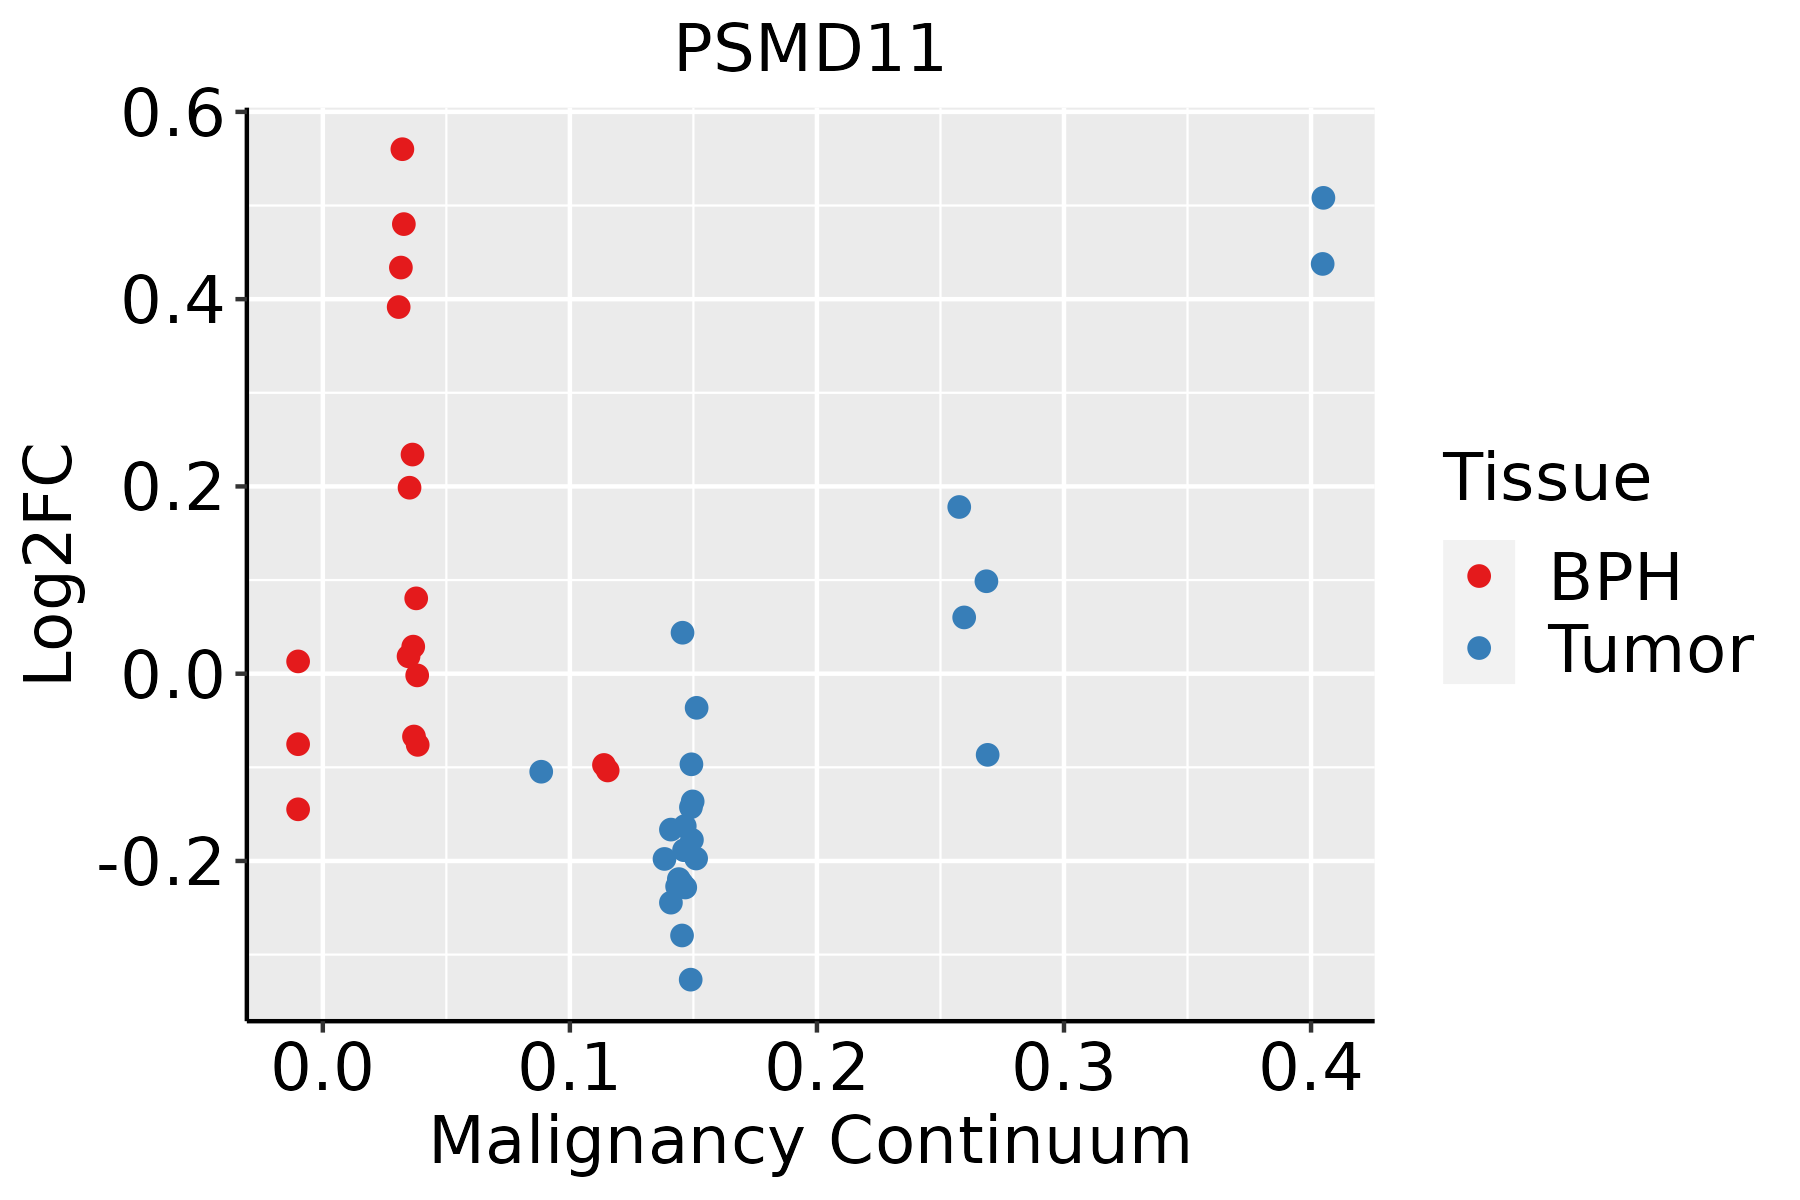 | BPH: Benign Prostatic Hyperplasia |
| Skin |  | AK: Actinic keratosis |
| cSCC: Cutaneous squamous cell carcinoma | ||
| SCCIS:squamous cell carcinoma in situ | ||
| Thyroid | 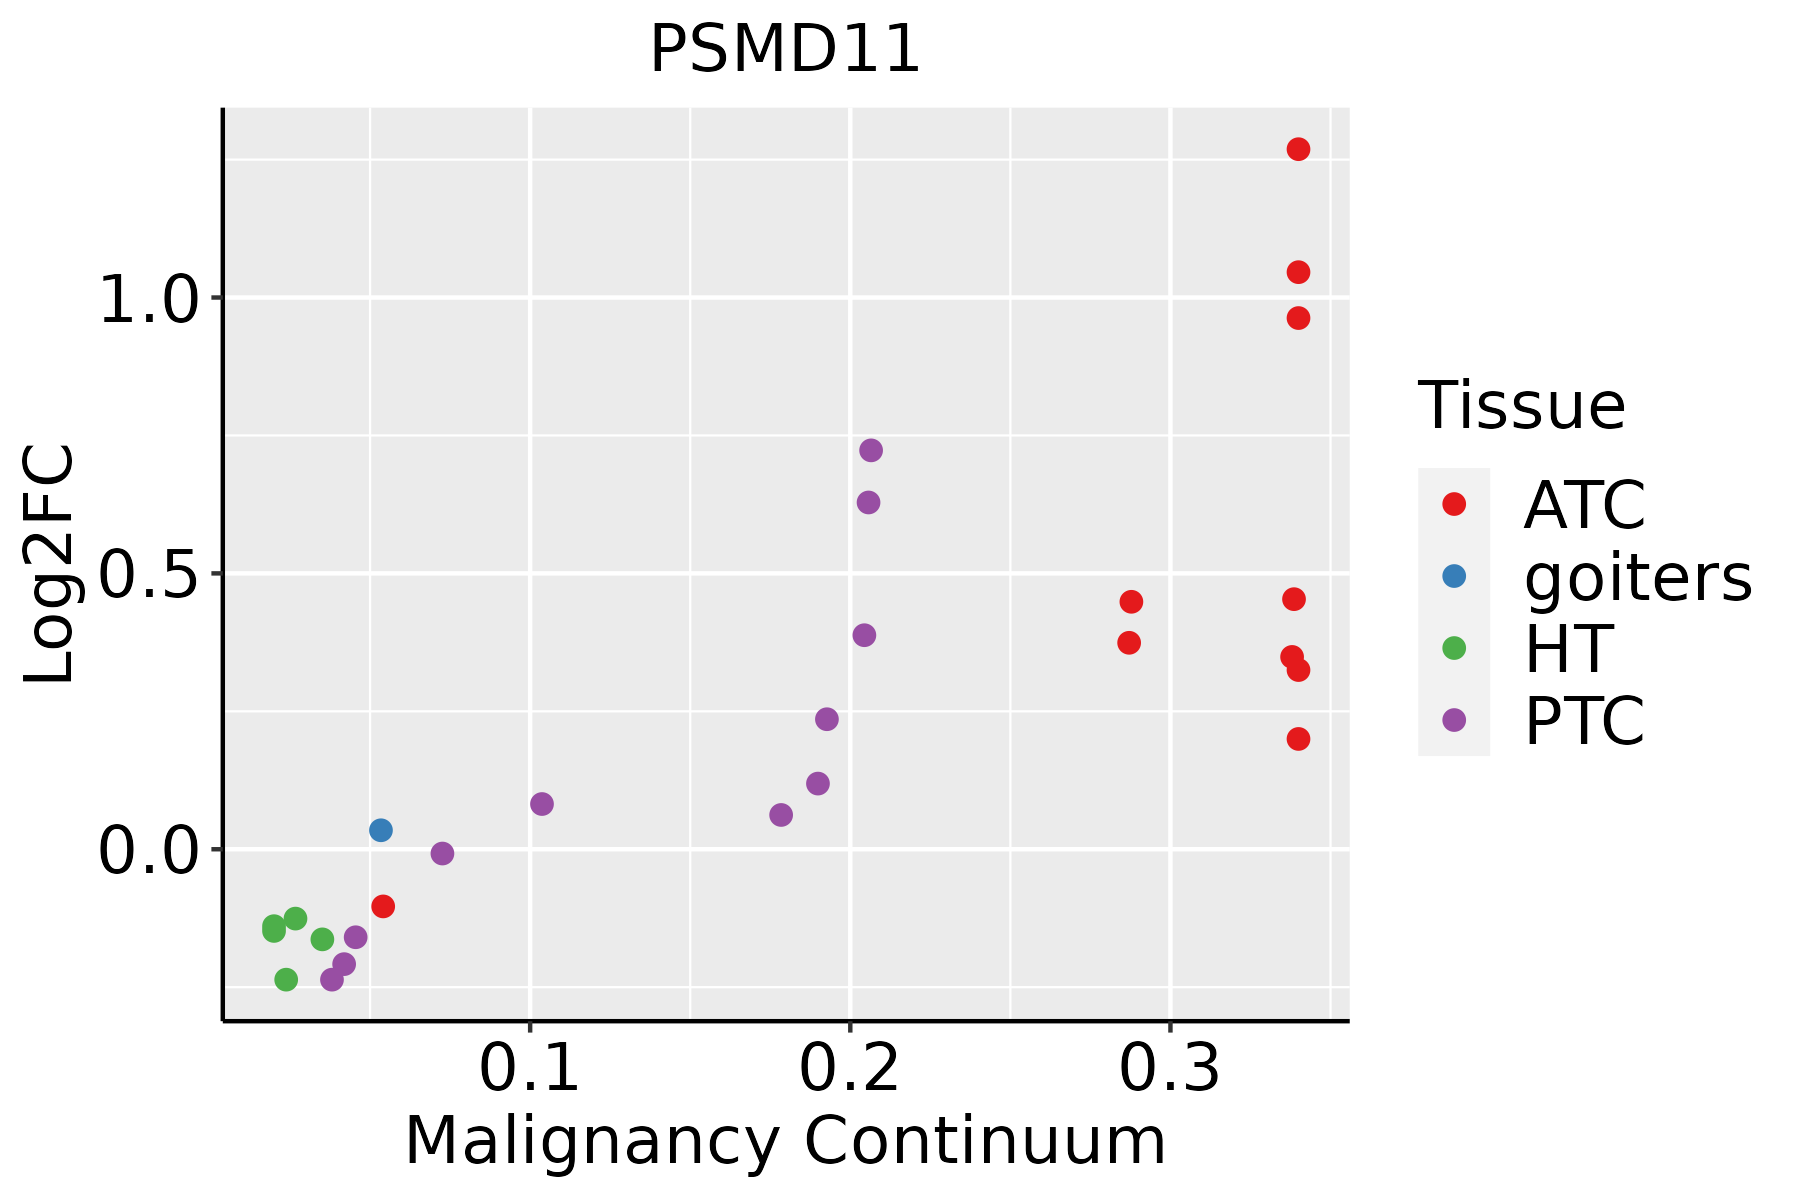 | ATC: Anaplastic thyroid cancer |
| HT: Hashimoto's thyroiditis | ||
| PTC: Papillary thyroid cancer |
| ∗log2FC in expression of this searched gene in stem-like cells from each diseased tissue sample relative to stem-like cells in normal samples in each tissue plotted against the malignancy continuum. Samples are colored based on if they are from different disease stage. |
Top |
Malignant transformation related pathway analysis |
| Find out the enriched GO biological processes and KEGG pathways involved in transition from healthy to precancer to cancer |
| Tissue | Disease Stage | Enriched GO biological Processes |
| Colorectum | AD |  |
| Colorectum | SER |  |
| Colorectum | MSS |  |
| Colorectum | MSI-H |  |
| Colorectum | FAP |  |
| ∗Top 15 enriched GO BP terms are showed in the bar plot of each disease state in each tissue. Each row represents a significant GO biological process which is colored according to the -log10(p.adjust). |
| Page: 1 2 3 4 5 6 7 8 9 |
| GO ID | Tissue | Disease Stage | Description | Gene Ratio | Bg Ratio | pvalue | p.adjust | Count |
| GO:0048863 | Colorectum | FAP | stem cell differentiation | 44/2622 | 206/18723 | 2.48e-03 | 1.96e-02 | 44 |
| GO:00488635 | Endometrium | AEH | stem cell differentiation | 40/2100 | 206/18723 | 3.67e-04 | 3.99e-03 | 40 |
| GO:004886314 | Endometrium | EEC | stem cell differentiation | 43/2168 | 206/18723 | 8.48e-05 | 1.21e-03 | 43 |
| GO:00432483 | Esophagus | HGIN | proteasome assembly | 6/2587 | 12/18723 | 3.03e-03 | 2.88e-02 | 6 |
| GO:00488638 | Esophagus | ESCC | stem cell differentiation | 122/8552 | 206/18723 | 5.95e-05 | 4.59e-04 | 122 |
| GO:004324811 | Esophagus | ESCC | proteasome assembly | 11/8552 | 12/18723 | 1.26e-03 | 6.06e-03 | 11 |
| GO:00488632 | Liver | NAFLD | stem cell differentiation | 33/1882 | 206/18723 | 4.81e-03 | 3.81e-02 | 33 |
| GO:0043248 | Liver | Cirrhotic | proteasome assembly | 9/4634 | 12/18723 | 3.59e-04 | 3.03e-03 | 9 |
| GO:004886311 | Liver | Cirrhotic | stem cell differentiation | 66/4634 | 206/18723 | 1.06e-02 | 4.68e-02 | 66 |
| GO:00432481 | Liver | HCC | proteasome assembly | 12/7958 | 12/18723 | 3.46e-05 | 3.45e-04 | 12 |
| GO:00432482 | Oral cavity | OSCC | proteasome assembly | 11/7305 | 12/18723 | 2.45e-04 | 1.57e-03 | 11 |
| GO:00488637 | Oral cavity | OSCC | stem cell differentiation | 96/7305 | 206/18723 | 1.55e-02 | 4.99e-02 | 96 |
| GO:00488636 | Prostate | BPH | stem cell differentiation | 55/3107 | 206/18723 | 1.56e-04 | 1.36e-03 | 55 |
| GO:004886315 | Prostate | Tumor | stem cell differentiation | 55/3246 | 206/18723 | 4.81e-04 | 3.57e-03 | 55 |
| GO:00432484 | Skin | cSCC | proteasome assembly | 10/4864 | 12/18723 | 5.36e-05 | 5.38e-04 | 10 |
| GO:004886317 | Skin | cSCC | stem cell differentiation | 69/4864 | 206/18723 | 9.56e-03 | 4.30e-02 | 69 |
| GO:004886310 | Thyroid | HT | stem cell differentiation | 24/1272 | 206/18723 | 6.84e-03 | 4.19e-02 | 24 |
| GO:004886318 | Thyroid | PTC | stem cell differentiation | 85/5968 | 206/18723 | 2.71e-03 | 1.36e-02 | 85 |
| GO:004886321 | Thyroid | ATC | stem cell differentiation | 97/6293 | 206/18723 | 3.88e-05 | 3.15e-04 | 97 |
| Page: 1 |
| Pathway ID | Tissue | Disease Stage | Description | Gene Ratio | Bg Ratio | pvalue | p.adjust | qvalue | Count |
| hsa0501218 | Breast | Precancer | Parkinson disease | 99/684 | 266/8465 | 3.58e-42 | 5.65e-40 | 4.33e-40 | 99 |
| hsa0502016 | Breast | Precancer | Prion disease | 95/684 | 273/8465 | 1.39e-37 | 1.46e-35 | 1.12e-35 | 95 |
| hsa0501616 | Breast | Precancer | Huntington disease | 98/684 | 306/8465 | 2.85e-35 | 2.25e-33 | 1.72e-33 | 98 |
| hsa0501016 | Breast | Precancer | Alzheimer disease | 103/684 | 384/8465 | 1.03e-29 | 4.66e-28 | 3.57e-28 | 103 |
| hsa0501416 | Breast | Precancer | Amyotrophic lateral sclerosis | 98/684 | 364/8465 | 2.13e-28 | 8.41e-27 | 6.44e-27 | 98 |
| hsa0502216 | Breast | Precancer | Pathways of neurodegeneration - multiple diseases | 112/684 | 476/8465 | 6.96e-27 | 2.44e-25 | 1.87e-25 | 112 |
| hsa0305010 | Breast | Precancer | Proteasome | 25/684 | 46/8465 | 4.35e-16 | 9.81e-15 | 7.52e-15 | 25 |
| hsa0501714 | Breast | Precancer | Spinocerebellar ataxia | 29/684 | 143/8465 | 2.79e-06 | 3.83e-05 | 2.94e-05 | 29 |
| hsa0516918 | Breast | Precancer | Epstein-Barr virus infection | 35/684 | 202/8465 | 1.15e-05 | 1.26e-04 | 9.64e-05 | 35 |
| hsa0501219 | Breast | Precancer | Parkinson disease | 99/684 | 266/8465 | 3.58e-42 | 5.65e-40 | 4.33e-40 | 99 |
| hsa0502017 | Breast | Precancer | Prion disease | 95/684 | 273/8465 | 1.39e-37 | 1.46e-35 | 1.12e-35 | 95 |
| hsa0501617 | Breast | Precancer | Huntington disease | 98/684 | 306/8465 | 2.85e-35 | 2.25e-33 | 1.72e-33 | 98 |
| hsa0501017 | Breast | Precancer | Alzheimer disease | 103/684 | 384/8465 | 1.03e-29 | 4.66e-28 | 3.57e-28 | 103 |
| hsa0501417 | Breast | Precancer | Amyotrophic lateral sclerosis | 98/684 | 364/8465 | 2.13e-28 | 8.41e-27 | 6.44e-27 | 98 |
| hsa0502217 | Breast | Precancer | Pathways of neurodegeneration - multiple diseases | 112/684 | 476/8465 | 6.96e-27 | 2.44e-25 | 1.87e-25 | 112 |
| hsa0305013 | Breast | Precancer | Proteasome | 25/684 | 46/8465 | 4.35e-16 | 9.81e-15 | 7.52e-15 | 25 |
| hsa0501715 | Breast | Precancer | Spinocerebellar ataxia | 29/684 | 143/8465 | 2.79e-06 | 3.83e-05 | 2.94e-05 | 29 |
| hsa0516919 | Breast | Precancer | Epstein-Barr virus infection | 35/684 | 202/8465 | 1.15e-05 | 1.26e-04 | 9.64e-05 | 35 |
| hsa0501224 | Breast | IDC | Parkinson disease | 107/867 | 266/8465 | 2.57e-39 | 8.36e-37 | 6.26e-37 | 107 |
| hsa0502023 | Breast | IDC | Prion disease | 102/867 | 273/8465 | 3.70e-34 | 4.01e-32 | 3.00e-32 | 102 |
| Page: 1 2 3 4 5 6 7 8 9 10 11 12 13 14 15 |
Top |
Cell-cell communication analysis |
| Identification of potential cell-cell interactions between two cell types and their ligand-receptor pairs for different disease states |
| Ligand | Receptor | LRpair | Pathway | Tissue | Disease Stage |
| Page: 1 |
Top |
Single-cell gene regulatory network inference analysis |
| Find out the significant the regulons (TFs) and the target genes of each regulon across cell types for different disease states |
| TF | Cell Type | Tissue | Disease Stage | Target Gene | RSS | Regulon Activity |
| ∗The dot plots of a searched regulon are shown for all cell subpopulations in each disease state of each tissue based on the regulon specific score inferred using pySCENIC and by calculating the average expression. |
| Page: 1 |
Top |
Somatic mutation of malignant transformation related genes |
| Annotation of somatic variants for genes involved in malignant transformation |
| Hugo Symbol | Variant Class | Variant Classification | dbSNP RS | HGVSc | HGVSp | HGVSp Short | SWISSPROT | BIOTYPE | SIFT | PolyPhen | Tumor Sample Barcode | Tissue | Histology | Sex | Age | Stage | Therapy Types | Drugs | Outcome |
| PSMD11 | SNV | Missense_Mutation | rs768709789 | c.19N>C | p.Val7Leu | p.V7L | O00231 | protein_coding | tolerated(0.32) | benign(0) | TCGA-A1-A0SJ-01 | Breast | breast invasive carcinoma | Female | <65 | III/IV | Unknown | Unknown | SD |
| PSMD11 | SNV | Missense_Mutation | c.343N>A | p.Glu115Lys | p.E115K | O00231 | protein_coding | deleterious(0.03) | benign(0.027) | TCGA-AN-A046-01 | Breast | breast invasive carcinoma | Female | >=65 | I/II | Unknown | Unknown | SD | |
| PSMD11 | SNV | Missense_Mutation | c.274N>G | p.Leu92Val | p.L92V | O00231 | protein_coding | deleterious(0.05) | benign(0.235) | TCGA-BH-A208-01 | Breast | breast invasive carcinoma | Female | <65 | I/II | Unknown | Unknown | SD | |
| PSMD11 | SNV | Missense_Mutation | novel | c.978G>T | p.Leu326Phe | p.L326F | O00231 | protein_coding | deleterious(0.03) | probably_damaging(0.961) | TCGA-VS-A9UH-01 | Cervix | cervical & endocervical cancer | Female | <65 | I/II | Chemotherapy | cisplatin | CR |
| PSMD11 | SNV | Missense_Mutation | novel | c.832N>T | p.Arg278Trp | p.R278W | O00231 | protein_coding | deleterious(0) | possibly_damaging(0.821) | TCGA-ZJ-AAX4-01 | Cervix | cervical & endocervical cancer | Female | >=65 | I/II | Unknown | Unknown | SD |
| PSMD11 | deletion | Frame_Shift_Del | c.611delC | p.Pro204LeufsTer48 | p.P204Lfs*48 | O00231 | protein_coding | TCGA-MA-AA42-01 | Cervix | cervical & endocervical cancer | Female | >=65 | I/II | Unknown | Unknown | SD | |||
| PSMD11 | SNV | Missense_Mutation | c.360N>T | p.Glu120Asp | p.E120D | O00231 | protein_coding | deleterious(0.02) | benign(0.053) | TCGA-AA-A00N-01 | Colorectum | colon adenocarcinoma | Male | >=65 | I/II | Unknown | Unknown | PD | |
| PSMD11 | SNV | Missense_Mutation | c.404C>A | p.Ser135Tyr | p.S135Y | O00231 | protein_coding | deleterious(0) | benign(0.065) | TCGA-AA-A010-01 | Colorectum | colon adenocarcinoma | Female | <65 | I/II | Chemotherapy | folinic | CR | |
| PSMD11 | SNV | Missense_Mutation | rs201116985 | c.1010G>A | p.Arg337Gln | p.R337Q | O00231 | protein_coding | deleterious(0) | probably_damaging(0.931) | TCGA-AA-A01R-01 | Colorectum | colon adenocarcinoma | Male | <65 | III/IV | Chemotherapy | 5-fluorouracil | PD |
| PSMD11 | SNV | Missense_Mutation | c.1234N>A | p.Asp412Asn | p.D412N | O00231 | protein_coding | deleterious(0.02) | possibly_damaging(0.677) | TCGA-AZ-6601-01 | Colorectum | colon adenocarcinoma | Male | >=65 | I/II | Unknown | Unknown | PD |
| Page: 1 2 3 4 5 |
Top |
Related drugs of malignant transformation related genes |
| Identification of chemicals and drugs interact with genes involved in malignant transfromation |
| (DGIdb 4.0) |
| Entrez ID | Symbol | Category | Interaction Types | Drug Claim Name | Drug Name | PMIDs |
| 5717 | PSMD11 | KINASE | inhibitor | CHEMBL325041 | BORTEZOMIB | |
| 5717 | PSMD11 | KINASE | BORTEZOMIB | BORTEZOMIB | 24524217 | |
| 5717 | PSMD11 | KINASE | inhibitor | CHEMBL3545432 | IXAZOMIB CITRATE | |
| 5717 | PSMD11 | KINASE | inhibitor | CHEMBL451887 | CARFILZOMIB | |
| 5717 | PSMD11 | KINASE | inhibitor | CARFILZOMIB | CARFILZOMIB | |
| 5717 | PSMD11 | KINASE | CARFILZOMIB | CARFILZOMIB | 24524217 | |
| 5717 | PSMD11 | KINASE | inhibitor | BORTEZOMIB | BORTEZOMIB | |
| 5717 | PSMD11 | KINASE | inhibitor | CHEMBL2103884 | OPROZOMIB |
| Page: 1 |

Copyright 2023-Present -The University of Texas Health Science Center at Houston |