| Tissue | Expression Dynamics | Abbreviation |
| Esophagus | 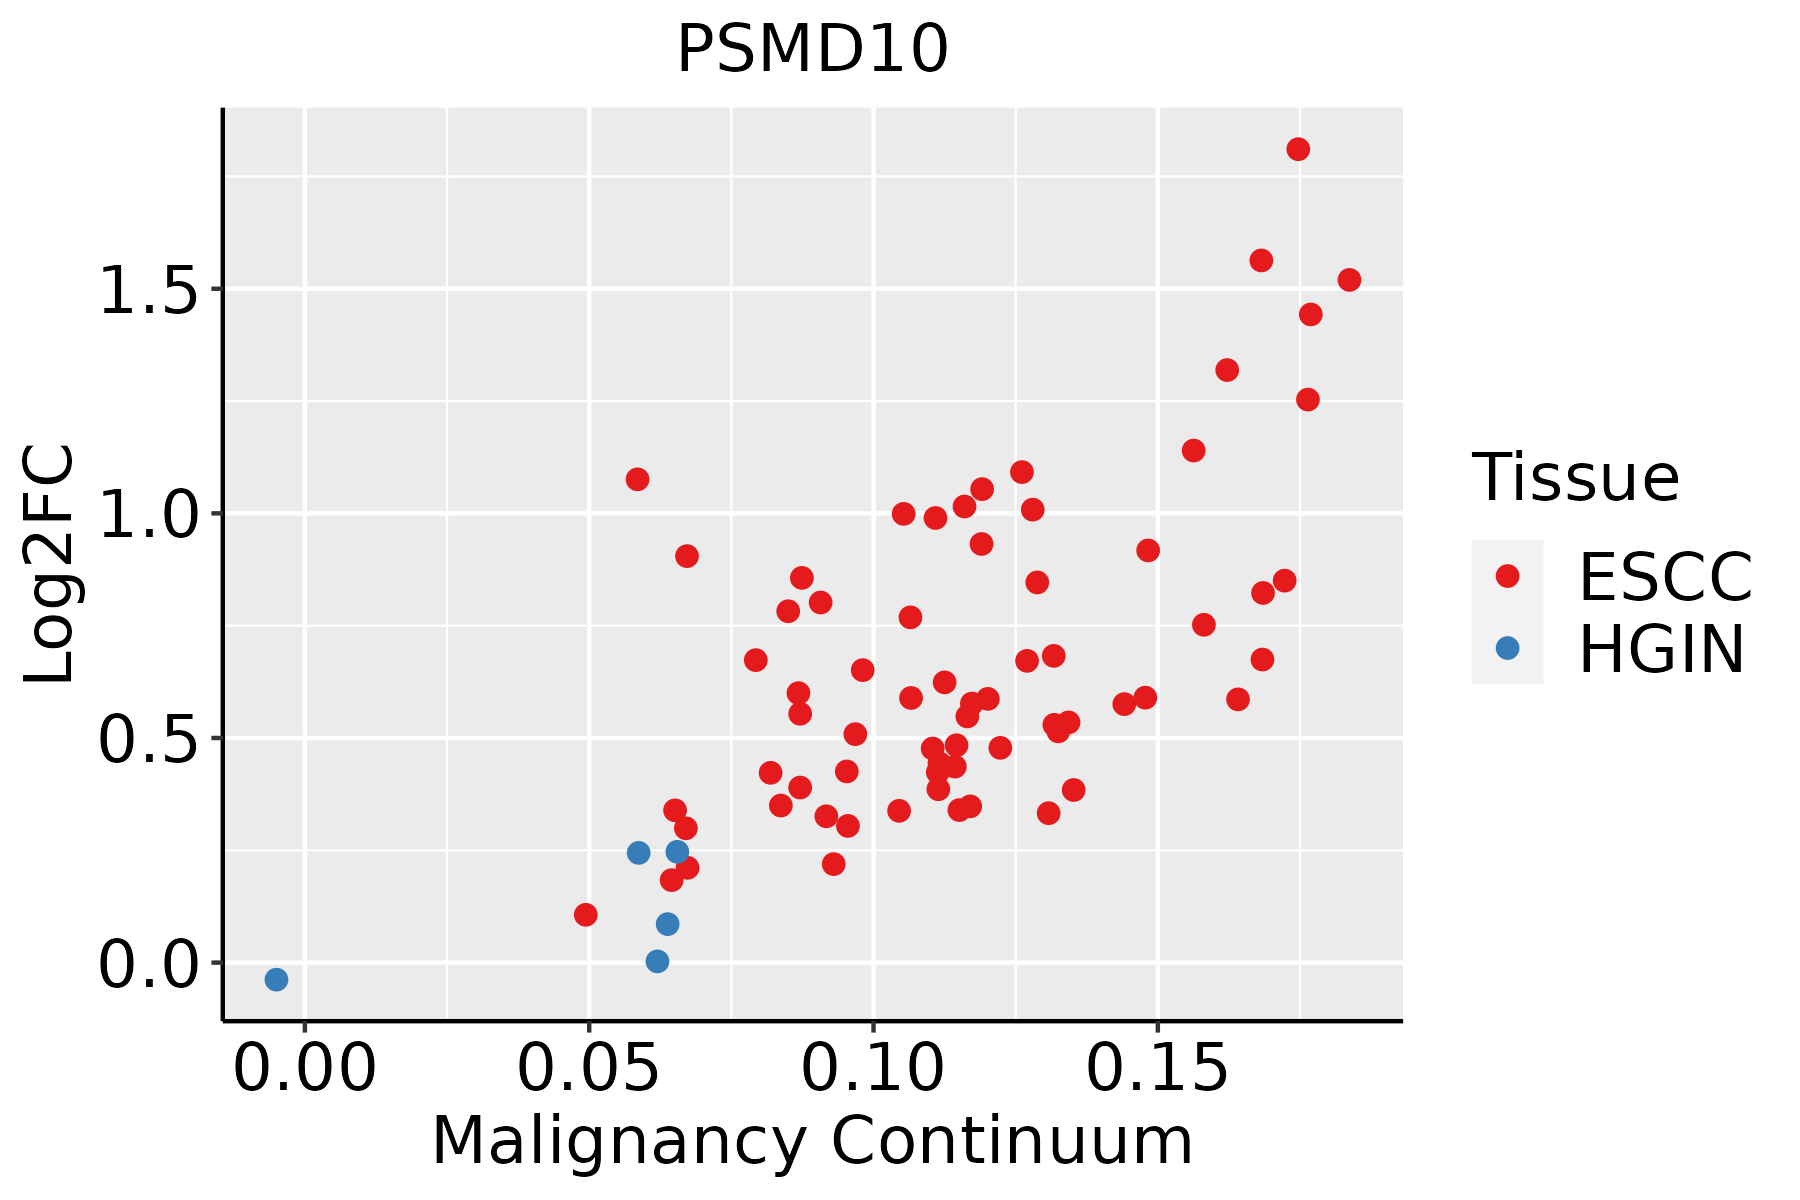 | ESCC: Esophageal squamous cell carcinoma |
| HGIN: High-grade intraepithelial neoplasias |
| LGIN: Low-grade intraepithelial neoplasias |
| Liver | 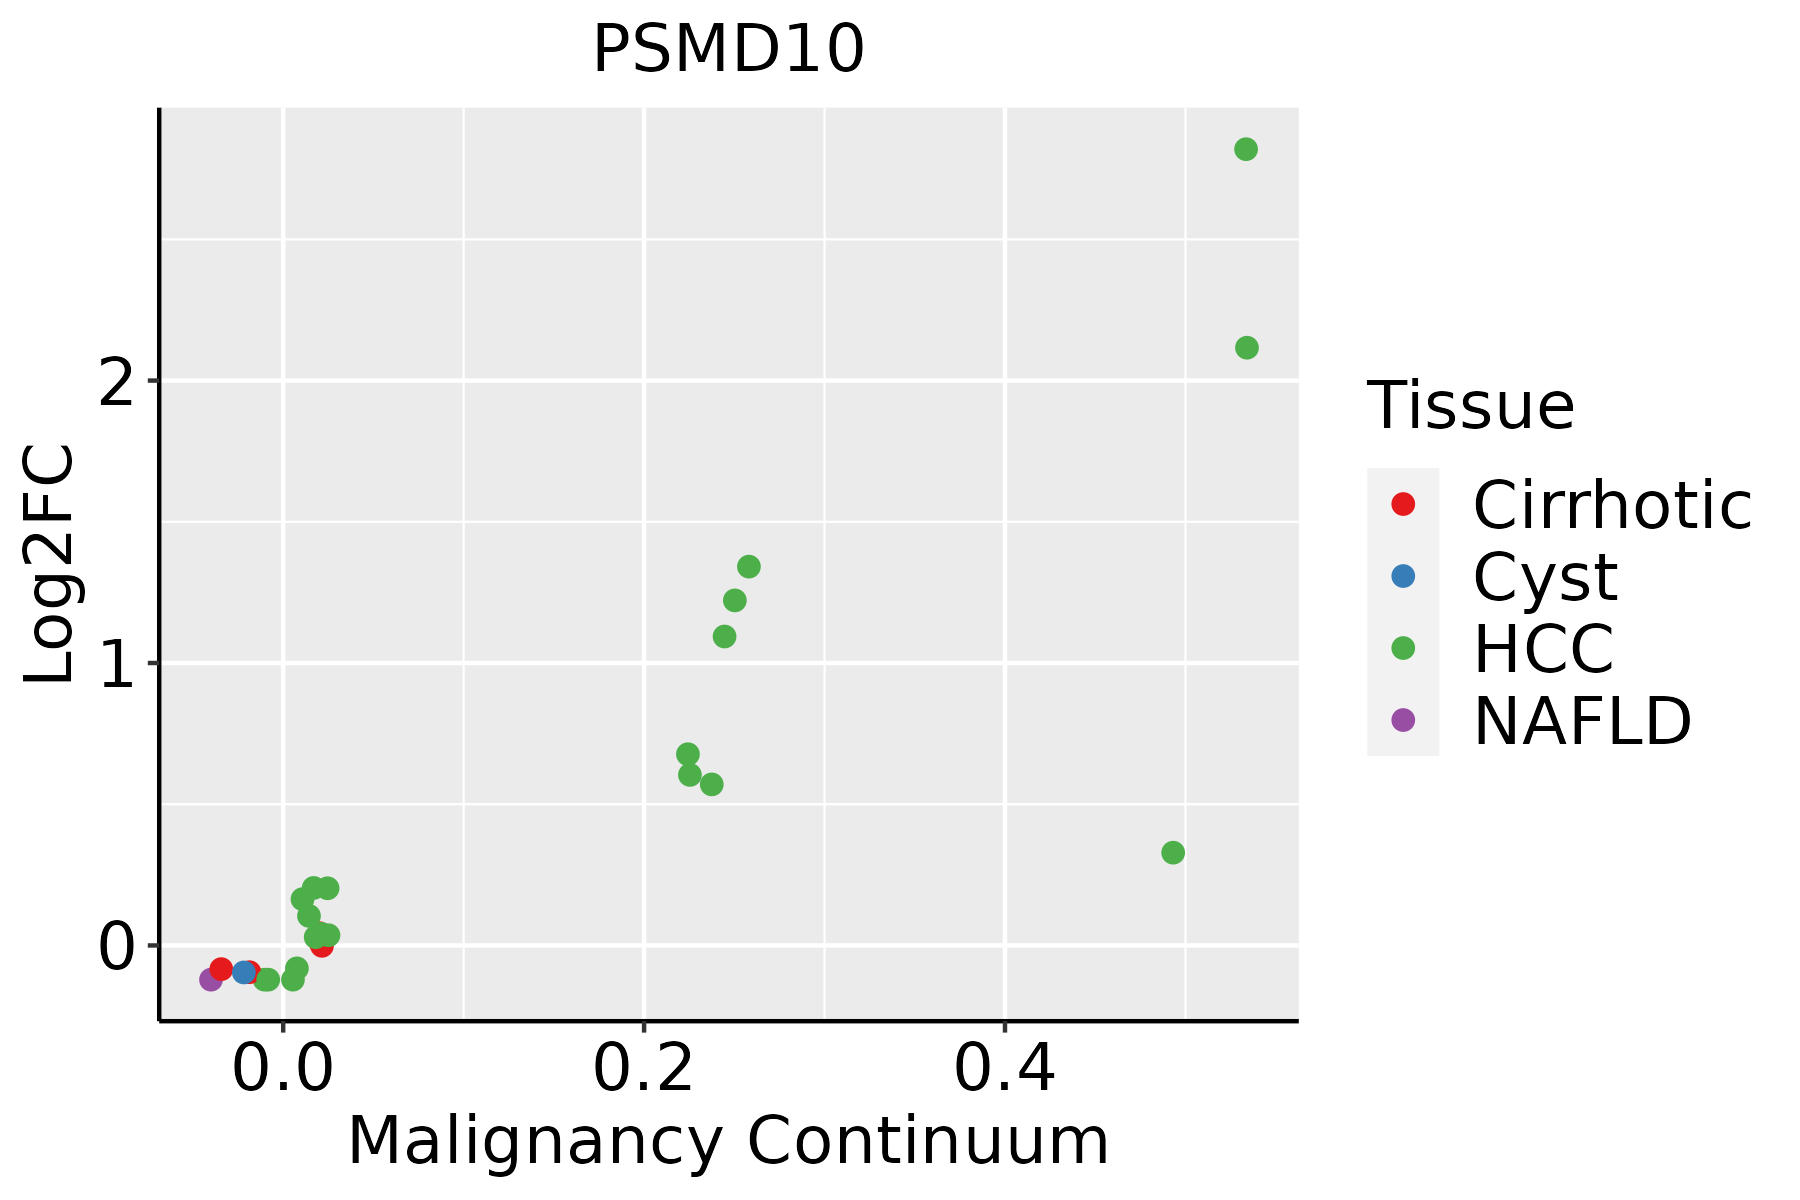 | HCC: Hepatocellular carcinoma |
| NAFLD: Non-alcoholic fatty liver disease |
| Oral Cavity |  | EOLP: Erosive Oral lichen planus |
| LP: leukoplakia |
| NEOLP: Non-erosive oral lichen planus |
| OSCC: Oral squamous cell carcinoma |
| Skin | 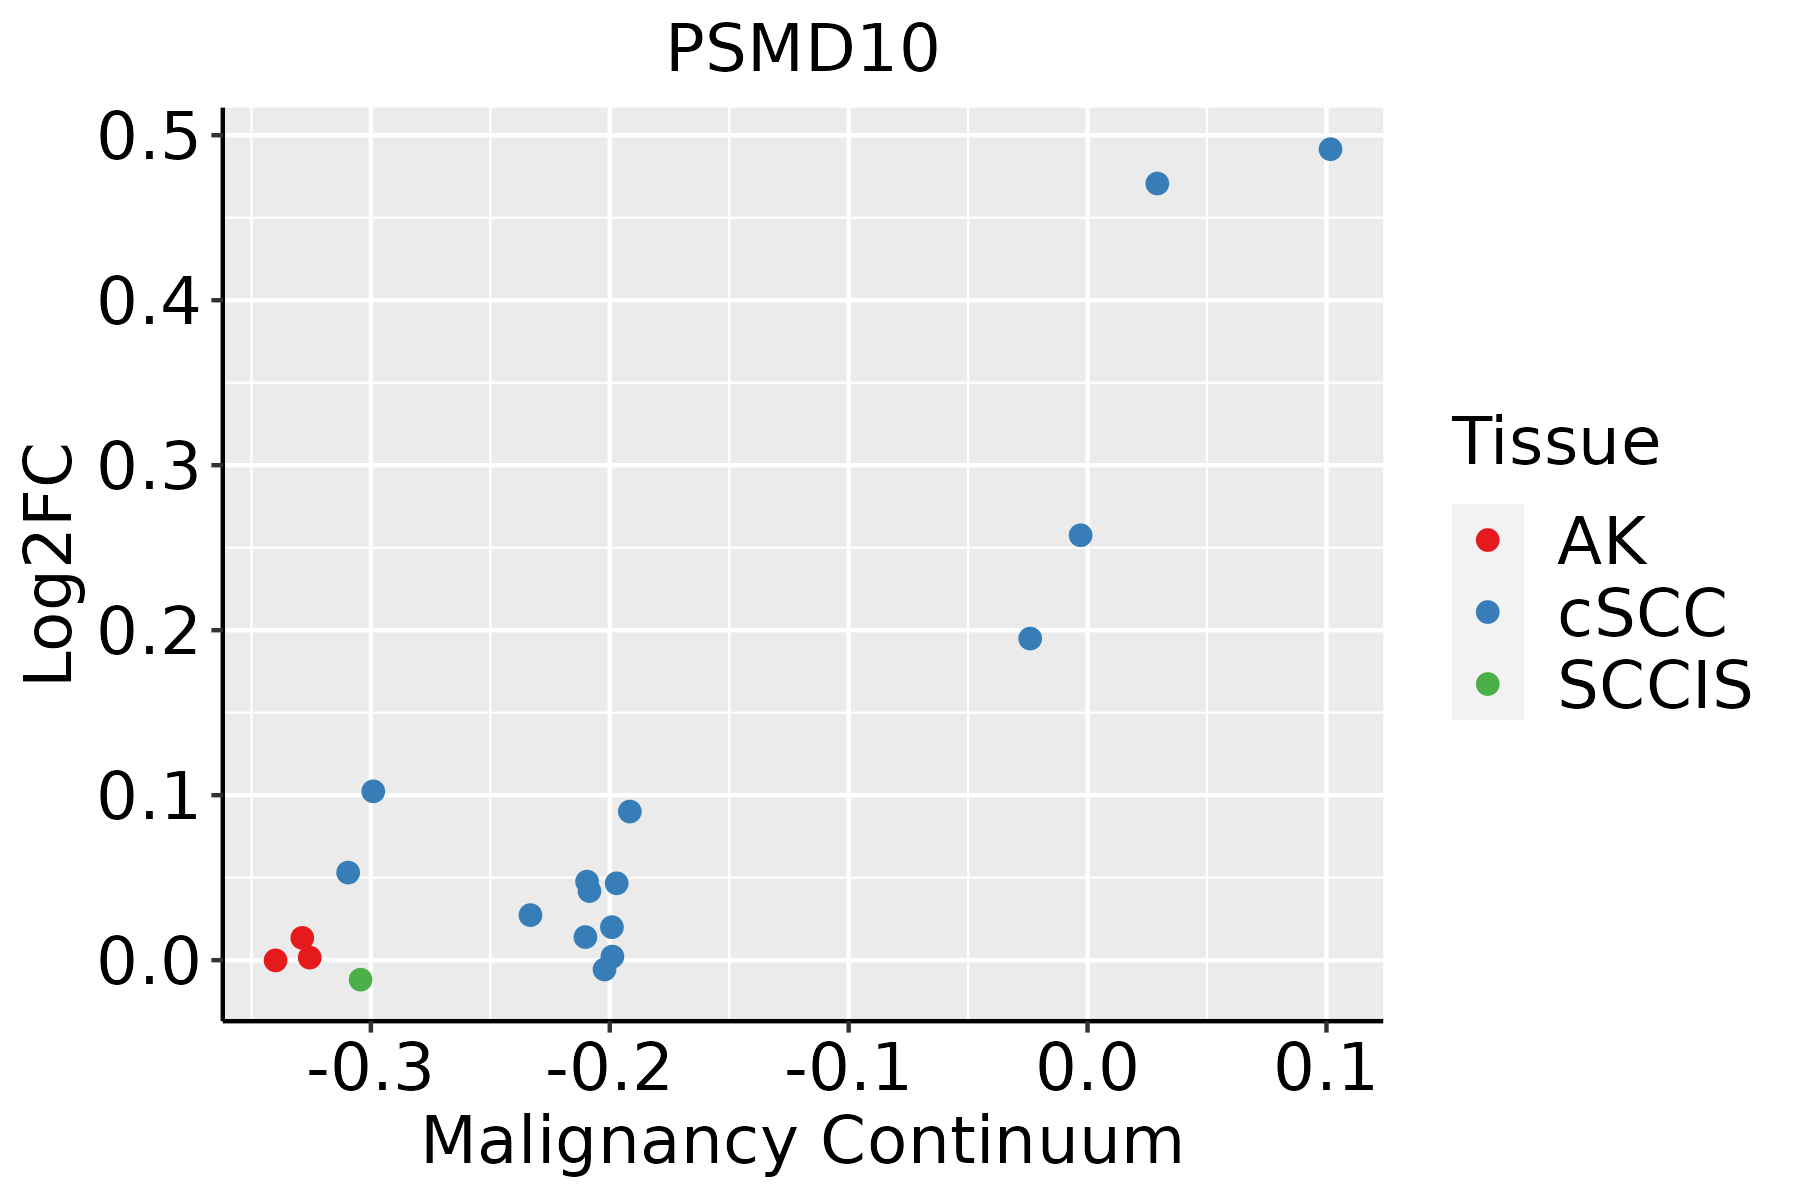 | AK: Actinic keratosis |
| cSCC: Cutaneous squamous cell carcinoma |
| SCCIS:squamous cell carcinoma in situ |
| GO ID | Tissue | Disease Stage | Description | Gene Ratio | Bg Ratio | pvalue | p.adjust | Count |
| GO:004217627 | Esophagus | HGIN | regulation of protein catabolic process | 119/2587 | 391/18723 | 8.09e-18 | 2.43e-15 | 119 |
| GO:001049826 | Esophagus | HGIN | proteasomal protein catabolic process | 139/2587 | 490/18723 | 1.20e-17 | 3.41e-15 | 139 |
| GO:004586227 | Esophagus | HGIN | positive regulation of proteolysis | 107/2587 | 372/18723 | 2.61e-14 | 4.60e-12 | 107 |
| GO:004316126 | Esophagus | HGIN | proteasome-mediated ubiquitin-dependent protein catabolic process | 114/2587 | 412/18723 | 7.00e-14 | 1.20e-11 | 114 |
| GO:190336227 | Esophagus | HGIN | regulation of cellular protein catabolic process | 81/2587 | 255/18723 | 1.16e-13 | 1.93e-11 | 81 |
| GO:190332027 | Esophagus | HGIN | regulation of protein modification by small protein conjugation or removal | 78/2587 | 242/18723 | 1.40e-13 | 2.26e-11 | 78 |
| GO:000989626 | Esophagus | HGIN | positive regulation of catabolic process | 126/2587 | 492/18723 | 1.46e-12 | 2.09e-10 | 126 |
| GO:003133126 | Esophagus | HGIN | positive regulation of cellular catabolic process | 112/2587 | 427/18723 | 5.15e-12 | 6.72e-10 | 112 |
| GO:190305027 | Esophagus | HGIN | regulation of proteolysis involved in cellular protein catabolic process | 70/2587 | 221/18723 | 6.21e-12 | 7.76e-10 | 70 |
| GO:200123327 | Esophagus | HGIN | regulation of apoptotic signaling pathway | 97/2587 | 356/18723 | 1.36e-11 | 1.57e-09 | 97 |
| GO:006113627 | Esophagus | HGIN | regulation of proteasomal protein catabolic process | 60/2587 | 187/18723 | 1.10e-10 | 1.12e-08 | 60 |
| GO:004573227 | Esophagus | HGIN | positive regulation of protein catabolic process | 69/2587 | 231/18723 | 1.66e-10 | 1.64e-08 | 69 |
| GO:003139627 | Esophagus | HGIN | regulation of protein ubiquitination | 64/2587 | 210/18723 | 3.02e-10 | 2.71e-08 | 64 |
| GO:200005827 | Esophagus | HGIN | regulation of ubiquitin-dependent protein catabolic process | 53/2587 | 164/18723 | 9.89e-10 | 8.13e-08 | 53 |
| GO:190336427 | Esophagus | HGIN | positive regulation of cellular protein catabolic process | 51/2587 | 155/18723 | 1.01e-09 | 8.15e-08 | 51 |
| GO:190180020 | Esophagus | HGIN | positive regulation of proteasomal protein catabolic process | 41/2587 | 114/18723 | 2.25e-09 | 1.67e-07 | 41 |
| GO:190305219 | Esophagus | HGIN | positive regulation of proteolysis involved in cellular protein catabolic process | 45/2587 | 133/18723 | 3.55e-09 | 2.53e-07 | 45 |
| GO:003243427 | Esophagus | HGIN | regulation of proteasomal ubiquitin-dependent protein catabolic process | 45/2587 | 134/18723 | 4.64e-09 | 3.12e-07 | 45 |
| GO:007233127 | Esophagus | HGIN | signal transduction by p53 class mediator | 49/2587 | 163/18723 | 5.71e-08 | 3.06e-06 | 49 |
| GO:003243620 | Esophagus | HGIN | positive regulation of proteasomal ubiquitin-dependent protein catabolic process | 32/2587 | 90/18723 | 1.71e-07 | 8.47e-06 | 32 |
| Hugo Symbol | Variant Class | Variant Classification | dbSNP RS | HGVSc | HGVSp | HGVSp Short | SWISSPROT | BIOTYPE | SIFT | PolyPhen | Tumor Sample Barcode | Tissue | Histology | Sex | Age | Stage | Therapy Types | Drugs | Outcome |
| PSMD10 | SNV | Missense_Mutation | novel | c.140N>T | p.Ala47Val | p.A47V | O75832 | protein_coding | deleterious(0.02) | probably_damaging(0.983) | TCGA-AO-A1KS-01 | Breast | breast invasive carcinoma | Female | >=65 | I/II | Hormone Therapy | arimidex | SD |
| PSMD10 | SNV | Missense_Mutation | | c.475C>A | p.Leu159Met | p.L159M | O75832 | protein_coding | deleterious(0.02) | possibly_damaging(0.887) | TCGA-FU-A3HZ-01 | Cervix | cervical & endocervical cancer | Female | <65 | I/II | Chemotherapy | cisplatin | CR |
| PSMD10 | SNV | Missense_Mutation | novel | c.352N>G | p.Arg118Gly | p.R118G | O75832 | protein_coding | tolerated(0.08) | benign(0.084) | TCGA-AA-3949-01 | Colorectum | colon adenocarcinoma | Female | >=65 | III/IV | Unknown | Unknown | SD |
| PSMD10 | SNV | Missense_Mutation | novel | c.175N>G | p.Leu59Val | p.L59V | O75832 | protein_coding | deleterious(0) | probably_damaging(0.978) | TCGA-A5-A0G2-01 | Endometrium | uterine corpus endometrioid carcinoma | Female | <65 | III/IV | Unknown | Unknown | SD |
| PSMD10 | SNV | Missense_Mutation | novel | c.671N>G | p.Val224Gly | p.V224G | O75832 | protein_coding | deleterious(0.01) | benign(0.026) | TCGA-A5-A2K5-01 | Endometrium | uterine corpus endometrioid carcinoma | Female | >=65 | I/II | Unknown | Unknown | SD |
| PSMD10 | SNV | Missense_Mutation | novel | c.424N>A | p.Ala142Thr | p.A142T | O75832 | protein_coding | deleterious(0) | benign(0.14) | TCGA-AX-A06F-01 | Endometrium | uterine corpus endometrioid carcinoma | Female | <65 | III/IV | Chemotherapy | carboplatin | SD |
| PSMD10 | SNV | Missense_Mutation | novel | c.239N>T | p.Ala80Val | p.A80V | O75832 | protein_coding | deleterious(0) | probably_damaging(0.984) | TCGA-AX-A0J1-01 | Endometrium | uterine corpus endometrioid carcinoma | Female | >=65 | I/II | Unknown | Unknown | SD |
| PSMD10 | SNV | Missense_Mutation | novel | c.466N>A | p.His156Asn | p.H156N | O75832 | protein_coding | tolerated(0.22) | benign(0.023) | TCGA-B5-A0JY-01 | Endometrium | uterine corpus endometrioid carcinoma | Female | <65 | III/IV | Chemotherapy | doxorubicin | SD |
| PSMD10 | SNV | Missense_Mutation | novel | c.657A>G | p.Ile219Met | p.I219M | O75832 | protein_coding | tolerated(0.29) | benign(0.01) | TCGA-B5-A3FA-01 | Endometrium | uterine corpus endometrioid carcinoma | Female | >=65 | I/II | Unknown | Unknown | SD |
| PSMD10 | SNV | Missense_Mutation | | c.462G>T | p.Met154Ile | p.M154I | O75832 | protein_coding | tolerated(1) | benign(0.001) | TCGA-BS-A0UV-01 | Endometrium | uterine corpus endometrioid carcinoma | Female | <65 | III/IV | Unknown | Unknown | SD |


