
|
|||||
|
 | |
| |
| |
| |
| |
| |
|
Gene: PSMC6 |
Gene summary for PSMC6 |
| Gene information | Species | Human | Gene symbol | PSMC6 | Gene ID | 5706 |
| Gene name | proteasome 26S subunit, ATPase 6 | |
| Gene Alias | RPT5 | |
| Cytomap | 14q22.1 | |
| Gene Type | protein-coding | GO ID | GO:0006139 | UniProtAcc | A0A087X2I1 |
Top |
Malignant transformation analysis |
| Identification of the aberrant gene expression in precancerous and cancerous lesions by comparing the gene expression of stem-like cells in diseased tissues with normal stem cells |
| Entrez ID | Symbol | Replicates | Species | Organ | Tissue | Adj P-value | Log2FC | Malignancy |
| 5706 | PSMC6 | LZE3D | Human | Esophagus | HGIN | 8.81e-07 | 4.41e-01 | 0.0668 |
| 5706 | PSMC6 | LZE4T | Human | Esophagus | ESCC | 1.26e-18 | 8.83e-01 | 0.0811 |
| 5706 | PSMC6 | LZE5T | Human | Esophagus | ESCC | 1.38e-02 | 9.83e-01 | 0.0514 |
| 5706 | PSMC6 | LZE8T | Human | Esophagus | ESCC | 1.61e-04 | 3.97e-01 | 0.067 |
| 5706 | PSMC6 | LZE20T | Human | Esophagus | ESCC | 2.63e-16 | 7.60e-01 | 0.0662 |
| 5706 | PSMC6 | LZE22D1 | Human | Esophagus | HGIN | 1.83e-02 | 1.79e-01 | 0.0595 |
| 5706 | PSMC6 | LZE22T | Human | Esophagus | ESCC | 5.55e-06 | 9.12e-01 | 0.068 |
| 5706 | PSMC6 | LZE24T | Human | Esophagus | ESCC | 1.91e-17 | 7.06e-01 | 0.0596 |
| 5706 | PSMC6 | LZE6T | Human | Esophagus | ESCC | 1.47e-03 | 3.26e-01 | 0.0845 |
| 5706 | PSMC6 | P2T-E | Human | Esophagus | ESCC | 1.36e-35 | 6.55e-01 | 0.1177 |
| 5706 | PSMC6 | P4T-E | Human | Esophagus | ESCC | 5.15e-31 | 1.13e+00 | 0.1323 |
| 5706 | PSMC6 | P5T-E | Human | Esophagus | ESCC | 2.26e-37 | 8.80e-01 | 0.1327 |
| 5706 | PSMC6 | P8T-E | Human | Esophagus | ESCC | 3.09e-52 | 1.13e+00 | 0.0889 |
| 5706 | PSMC6 | P9T-E | Human | Esophagus | ESCC | 1.60e-13 | 4.88e-01 | 0.1131 |
| 5706 | PSMC6 | P10T-E | Human | Esophagus | ESCC | 3.78e-44 | 9.52e-01 | 0.116 |
| 5706 | PSMC6 | P11T-E | Human | Esophagus | ESCC | 7.63e-19 | 9.05e-01 | 0.1426 |
| 5706 | PSMC6 | P12T-E | Human | Esophagus | ESCC | 1.94e-56 | 1.17e+00 | 0.1122 |
| 5706 | PSMC6 | P15T-E | Human | Esophagus | ESCC | 1.70e-61 | 1.58e+00 | 0.1149 |
| 5706 | PSMC6 | P16T-E | Human | Esophagus | ESCC | 4.83e-33 | 6.56e-01 | 0.1153 |
| 5706 | PSMC6 | P17T-E | Human | Esophagus | ESCC | 3.75e-10 | 8.74e-01 | 0.1278 |
| Page: 1 2 3 4 5 6 7 |
| Tissue | Expression Dynamics | Abbreviation |
| Esophagus |  | ESCC: Esophageal squamous cell carcinoma |
| HGIN: High-grade intraepithelial neoplasias | ||
| LGIN: Low-grade intraepithelial neoplasias | ||
| Liver | 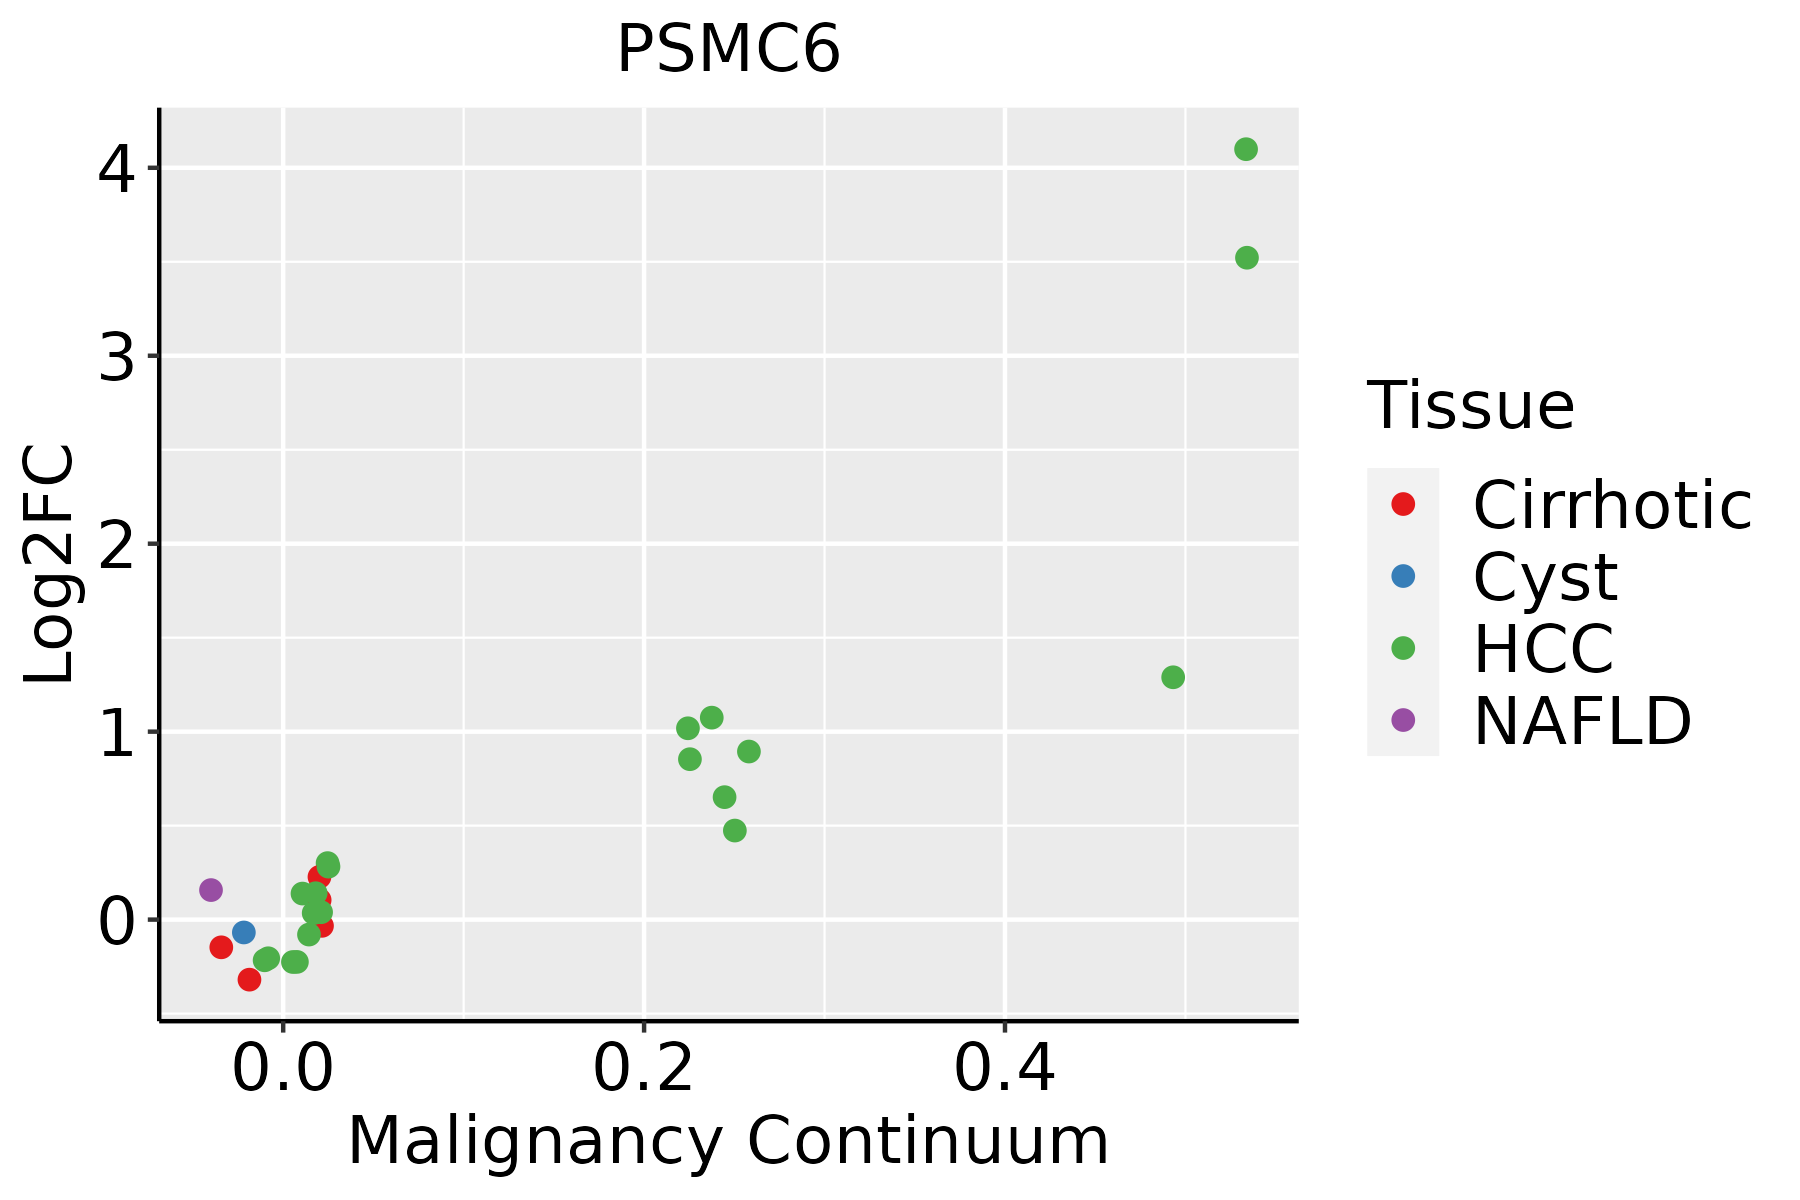 | HCC: Hepatocellular carcinoma |
| NAFLD: Non-alcoholic fatty liver disease | ||
| Oral Cavity | 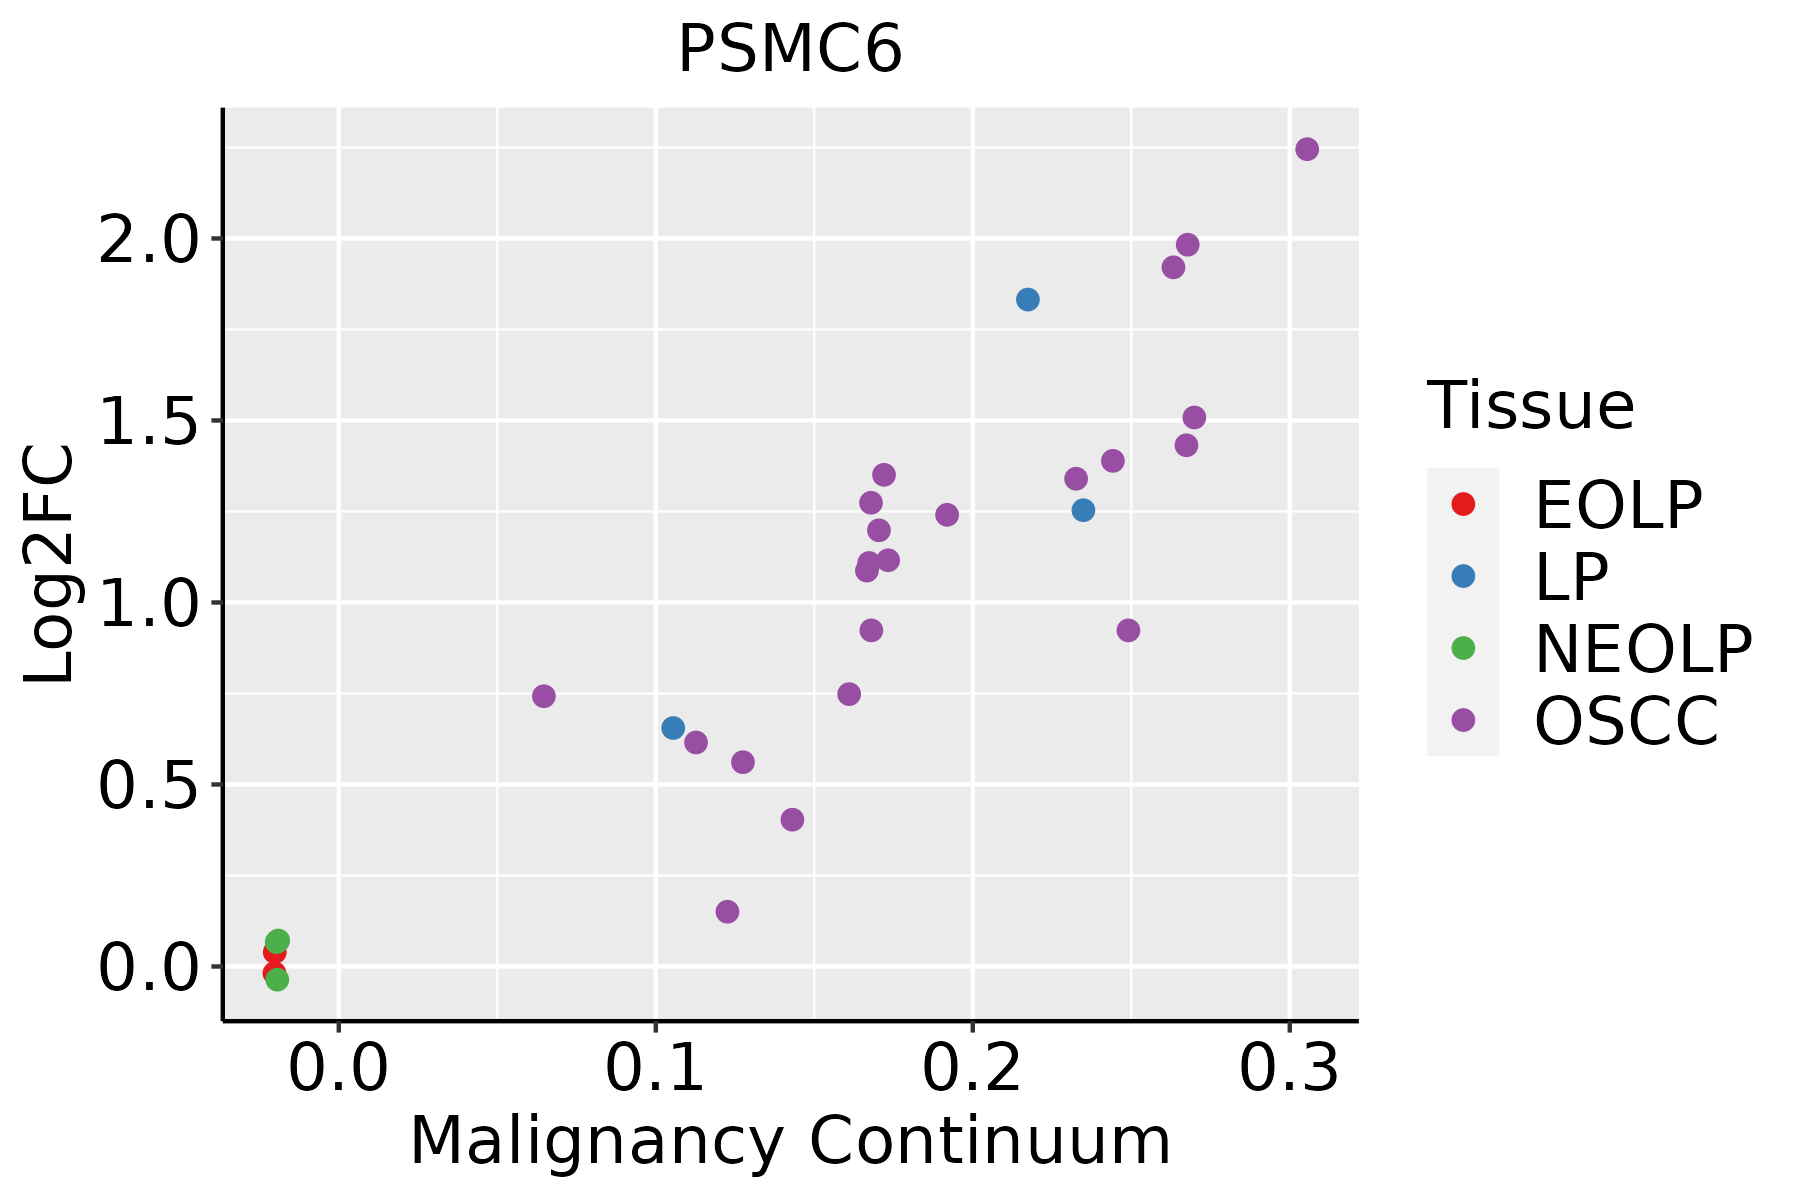 | EOLP: Erosive Oral lichen planus |
| LP: leukoplakia | ||
| NEOLP: Non-erosive oral lichen planus | ||
| OSCC: Oral squamous cell carcinoma | ||
| Skin | 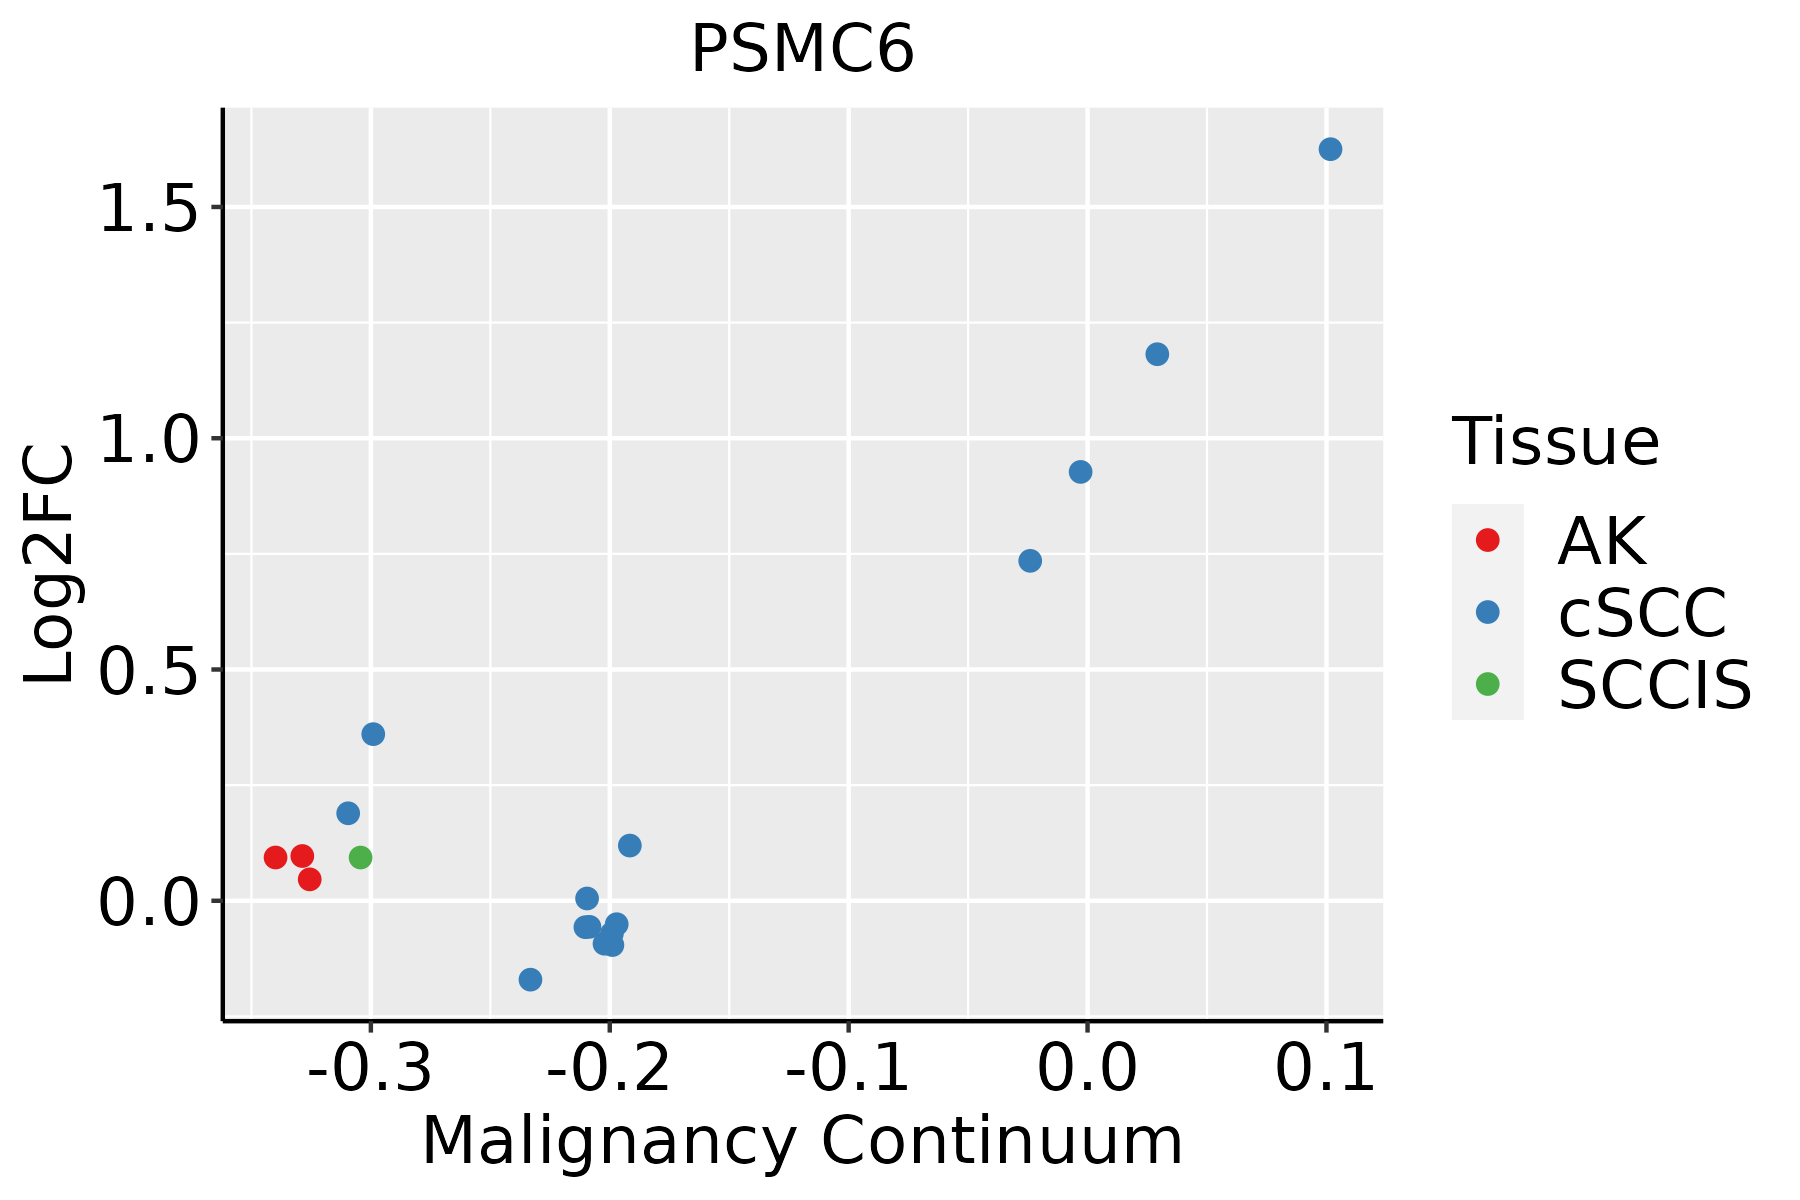 | AK: Actinic keratosis |
| cSCC: Cutaneous squamous cell carcinoma | ||
| SCCIS:squamous cell carcinoma in situ | ||
| Thyroid | 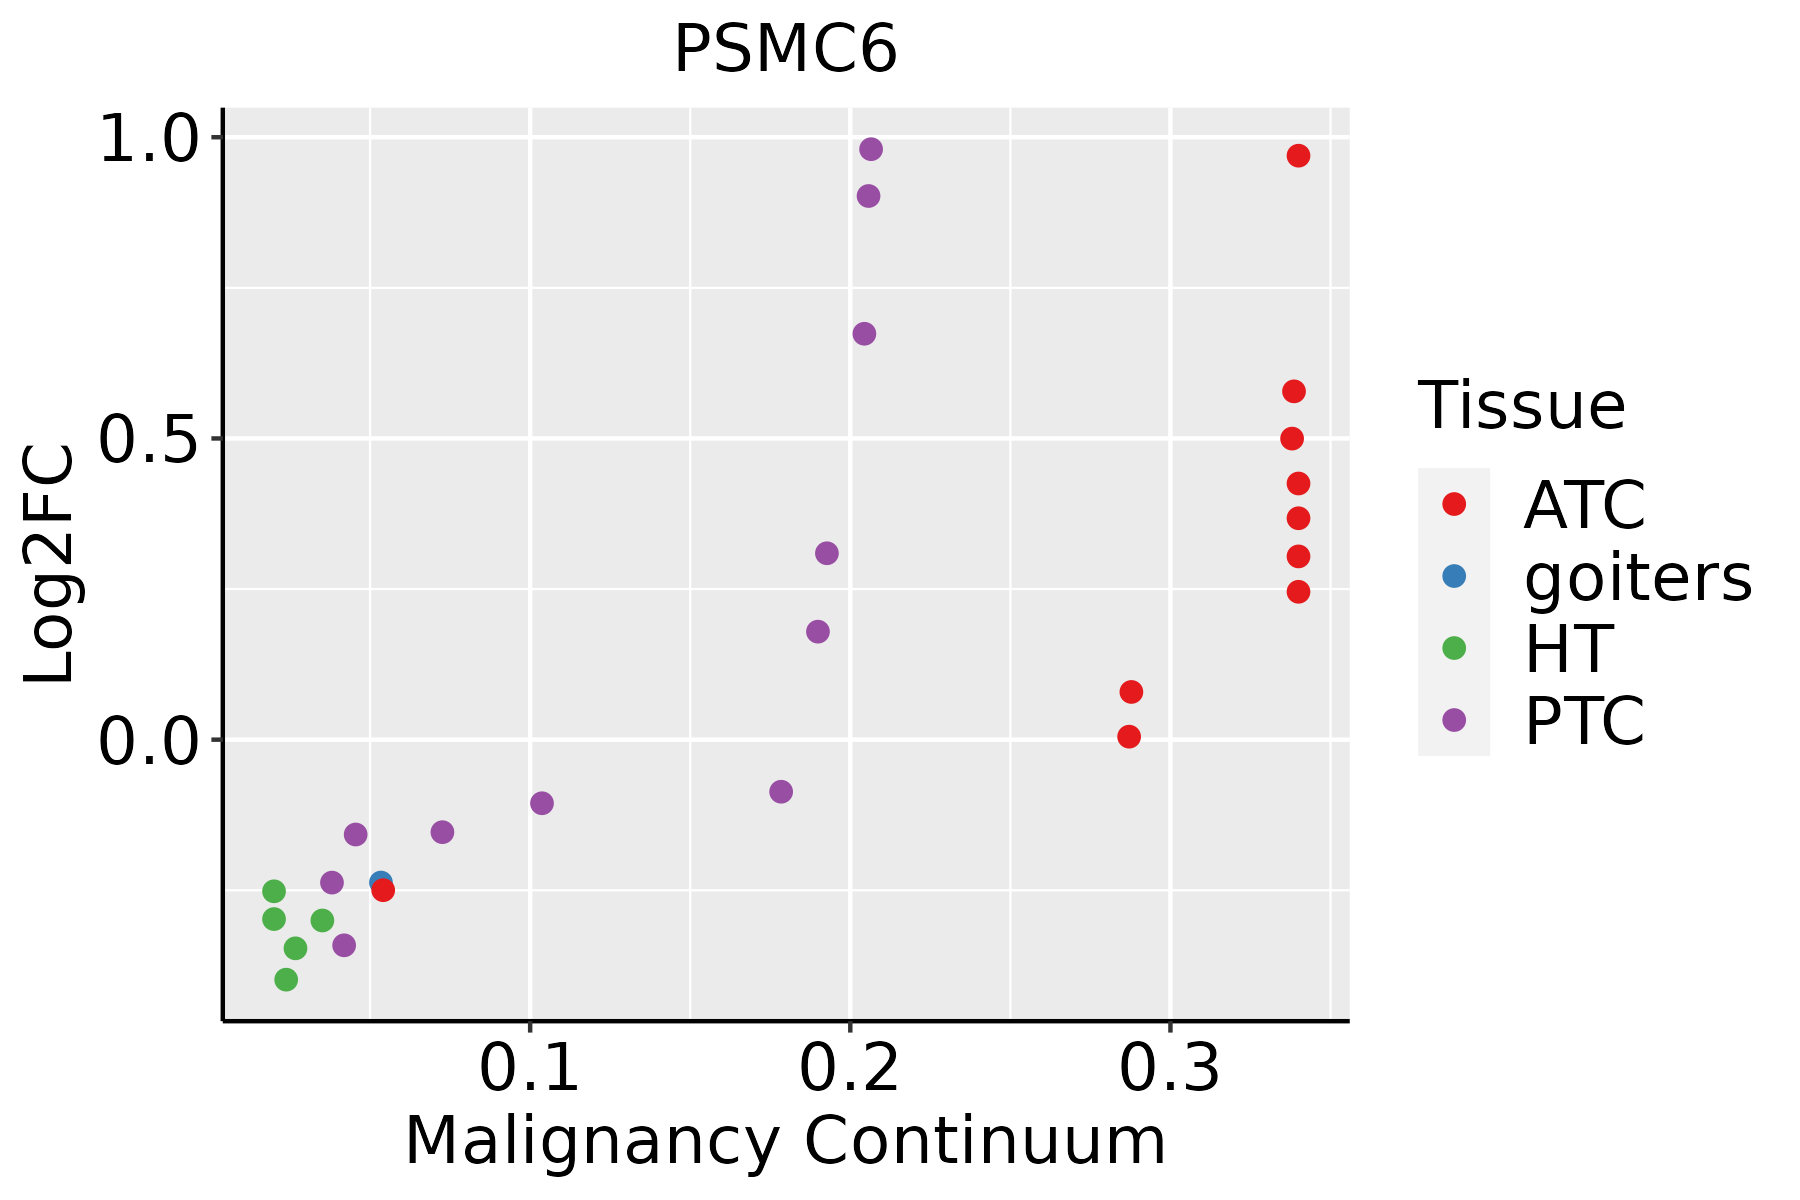 | ATC: Anaplastic thyroid cancer |
| HT: Hashimoto's thyroiditis | ||
| PTC: Papillary thyroid cancer |
| ∗log2FC in expression of this searched gene in stem-like cells from each diseased tissue sample relative to stem-like cells in normal samples in each tissue plotted against the malignancy continuum. Samples are colored based on if they are from different disease stage. |
Top |
Malignant transformation related pathway analysis |
| Find out the enriched GO biological processes and KEGG pathways involved in transition from healthy to precancer to cancer |
| Tissue | Disease Stage | Enriched GO biological Processes |
| Colorectum | AD |  |
| Colorectum | SER |  |
| Colorectum | MSS |  |
| Colorectum | MSI-H |  |
| Colorectum | FAP |  |
| ∗Top 15 enriched GO BP terms are showed in the bar plot of each disease state in each tissue. Each row represents a significant GO biological process which is colored according to the -log10(p.adjust). |
| Page: 1 2 3 4 5 6 7 8 9 |
| GO ID | Tissue | Disease Stage | Description | Gene Ratio | Bg Ratio | pvalue | p.adjust | Count |
| GO:004217627 | Esophagus | HGIN | regulation of protein catabolic process | 119/2587 | 391/18723 | 8.09e-18 | 2.43e-15 | 119 |
| GO:001049826 | Esophagus | HGIN | proteasomal protein catabolic process | 139/2587 | 490/18723 | 1.20e-17 | 3.41e-15 | 139 |
| GO:004586227 | Esophagus | HGIN | positive regulation of proteolysis | 107/2587 | 372/18723 | 2.61e-14 | 4.60e-12 | 107 |
| GO:004316126 | Esophagus | HGIN | proteasome-mediated ubiquitin-dependent protein catabolic process | 114/2587 | 412/18723 | 7.00e-14 | 1.20e-11 | 114 |
| GO:190336227 | Esophagus | HGIN | regulation of cellular protein catabolic process | 81/2587 | 255/18723 | 1.16e-13 | 1.93e-11 | 81 |
| GO:003497625 | Esophagus | HGIN | response to endoplasmic reticulum stress | 81/2587 | 256/18723 | 1.47e-13 | 2.32e-11 | 81 |
| GO:000989626 | Esophagus | HGIN | positive regulation of catabolic process | 126/2587 | 492/18723 | 1.46e-12 | 2.09e-10 | 126 |
| GO:003133126 | Esophagus | HGIN | positive regulation of cellular catabolic process | 112/2587 | 427/18723 | 5.15e-12 | 6.72e-10 | 112 |
| GO:190305027 | Esophagus | HGIN | regulation of proteolysis involved in cellular protein catabolic process | 70/2587 | 221/18723 | 6.21e-12 | 7.76e-10 | 70 |
| GO:006113627 | Esophagus | HGIN | regulation of proteasomal protein catabolic process | 60/2587 | 187/18723 | 1.10e-10 | 1.12e-08 | 60 |
| GO:004573227 | Esophagus | HGIN | positive regulation of protein catabolic process | 69/2587 | 231/18723 | 1.66e-10 | 1.64e-08 | 69 |
| GO:190336427 | Esophagus | HGIN | positive regulation of cellular protein catabolic process | 51/2587 | 155/18723 | 1.01e-09 | 8.15e-08 | 51 |
| GO:190180020 | Esophagus | HGIN | positive regulation of proteasomal protein catabolic process | 41/2587 | 114/18723 | 2.25e-09 | 1.67e-07 | 41 |
| GO:190305219 | Esophagus | HGIN | positive regulation of proteolysis involved in cellular protein catabolic process | 45/2587 | 133/18723 | 3.55e-09 | 2.53e-07 | 45 |
| GO:003133425 | Esophagus | HGIN | positive regulation of protein-containing complex assembly | 61/2587 | 237/18723 | 7.10e-07 | 3.00e-05 | 61 |
| GO:004325427 | Esophagus | HGIN | regulation of protein-containing complex assembly | 94/2587 | 428/18723 | 2.39e-06 | 8.55e-05 | 94 |
| GO:007084118 | Esophagus | HGIN | inclusion body assembly | 11/2587 | 24/18723 | 1.50e-04 | 2.97e-03 | 11 |
| GO:009008316 | Esophagus | HGIN | regulation of inclusion body assembly | 9/2587 | 17/18723 | 1.54e-04 | 3.02e-03 | 9 |
| GO:00365036 | Esophagus | HGIN | ERAD pathway | 27/2587 | 107/18723 | 1.15e-03 | 1.39e-02 | 27 |
| GO:00304335 | Esophagus | HGIN | ubiquitin-dependent ERAD pathway | 22/2587 | 85/18723 | 2.24e-03 | 2.31e-02 | 22 |
| Page: 1 2 3 4 5 6 7 8 9 10 11 12 13 |
| Pathway ID | Tissue | Disease Stage | Description | Gene Ratio | Bg Ratio | pvalue | p.adjust | qvalue | Count |
| hsa0501239 | Esophagus | HGIN | Parkinson disease | 124/1383 | 266/8465 | 5.95e-32 | 9.70e-30 | 7.70e-30 | 124 |
| hsa0501630 | Esophagus | HGIN | Huntington disease | 129/1383 | 306/8465 | 6.81e-28 | 7.41e-26 | 5.88e-26 | 129 |
| hsa0502030 | Esophagus | HGIN | Prion disease | 117/1383 | 273/8465 | 4.15e-26 | 3.38e-24 | 2.69e-24 | 117 |
| hsa0501430 | Esophagus | HGIN | Amyotrophic lateral sclerosis | 140/1383 | 364/8465 | 2.13e-25 | 1.16e-23 | 9.19e-24 | 140 |
| hsa0502230 | Esophagus | HGIN | Pathways of neurodegeneration - multiple diseases | 153/1383 | 476/8465 | 1.22e-18 | 4.41e-17 | 3.50e-17 | 153 |
| hsa0501030 | Esophagus | HGIN | Alzheimer disease | 130/1383 | 384/8465 | 5.26e-18 | 1.71e-16 | 1.36e-16 | 130 |
| hsa0305027 | Esophagus | HGIN | Proteasome | 34/1383 | 46/8465 | 6.45e-18 | 1.91e-16 | 1.52e-16 | 34 |
| hsa0501727 | Esophagus | HGIN | Spinocerebellar ataxia | 43/1383 | 143/8465 | 2.68e-05 | 3.64e-04 | 2.89e-04 | 43 |
| hsa0516930 | Esophagus | HGIN | Epstein-Barr virus infection | 55/1383 | 202/8465 | 5.13e-05 | 6.19e-04 | 4.92e-04 | 55 |
| hsa05012114 | Esophagus | HGIN | Parkinson disease | 124/1383 | 266/8465 | 5.95e-32 | 9.70e-30 | 7.70e-30 | 124 |
| hsa05016113 | Esophagus | HGIN | Huntington disease | 129/1383 | 306/8465 | 6.81e-28 | 7.41e-26 | 5.88e-26 | 129 |
| hsa05020113 | Esophagus | HGIN | Prion disease | 117/1383 | 273/8465 | 4.15e-26 | 3.38e-24 | 2.69e-24 | 117 |
| hsa05014113 | Esophagus | HGIN | Amyotrophic lateral sclerosis | 140/1383 | 364/8465 | 2.13e-25 | 1.16e-23 | 9.19e-24 | 140 |
| hsa05022113 | Esophagus | HGIN | Pathways of neurodegeneration - multiple diseases | 153/1383 | 476/8465 | 1.22e-18 | 4.41e-17 | 3.50e-17 | 153 |
| hsa05010113 | Esophagus | HGIN | Alzheimer disease | 130/1383 | 384/8465 | 5.26e-18 | 1.71e-16 | 1.36e-16 | 130 |
| hsa03050111 | Esophagus | HGIN | Proteasome | 34/1383 | 46/8465 | 6.45e-18 | 1.91e-16 | 1.52e-16 | 34 |
| hsa05017112 | Esophagus | HGIN | Spinocerebellar ataxia | 43/1383 | 143/8465 | 2.68e-05 | 3.64e-04 | 2.89e-04 | 43 |
| hsa05169114 | Esophagus | HGIN | Epstein-Barr virus infection | 55/1383 | 202/8465 | 5.13e-05 | 6.19e-04 | 4.92e-04 | 55 |
| hsa05014210 | Esophagus | ESCC | Amyotrophic lateral sclerosis | 266/4205 | 364/8465 | 1.31e-20 | 2.20e-18 | 1.13e-18 | 266 |
| hsa05016210 | Esophagus | ESCC | Huntington disease | 226/4205 | 306/8465 | 1.38e-18 | 8.72e-17 | 4.46e-17 | 226 |
| Page: 1 2 3 4 5 6 |
Top |
Cell-cell communication analysis |
| Identification of potential cell-cell interactions between two cell types and their ligand-receptor pairs for different disease states |
| Ligand | Receptor | LRpair | Pathway | Tissue | Disease Stage |
| Page: 1 |
Top |
Single-cell gene regulatory network inference analysis |
| Find out the significant the regulons (TFs) and the target genes of each regulon across cell types for different disease states |
| TF | Cell Type | Tissue | Disease Stage | Target Gene | RSS | Regulon Activity |
| ∗The dot plots of a searched regulon are shown for all cell subpopulations in each disease state of each tissue based on the regulon specific score inferred using pySCENIC and by calculating the average expression. |
| Page: 1 |
Top |
Somatic mutation of malignant transformation related genes |
| Annotation of somatic variants for genes involved in malignant transformation |
| Hugo Symbol | Variant Class | Variant Classification | dbSNP RS | HGVSc | HGVSp | HGVSp Short | SWISSPROT | BIOTYPE | SIFT | PolyPhen | Tumor Sample Barcode | Tissue | Histology | Sex | Age | Stage | Therapy Types | Drugs | Outcome |
| PSMC6 | SNV | Missense_Mutation | c.940N>T | p.His314Tyr | p.H314Y | protein_coding | deleterious(0.03) | benign(0.222) | TCGA-A8-A08L-01 | Breast | breast invasive carcinoma | Female | >=65 | III/IV | Unknown | Unknown | SD | ||
| PSMC6 | SNV | Missense_Mutation | novel | c.575C>G | p.Thr192Arg | p.T192R | protein_coding | deleterious(0) | possibly_damaging(0.754) | TCGA-AR-A5QQ-01 | Breast | breast invasive carcinoma | Female | >=65 | III/IV | Chemotherapy | carboplatin | PD | |
| PSMC6 | SNV | Missense_Mutation | novel | c.913C>T | p.Arg305Cys | p.R305C | protein_coding | deleterious(0) | probably_damaging(0.979) | TCGA-EA-A3HU-01 | Cervix | cervical & endocervical cancer | Female | <65 | I/II | Unknown | Unknown | SD | |
| PSMC6 | SNV | Missense_Mutation | c.581A>C | p.Lys194Thr | p.K194T | protein_coding | deleterious(0) | probably_damaging(0.99) | TCGA-FU-A3HZ-01 | Cervix | cervical & endocervical cancer | Female | <65 | I/II | Chemotherapy | cisplatin | CR | ||
| PSMC6 | SNV | Missense_Mutation | c.914N>A | p.Arg305His | p.R305H | protein_coding | deleterious(0.02) | benign(0.118) | TCGA-AZ-4315-01 | Colorectum | colon adenocarcinoma | Male | <65 | I/II | Unknown | Unknown | SD | ||
| PSMC6 | SNV | Missense_Mutation | c.1102G>A | p.Ala368Thr | p.A368T | protein_coding | deleterious(0) | benign(0.144) | TCGA-AZ-6601-01 | Colorectum | colon adenocarcinoma | Male | >=65 | I/II | Unknown | Unknown | PD | ||
| PSMC6 | SNV | Missense_Mutation | novel | c.293G>A | p.Arg98His | p.R98H | protein_coding | deleterious(0.04) | probably_damaging(0.981) | TCGA-CA-6717-01 | Colorectum | colon adenocarcinoma | Male | <65 | I/II | Chemotherapy | oxaliplatin | CR | |
| PSMC6 | SNV | Missense_Mutation | c.779N>A | p.Gly260Asp | p.G260D | protein_coding | deleterious(0.03) | probably_damaging(0.935) | TCGA-G4-6628-01 | Colorectum | colon adenocarcinoma | Male | >=65 | I/II | Unknown | Unknown | SD | ||
| PSMC6 | SNV | Missense_Mutation | c.1117C>A | p.His373Asn | p.H373N | protein_coding | deleterious(0) | benign(0.085) | TCGA-AG-A002-01 | Colorectum | rectum adenocarcinoma | Male | <65 | I/II | Unknown | Unknown | SD | ||
| PSMC6 | deletion | Frame_Shift_Del | c.583delA | p.Thr195HisfsTer16 | p.T195Hfs*16 | protein_coding | TCGA-A6-3809-01 | Colorectum | colon adenocarcinoma | Female | >=65 | I/II | Unknown | Unknown | SD |
| Page: 1 2 3 4 5 |
Top |
Related drugs of malignant transformation related genes |
| Identification of chemicals and drugs interact with genes involved in malignant transfromation |
| (DGIdb 4.0) |
| Entrez ID | Symbol | Category | Interaction Types | Drug Claim Name | Drug Name | PMIDs |
| 5706 | PSMC6 | NA | inhibitor | CARFILZOMIB | CARFILZOMIB | |
| 5706 | PSMC6 | NA | BORTEZOMIB | BORTEZOMIB | 24524217 | |
| 5706 | PSMC6 | NA | inhibitor | CHEMBL451887 | CARFILZOMIB | |
| 5706 | PSMC6 | NA | CARFILZOMIB | CARFILZOMIB | 24524217 | |
| 5706 | PSMC6 | NA | inhibitor | CHEMBL2103884 | OPROZOMIB | |
| 5706 | PSMC6 | NA | inhibitor | CHEMBL325041 | BORTEZOMIB | |
| 5706 | PSMC6 | NA | inhibitor | BORTEZOMIB | BORTEZOMIB | |
| 5706 | PSMC6 | NA | inhibitor | CHEMBL3545432 | IXAZOMIB CITRATE |
| Page: 1 |

Copyright 2023-Present -The University of Texas Health Science Center at Houston |