
|
|||||
|
 | |
| |
| |
| |
| |
| |
|
Gene: PSMC2 |
Gene summary for PSMC2 |
| Gene information | Species | Human | Gene symbol | PSMC2 | Gene ID | 5701 |
| Gene name | proteasome 26S subunit, ATPase 2 | |
| Gene Alias | MSS1 | |
| Cytomap | 7q22.1 | |
| Gene Type | protein-coding | GO ID | GO:0001503 | UniProtAcc | B7Z571 |
Top |
Malignant transformation analysis |
| Identification of the aberrant gene expression in precancerous and cancerous lesions by comparing the gene expression of stem-like cells in diseased tissues with normal stem cells |
| Entrez ID | Symbol | Replicates | Species | Organ | Tissue | Adj P-value | Log2FC | Malignancy |
| 5701 | PSMC2 | GSM4909282 | Human | Breast | IDC | 4.14e-04 | 2.82e-01 | -0.0288 |
| 5701 | PSMC2 | GSM4909311 | Human | Breast | IDC | 9.38e-07 | -1.64e-01 | 0.1534 |
| 5701 | PSMC2 | GSM4909319 | Human | Breast | IDC | 2.73e-11 | -1.26e-01 | 0.1563 |
| 5701 | PSMC2 | brca1 | Human | Breast | Precancer | 3.40e-17 | 5.23e-01 | -0.0338 |
| 5701 | PSMC2 | brca2 | Human | Breast | Precancer | 3.86e-16 | 3.76e-01 | -0.024 |
| 5701 | PSMC2 | brca3 | Human | Breast | Precancer | 1.76e-03 | 2.78e-01 | -0.0263 |
| 5701 | PSMC2 | DCIS2 | Human | Breast | DCIS | 4.06e-43 | 1.38e-01 | 0.0085 |
| 5701 | PSMC2 | HTA11_99999970781_79442 | Human | Colorectum | MSS | 2.28e-22 | 6.53e-01 | 0.294 |
| 5701 | PSMC2 | HTA11_99999965062_69753 | Human | Colorectum | MSI-H | 4.51e-02 | 8.13e-01 | 0.3487 |
| 5701 | PSMC2 | HTA11_99999965104_69814 | Human | Colorectum | MSS | 5.58e-17 | 8.55e-01 | 0.281 |
| 5701 | PSMC2 | HTA11_99999971662_82457 | Human | Colorectum | MSS | 1.46e-08 | 3.77e-01 | 0.3859 |
| 5701 | PSMC2 | LZE2T | Human | Esophagus | ESCC | 4.06e-02 | 4.66e-01 | 0.082 |
| 5701 | PSMC2 | LZE4T | Human | Esophagus | ESCC | 9.05e-14 | 4.21e-01 | 0.0811 |
| 5701 | PSMC2 | LZE7T | Human | Esophagus | ESCC | 1.47e-10 | 6.59e-01 | 0.0667 |
| 5701 | PSMC2 | LZE8T | Human | Esophagus | ESCC | 2.57e-07 | 3.03e-01 | 0.067 |
| 5701 | PSMC2 | LZE20T | Human | Esophagus | ESCC | 4.09e-06 | 3.99e-01 | 0.0662 |
| 5701 | PSMC2 | LZE22D1 | Human | Esophagus | HGIN | 5.71e-03 | -4.35e-03 | 0.0595 |
| 5701 | PSMC2 | LZE22T | Human | Esophagus | ESCC | 5.15e-11 | 8.14e-01 | 0.068 |
| 5701 | PSMC2 | LZE24T | Human | Esophagus | ESCC | 6.21e-22 | 6.82e-01 | 0.0596 |
| 5701 | PSMC2 | LZE6T | Human | Esophagus | ESCC | 2.46e-07 | 4.41e-01 | 0.0845 |
| Page: 1 2 3 4 5 6 7 |
| Tissue | Expression Dynamics | Abbreviation |
| Breast | 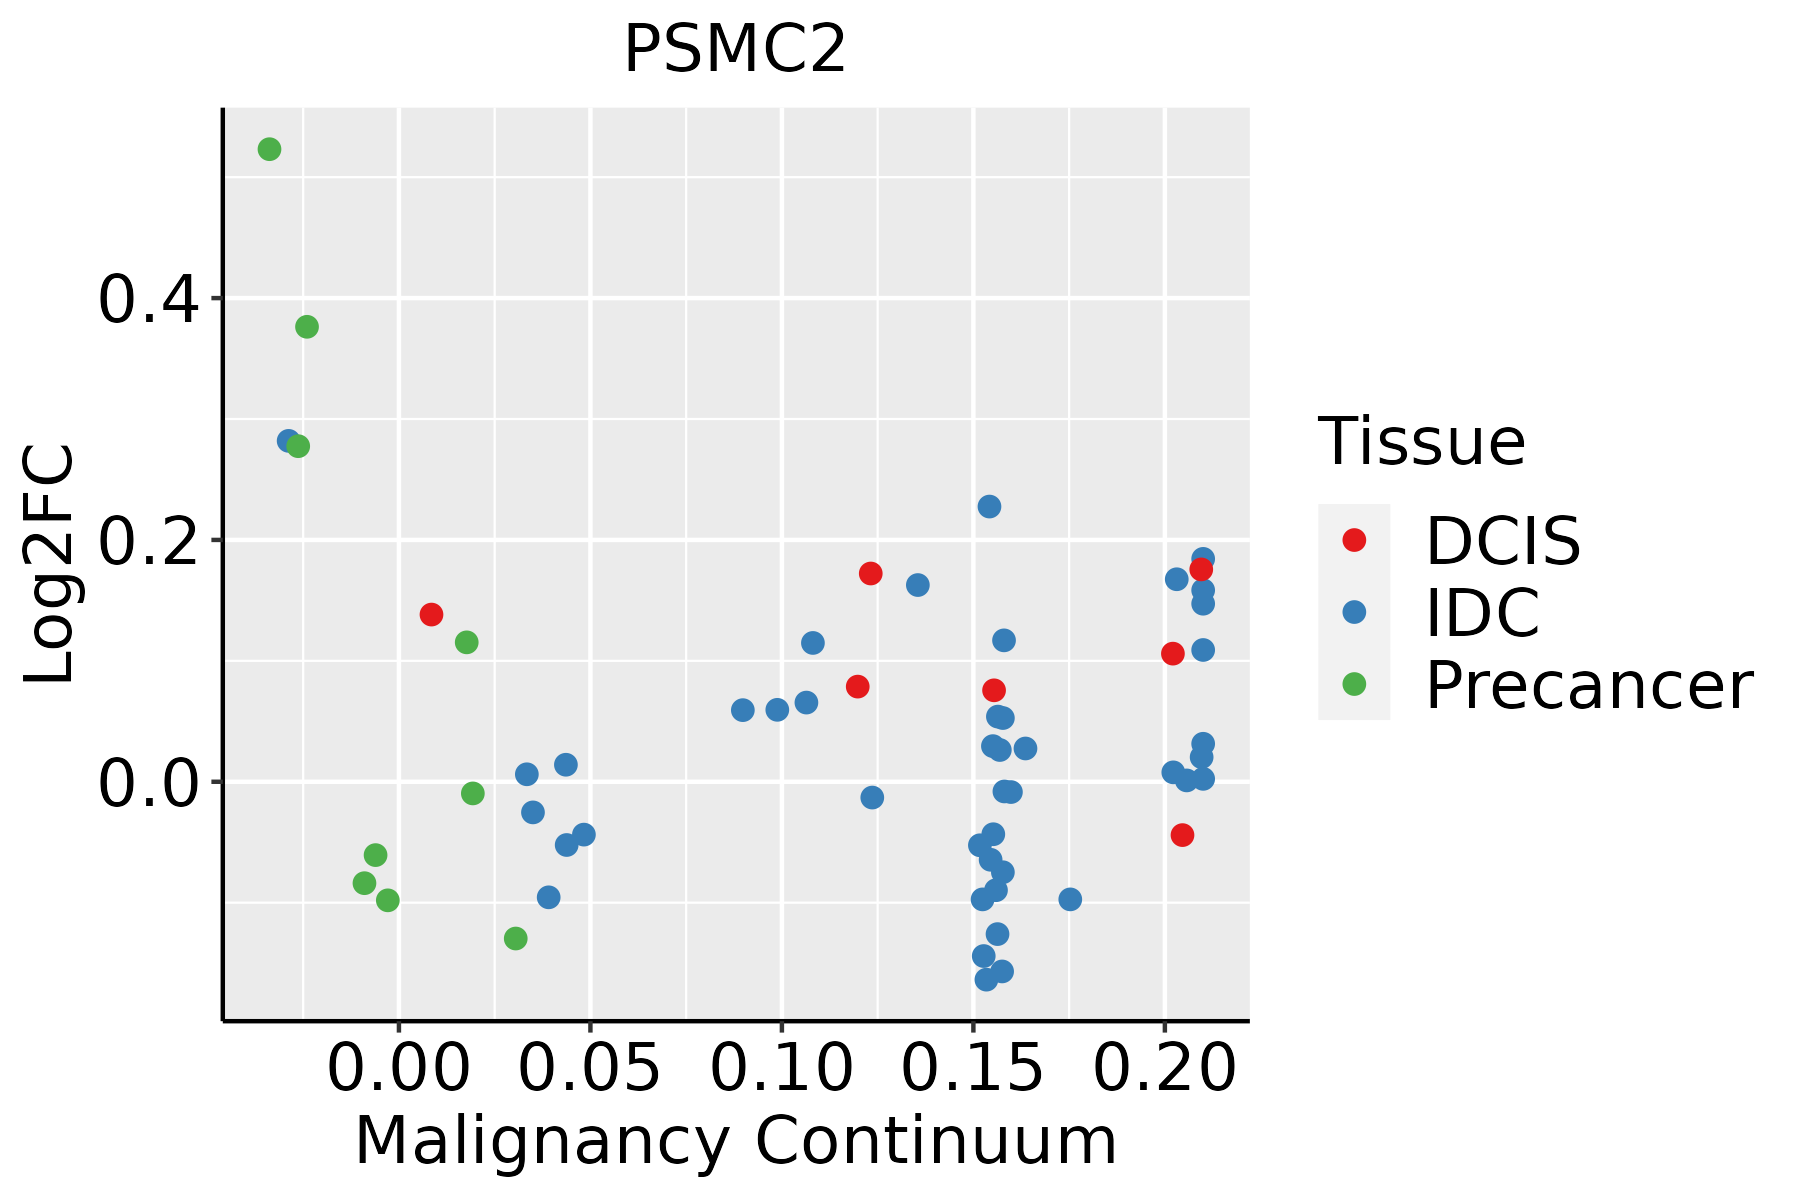 | IDC: Invasive ductal carcinoma |
| DCIS: Ductal carcinoma in situ | ||
| Precancer(BRCA1-mut): Precancerous lesion from BRCA1 mutation carriers | ||
| Colorectum (GSE201348) | 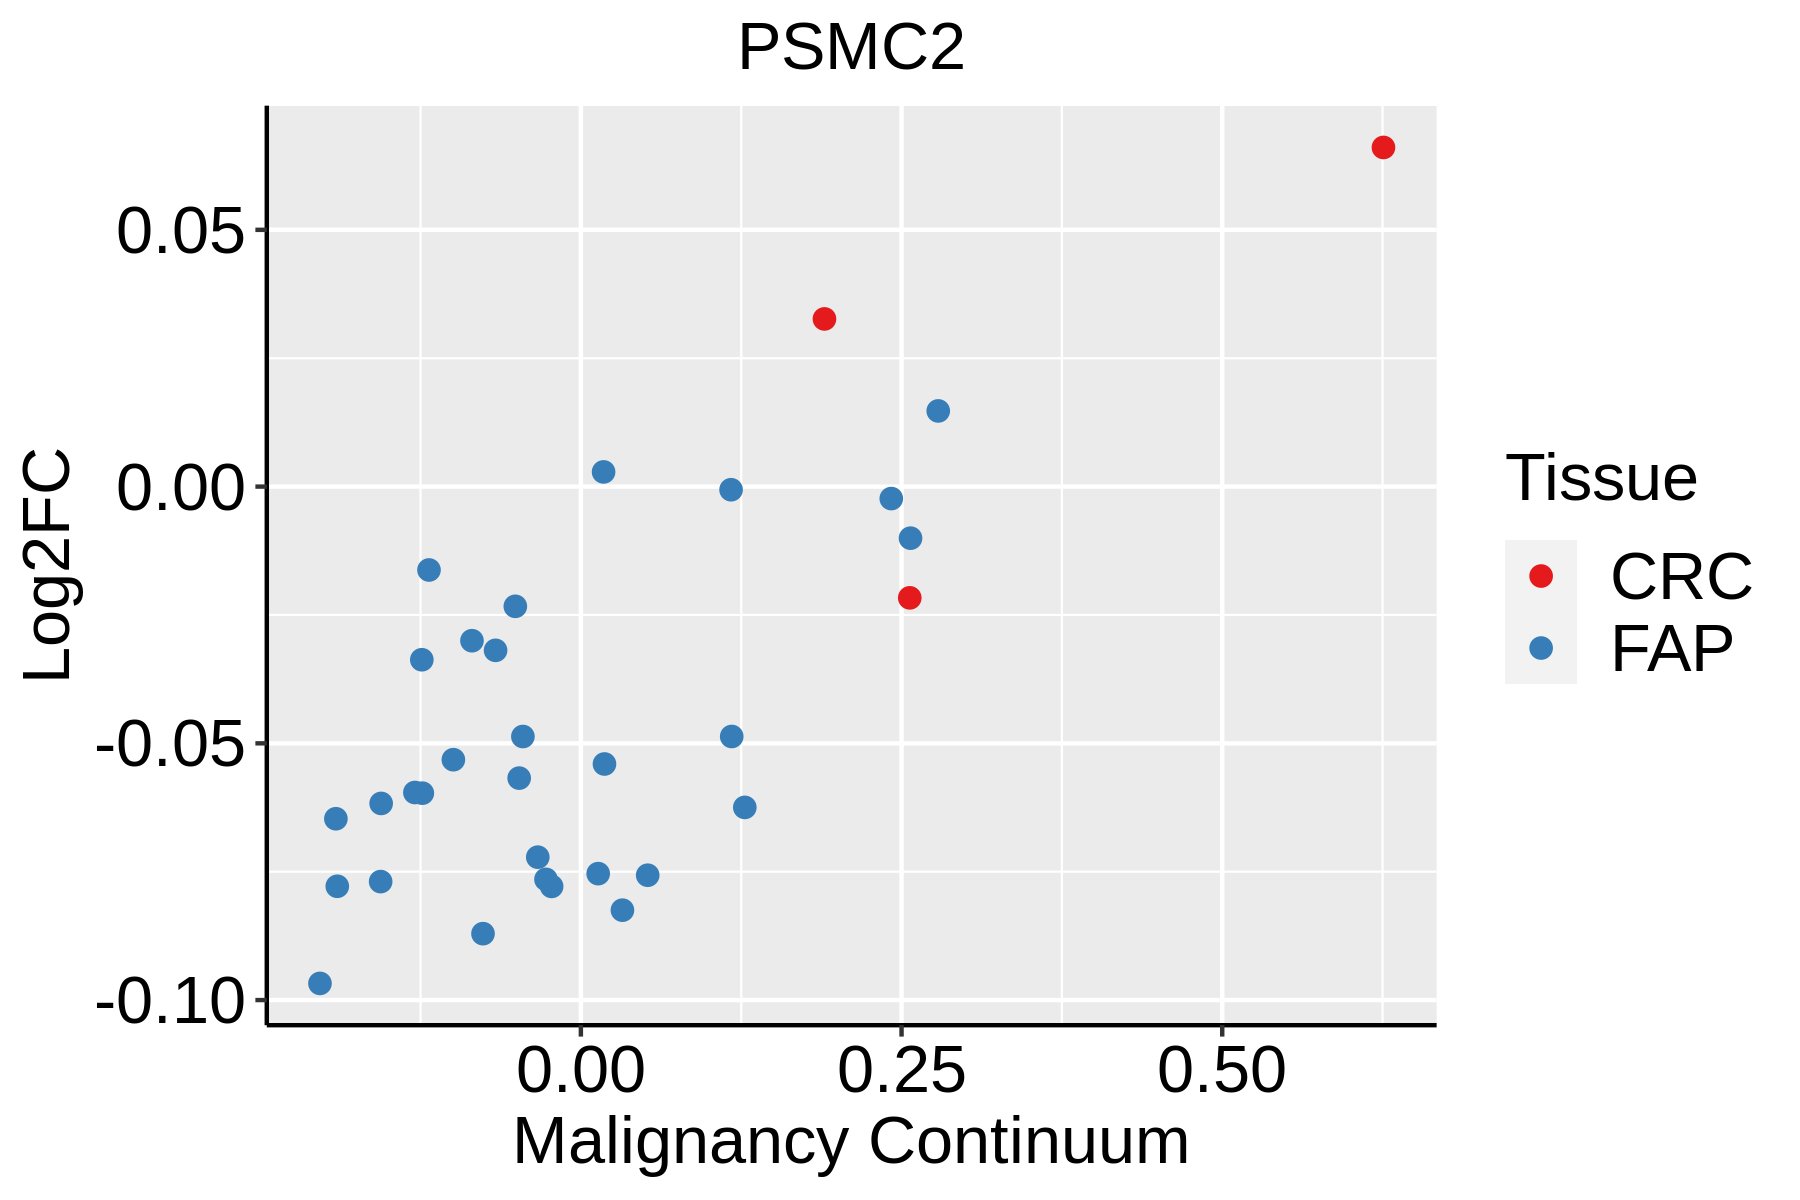 | FAP: Familial adenomatous polyposis |
| CRC: Colorectal cancer | ||
| Colorectum (HTA11) |  | AD: Adenomas |
| SER: Sessile serrated lesions | ||
| MSI-H: Microsatellite-high colorectal cancer | ||
| MSS: Microsatellite stable colorectal cancer | ||
| Esophagus | 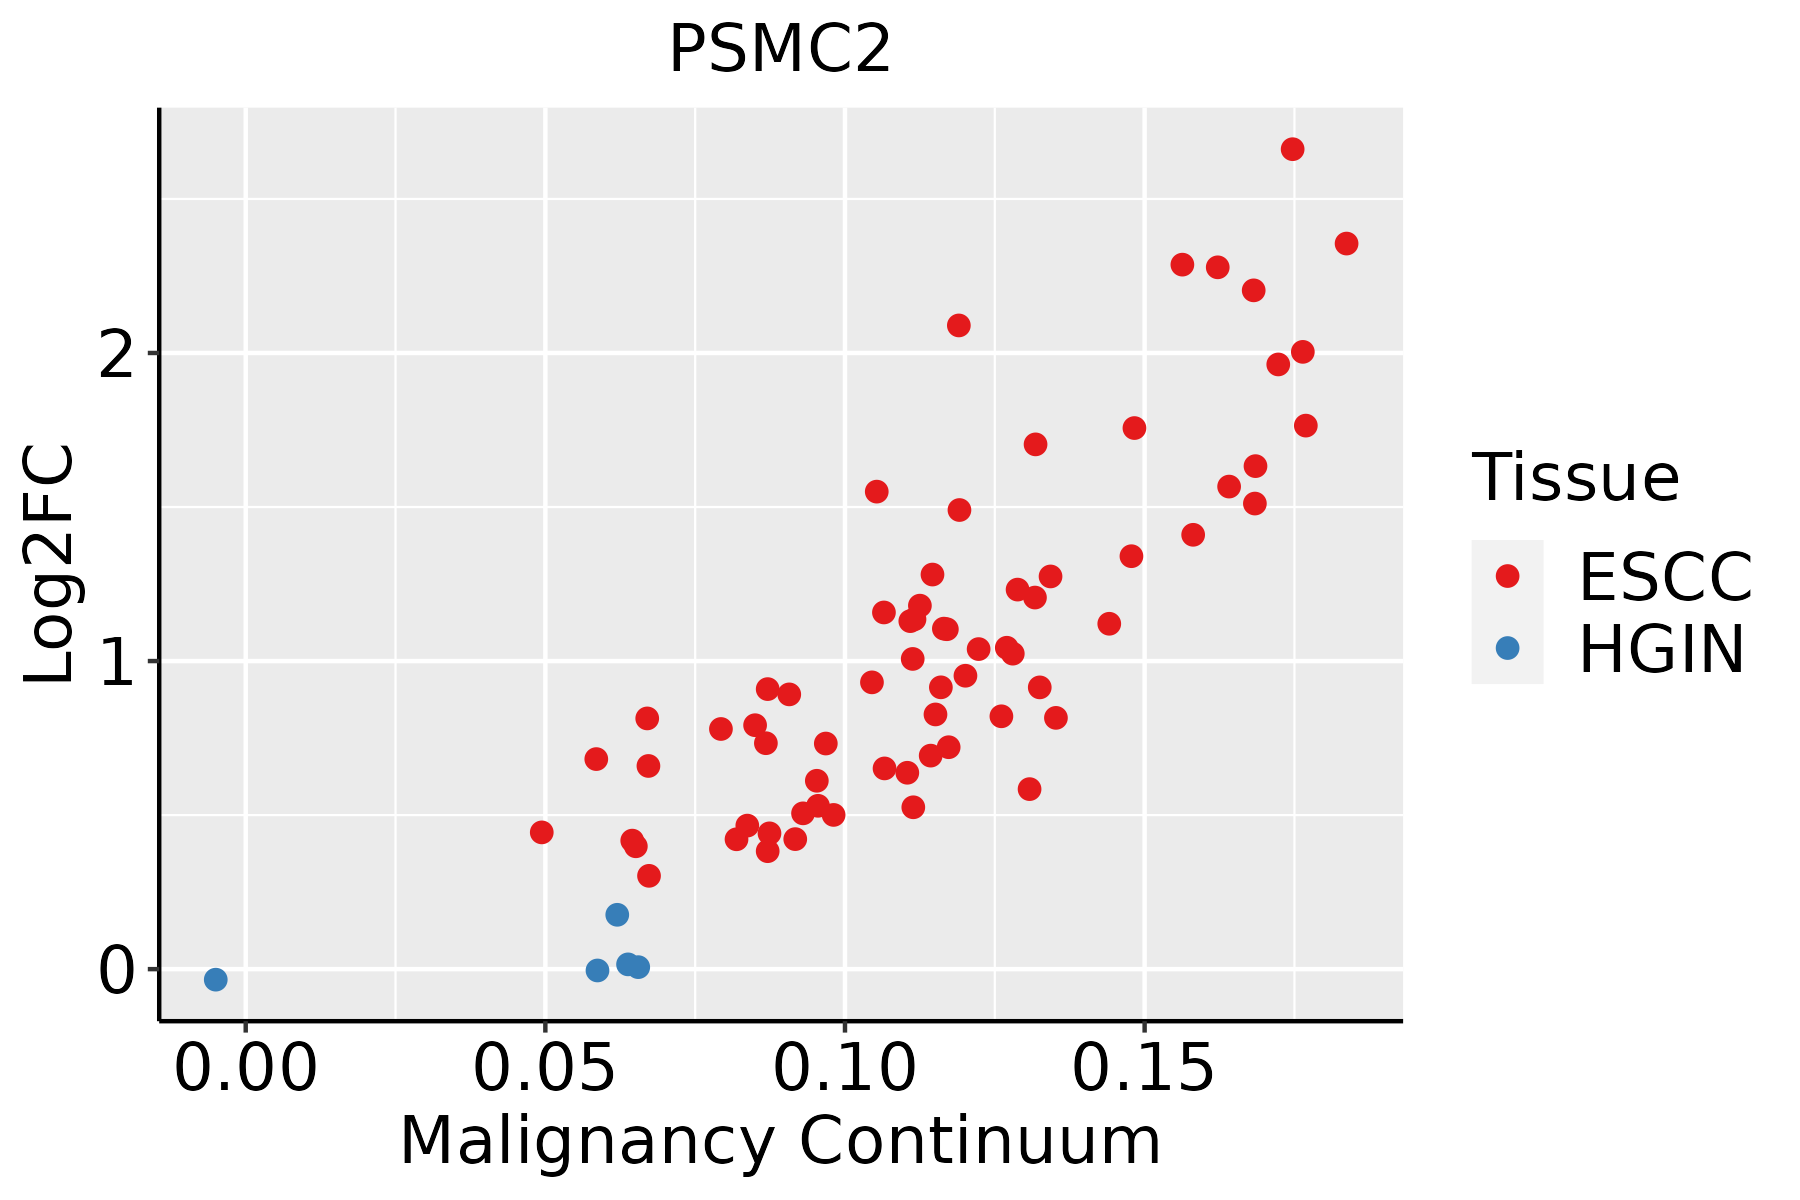 | ESCC: Esophageal squamous cell carcinoma |
| HGIN: High-grade intraepithelial neoplasias | ||
| LGIN: Low-grade intraepithelial neoplasias | ||
| Liver | 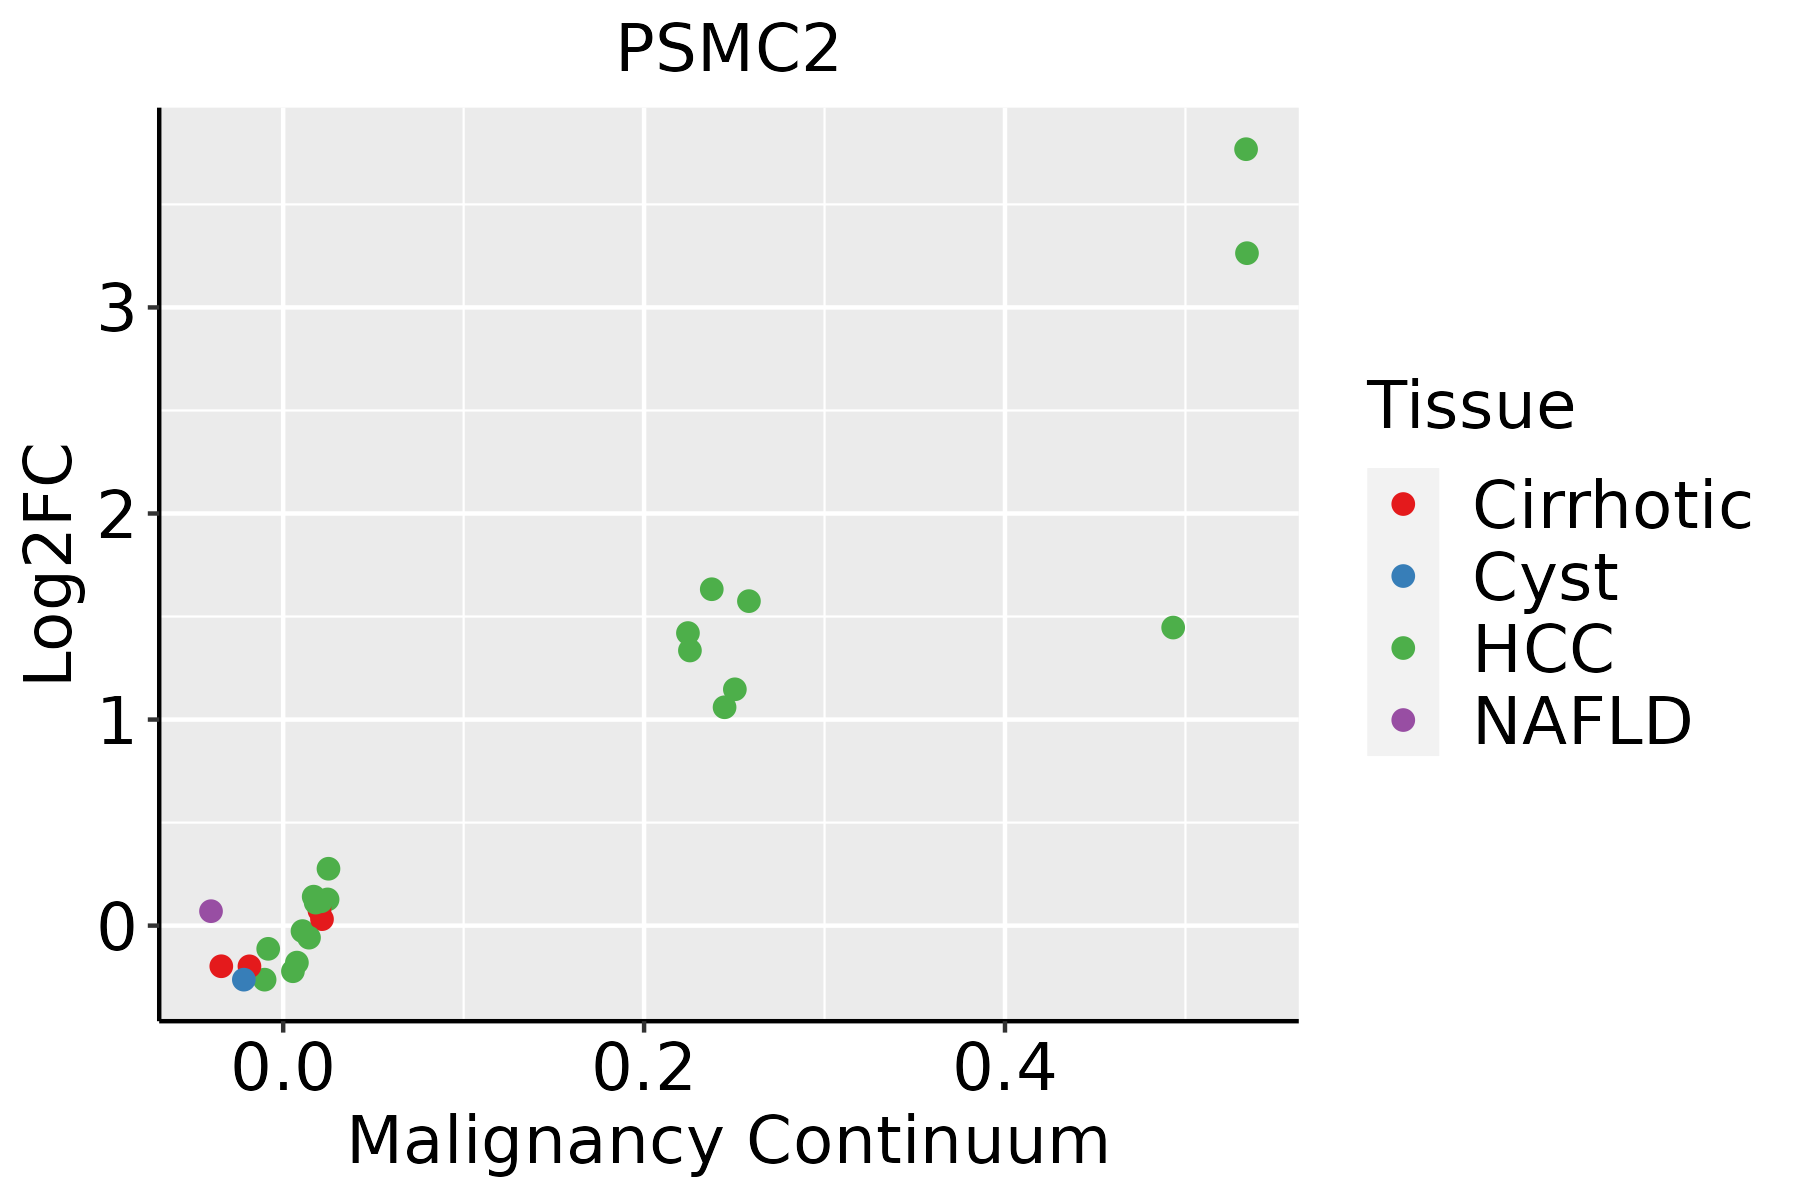 | HCC: Hepatocellular carcinoma |
| NAFLD: Non-alcoholic fatty liver disease | ||
| Oral Cavity |  | EOLP: Erosive Oral lichen planus |
| LP: leukoplakia | ||
| NEOLP: Non-erosive oral lichen planus | ||
| OSCC: Oral squamous cell carcinoma | ||
| Skin | 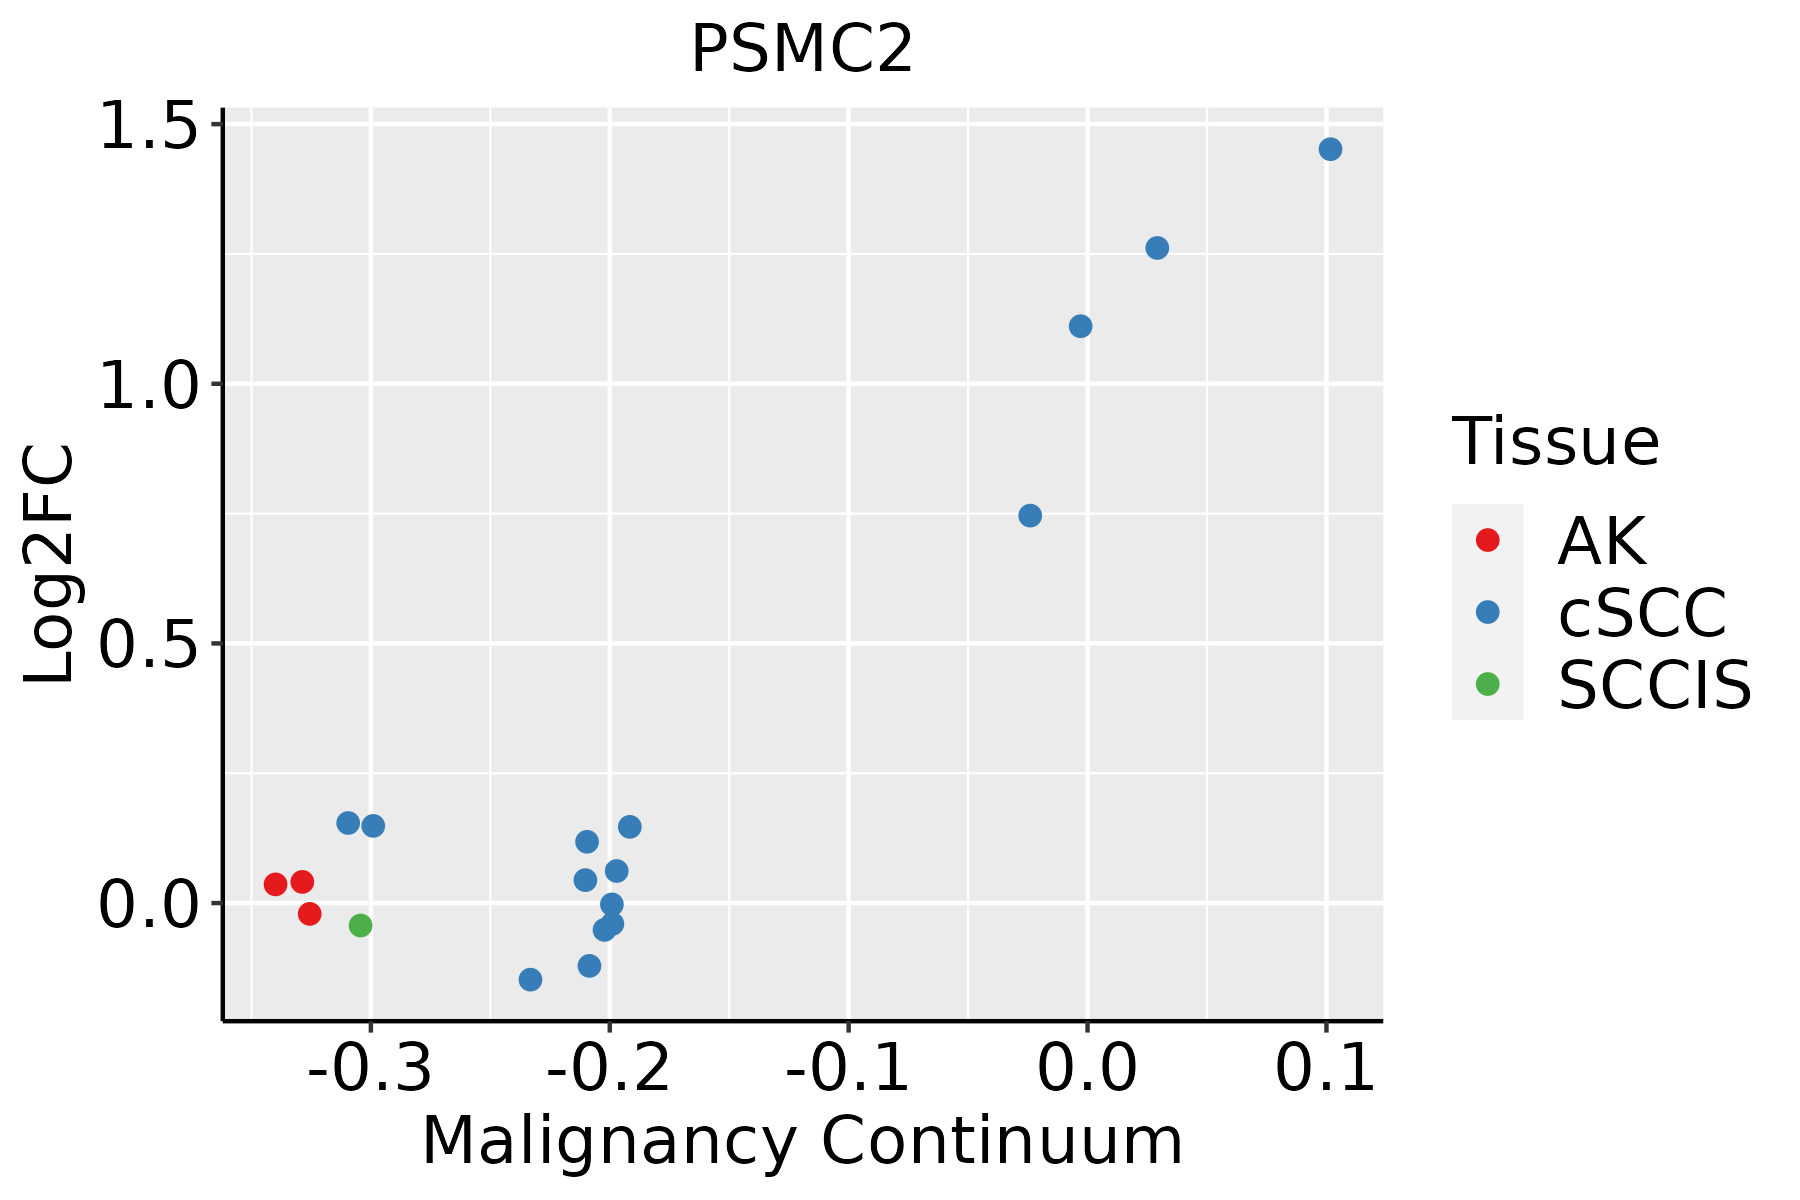 | AK: Actinic keratosis |
| cSCC: Cutaneous squamous cell carcinoma | ||
| SCCIS:squamous cell carcinoma in situ | ||
| Thyroid |  | ATC: Anaplastic thyroid cancer |
| HT: Hashimoto's thyroiditis | ||
| PTC: Papillary thyroid cancer |
| ∗log2FC in expression of this searched gene in stem-like cells from each diseased tissue sample relative to stem-like cells in normal samples in each tissue plotted against the malignancy continuum. Samples are colored based on if they are from different disease stage. |
Top |
Malignant transformation related pathway analysis |
| Find out the enriched GO biological processes and KEGG pathways involved in transition from healthy to precancer to cancer |
| Tissue | Disease Stage | Enriched GO biological Processes |
| Colorectum | AD |  |
| Colorectum | SER |  |
| Colorectum | MSS |  |
| Colorectum | MSI-H |  |
| Colorectum | FAP |  |
| ∗Top 15 enriched GO BP terms are showed in the bar plot of each disease state in each tissue. Each row represents a significant GO biological process which is colored according to the -log10(p.adjust). |
| Page: 1 2 3 4 5 6 7 8 9 |
| GO ID | Tissue | Disease Stage | Description | Gene Ratio | Bg Ratio | pvalue | p.adjust | Count |
| GO:00458629 | Breast | Precancer | positive regulation of proteolysis | 51/1080 | 372/18723 | 7.77e-09 | 5.70e-07 | 51 |
| GO:00104989 | Breast | Precancer | proteasomal protein catabolic process | 58/1080 | 490/18723 | 1.54e-07 | 8.05e-06 | 58 |
| GO:19033629 | Breast | Precancer | regulation of cellular protein catabolic process | 36/1080 | 255/18723 | 6.03e-07 | 2.55e-05 | 36 |
| GO:00421769 | Breast | Precancer | regulation of protein catabolic process | 47/1080 | 391/18723 | 1.50e-06 | 5.58e-05 | 47 |
| GO:19030509 | Breast | Precancer | regulation of proteolysis involved in cellular protein catabolic process | 31/1080 | 221/18723 | 4.10e-06 | 1.27e-04 | 31 |
| GO:00611369 | Breast | Precancer | regulation of proteasomal protein catabolic process | 24/1080 | 187/18723 | 1.99e-04 | 3.14e-03 | 24 |
| GO:00431619 | Breast | Precancer | proteasome-mediated ubiquitin-dependent protein catabolic process | 42/1080 | 412/18723 | 2.49e-04 | 3.72e-03 | 42 |
| GO:00098969 | Breast | Precancer | positive regulation of catabolic process | 48/1080 | 492/18723 | 2.62e-04 | 3.84e-03 | 48 |
| GO:00313319 | Breast | Precancer | positive regulation of cellular catabolic process | 43/1080 | 427/18723 | 2.75e-04 | 4.00e-03 | 43 |
| GO:00016496 | Breast | Precancer | osteoblast differentiation | 27/1080 | 229/18723 | 3.35e-04 | 4.73e-03 | 27 |
| GO:19033649 | Breast | Precancer | positive regulation of cellular protein catabolic process | 20/1080 | 155/18723 | 6.10e-04 | 7.67e-03 | 20 |
| GO:19030527 | Breast | Precancer | positive regulation of proteolysis involved in cellular protein catabolic process | 17/1080 | 133/18723 | 1.68e-03 | 1.70e-02 | 17 |
| GO:00457329 | Breast | Precancer | positive regulation of protein catabolic process | 25/1080 | 231/18723 | 1.87e-03 | 1.82e-02 | 25 |
| GO:19018007 | Breast | Precancer | positive regulation of proteasomal protein catabolic process | 15/1080 | 114/18723 | 2.31e-03 | 2.15e-02 | 15 |
| GO:00015036 | Breast | Precancer | ossification | 36/1080 | 408/18723 | 7.53e-03 | 4.98e-02 | 36 |
| GO:004586214 | Breast | IDC | positive regulation of proteolysis | 66/1434 | 372/18723 | 9.76e-11 | 1.29e-08 | 66 |
| GO:001049814 | Breast | IDC | proteasomal protein catabolic process | 75/1434 | 490/18723 | 5.59e-09 | 4.41e-07 | 75 |
| GO:004217614 | Breast | IDC | regulation of protein catabolic process | 63/1434 | 391/18723 | 1.32e-08 | 9.61e-07 | 63 |
| GO:190336214 | Breast | IDC | regulation of cellular protein catabolic process | 46/1434 | 255/18723 | 4.00e-08 | 2.68e-06 | 46 |
| GO:190305014 | Breast | IDC | regulation of proteolysis involved in cellular protein catabolic process | 41/1434 | 221/18723 | 9.77e-08 | 5.84e-06 | 41 |
| Page: 1 2 3 4 5 6 7 8 9 10 11 |
| Pathway ID | Tissue | Disease Stage | Description | Gene Ratio | Bg Ratio | pvalue | p.adjust | qvalue | Count |
| hsa0501218 | Breast | Precancer | Parkinson disease | 99/684 | 266/8465 | 3.58e-42 | 5.65e-40 | 4.33e-40 | 99 |
| hsa0502016 | Breast | Precancer | Prion disease | 95/684 | 273/8465 | 1.39e-37 | 1.46e-35 | 1.12e-35 | 95 |
| hsa0501616 | Breast | Precancer | Huntington disease | 98/684 | 306/8465 | 2.85e-35 | 2.25e-33 | 1.72e-33 | 98 |
| hsa0501016 | Breast | Precancer | Alzheimer disease | 103/684 | 384/8465 | 1.03e-29 | 4.66e-28 | 3.57e-28 | 103 |
| hsa0501416 | Breast | Precancer | Amyotrophic lateral sclerosis | 98/684 | 364/8465 | 2.13e-28 | 8.41e-27 | 6.44e-27 | 98 |
| hsa0502216 | Breast | Precancer | Pathways of neurodegeneration - multiple diseases | 112/684 | 476/8465 | 6.96e-27 | 2.44e-25 | 1.87e-25 | 112 |
| hsa0305010 | Breast | Precancer | Proteasome | 25/684 | 46/8465 | 4.35e-16 | 9.81e-15 | 7.52e-15 | 25 |
| hsa0501714 | Breast | Precancer | Spinocerebellar ataxia | 29/684 | 143/8465 | 2.79e-06 | 3.83e-05 | 2.94e-05 | 29 |
| hsa0516918 | Breast | Precancer | Epstein-Barr virus infection | 35/684 | 202/8465 | 1.15e-05 | 1.26e-04 | 9.64e-05 | 35 |
| hsa0501219 | Breast | Precancer | Parkinson disease | 99/684 | 266/8465 | 3.58e-42 | 5.65e-40 | 4.33e-40 | 99 |
| hsa0502017 | Breast | Precancer | Prion disease | 95/684 | 273/8465 | 1.39e-37 | 1.46e-35 | 1.12e-35 | 95 |
| hsa0501617 | Breast | Precancer | Huntington disease | 98/684 | 306/8465 | 2.85e-35 | 2.25e-33 | 1.72e-33 | 98 |
| hsa0501017 | Breast | Precancer | Alzheimer disease | 103/684 | 384/8465 | 1.03e-29 | 4.66e-28 | 3.57e-28 | 103 |
| hsa0501417 | Breast | Precancer | Amyotrophic lateral sclerosis | 98/684 | 364/8465 | 2.13e-28 | 8.41e-27 | 6.44e-27 | 98 |
| hsa0502217 | Breast | Precancer | Pathways of neurodegeneration - multiple diseases | 112/684 | 476/8465 | 6.96e-27 | 2.44e-25 | 1.87e-25 | 112 |
| hsa0305013 | Breast | Precancer | Proteasome | 25/684 | 46/8465 | 4.35e-16 | 9.81e-15 | 7.52e-15 | 25 |
| hsa0501715 | Breast | Precancer | Spinocerebellar ataxia | 29/684 | 143/8465 | 2.79e-06 | 3.83e-05 | 2.94e-05 | 29 |
| hsa0516919 | Breast | Precancer | Epstein-Barr virus infection | 35/684 | 202/8465 | 1.15e-05 | 1.26e-04 | 9.64e-05 | 35 |
| hsa0501224 | Breast | IDC | Parkinson disease | 107/867 | 266/8465 | 2.57e-39 | 8.36e-37 | 6.26e-37 | 107 |
| hsa0502023 | Breast | IDC | Prion disease | 102/867 | 273/8465 | 3.70e-34 | 4.01e-32 | 3.00e-32 | 102 |
| Page: 1 2 3 4 5 6 7 8 9 |
Top |
Cell-cell communication analysis |
| Identification of potential cell-cell interactions between two cell types and their ligand-receptor pairs for different disease states |
| Ligand | Receptor | LRpair | Pathway | Tissue | Disease Stage |
| Page: 1 |
Top |
Single-cell gene regulatory network inference analysis |
| Find out the significant the regulons (TFs) and the target genes of each regulon across cell types for different disease states |
| TF | Cell Type | Tissue | Disease Stage | Target Gene | RSS | Regulon Activity |
| ∗The dot plots of a searched regulon are shown for all cell subpopulations in each disease state of each tissue based on the regulon specific score inferred using pySCENIC and by calculating the average expression. |
| Page: 1 |
Top |
Somatic mutation of malignant transformation related genes |
| Annotation of somatic variants for genes involved in malignant transformation |
| Hugo Symbol | Variant Class | Variant Classification | dbSNP RS | HGVSc | HGVSp | HGVSp Short | SWISSPROT | BIOTYPE | SIFT | PolyPhen | Tumor Sample Barcode | Tissue | Histology | Sex | Age | Stage | Therapy Types | Drugs | Outcome |
| PSMC2 | SNV | Missense_Mutation | c.700G>C | p.Asp234His | p.D234H | P35998 | protein_coding | deleterious(0.01) | probably_damaging(0.999) | TCGA-A2-A0CL-01 | Breast | breast invasive carcinoma | Female | <65 | III/IV | Chemotherapy | cytoxan | SD | |
| PSMC2 | SNV | Missense_Mutation | rs760946308 | c.1191C>G | p.Ile397Met | p.I397M | P35998 | protein_coding | deleterious(0) | probably_damaging(0.996) | TCGA-DS-A0VK-01 | Cervix | cervical & endocervical cancer | Female | <65 | I/II | Chemotherapy | carboplatin | PD |
| PSMC2 | SNV | Missense_Mutation | c.48N>T | p.Glu16Asp | p.E16D | P35998 | protein_coding | tolerated_low_confidence(0.39) | benign(0) | TCGA-EK-A2PG-01 | Cervix | cervical & endocervical cancer | Female | >=65 | I/II | Unknown | Unknown | SD | |
| PSMC2 | SNV | Missense_Mutation | novel | c.680N>T | p.Arg227Leu | p.R227L | P35998 | protein_coding | deleterious(0) | probably_damaging(0.998) | TCGA-FU-A23L-01 | Cervix | cervical & endocervical cancer | Female | <65 | I/II | Chemotherapy | cisplatin | CR |
| PSMC2 | SNV | Missense_Mutation | novel | c.806C>T | p.Ala269Val | p.A269V | P35998 | protein_coding | deleterious(0.01) | probably_damaging(0.998) | TCGA-VS-A94Z-01 | Cervix | cervical & endocervical cancer | Female | <65 | I/II | Chemotherapy | cisplatin | CR |
| PSMC2 | SNV | Missense_Mutation | novel | c.65N>C | p.Ile22Thr | p.I22T | P35998 | protein_coding | tolerated_low_confidence(0.12) | benign(0.05) | TCGA-VS-A9UJ-01 | Cervix | cervical & endocervical cancer | Female | <65 | I/II | Unknown | Unknown | PD |
| PSMC2 | SNV | Missense_Mutation | rs771939160 | c.1078N>T | p.Arg360Cys | p.R360C | P35998 | protein_coding | deleterious(0) | possibly_damaging(0.511) | TCGA-A6-A566-01 | Colorectum | colon adenocarcinoma | Female | <65 | III/IV | Chemotherapy | oxaliplatin | PD |
| PSMC2 | SNV | Missense_Mutation | c.890N>T | p.Arg297Ile | p.R297I | P35998 | protein_coding | deleterious(0) | probably_damaging(0.996) | TCGA-AA-A010-01 | Colorectum | colon adenocarcinoma | Female | <65 | I/II | Chemotherapy | folinic | CR | |
| PSMC2 | SNV | Missense_Mutation | c.772N>T | p.Arg258Cys | p.R258C | P35998 | protein_coding | deleterious(0) | probably_damaging(0.999) | TCGA-AZ-4315-01 | Colorectum | colon adenocarcinoma | Male | <65 | I/II | Unknown | Unknown | SD | |
| PSMC2 | SNV | Missense_Mutation | novel | c.171G>T | p.Lys57Asn | p.K57N | P35998 | protein_coding | tolerated(0.18) | benign(0.167) | TCGA-CA-6717-01 | Colorectum | colon adenocarcinoma | Male | <65 | I/II | Chemotherapy | oxaliplatin | CR |
| Page: 1 2 3 4 5 6 |
Top |
Related drugs of malignant transformation related genes |
| Identification of chemicals and drugs interact with genes involved in malignant transfromation |
| (DGIdb 4.0) |
| Entrez ID | Symbol | Category | Interaction Types | Drug Claim Name | Drug Name | PMIDs |
| 5701 | PSMC2 | PROTEASE, TRANSCRIPTION FACTOR | inhibitor | CHEMBL325041 | BORTEZOMIB | |
| 5701 | PSMC2 | PROTEASE, TRANSCRIPTION FACTOR | BORTEZOMIB | BORTEZOMIB | 24524217 | |
| 5701 | PSMC2 | PROTEASE, TRANSCRIPTION FACTOR | inhibitor | CHEMBL3545432 | IXAZOMIB CITRATE | |
| 5701 | PSMC2 | PROTEASE, TRANSCRIPTION FACTOR | inhibitor | CARFILZOMIB | CARFILZOMIB | |
| 5701 | PSMC2 | PROTEASE, TRANSCRIPTION FACTOR | CARFILZOMIB | CARFILZOMIB | 24524217 | |
| 5701 | PSMC2 | PROTEASE, TRANSCRIPTION FACTOR | inhibitor | CHEMBL2103884 | OPROZOMIB | |
| 5701 | PSMC2 | PROTEASE, TRANSCRIPTION FACTOR | inhibitor | CHEMBL451887 | CARFILZOMIB | |
| 5701 | PSMC2 | PROTEASE, TRANSCRIPTION FACTOR | inhibitor | BORTEZOMIB | BORTEZOMIB |
| Page: 1 |

Copyright 2023-Present -The University of Texas Health Science Center at Houston |