
|
|||||
|
 | |
| |
| |
| |
| |
| |
|
Gene: PSMC1 |
Gene summary for PSMC1 |
| Gene information | Species | Human | Gene symbol | PSMC1 | Gene ID | 5700 |
| Gene name | proteasome 26S subunit, ATPase 1 | |
| Gene Alias | P26S4 | |
| Cytomap | 14q32.11 | |
| Gene Type | protein-coding | GO ID | GO:0006508 | UniProtAcc | P62191 |
Top |
Malignant transformation analysis |
| Identification of the aberrant gene expression in precancerous and cancerous lesions by comparing the gene expression of stem-like cells in diseased tissues with normal stem cells |
| Entrez ID | Symbol | Replicates | Species | Organ | Tissue | Adj P-value | Log2FC | Malignancy |
| 5700 | PSMC1 | LZE2T | Human | Esophagus | ESCC | 1.95e-04 | 1.03e+00 | 0.082 |
| 5700 | PSMC1 | LZE4T | Human | Esophagus | ESCC | 1.34e-33 | 1.15e+00 | 0.0811 |
| 5700 | PSMC1 | LZE5T | Human | Esophagus | ESCC | 1.60e-07 | 8.41e-01 | 0.0514 |
| 5700 | PSMC1 | LZE7T | Human | Esophagus | ESCC | 4.35e-09 | 7.28e-01 | 0.0667 |
| 5700 | PSMC1 | LZE8T | Human | Esophagus | ESCC | 1.25e-11 | 6.53e-01 | 0.067 |
| 5700 | PSMC1 | LZE20T | Human | Esophagus | ESCC | 3.58e-22 | 9.78e-01 | 0.0662 |
| 5700 | PSMC1 | LZE22T | Human | Esophagus | ESCC | 6.91e-08 | 7.11e-01 | 0.068 |
| 5700 | PSMC1 | LZE24T | Human | Esophagus | ESCC | 5.30e-29 | 9.13e-01 | 0.0596 |
| 5700 | PSMC1 | LZE21T | Human | Esophagus | ESCC | 6.37e-05 | 8.66e-01 | 0.0655 |
| 5700 | PSMC1 | LZE6T | Human | Esophagus | ESCC | 3.65e-17 | 9.39e-01 | 0.0845 |
| 5700 | PSMC1 | P1T-E | Human | Esophagus | ESCC | 1.56e-09 | 8.04e-01 | 0.0875 |
| 5700 | PSMC1 | P2T-E | Human | Esophagus | ESCC | 3.37e-56 | 1.06e+00 | 0.1177 |
| 5700 | PSMC1 | P4T-E | Human | Esophagus | ESCC | 2.18e-66 | 1.45e+00 | 0.1323 |
| 5700 | PSMC1 | P5T-E | Human | Esophagus | ESCC | 2.36e-54 | 1.13e+00 | 0.1327 |
| 5700 | PSMC1 | P8T-E | Human | Esophagus | ESCC | 1.52e-62 | 1.34e+00 | 0.0889 |
| 5700 | PSMC1 | P9T-E | Human | Esophagus | ESCC | 1.93e-29 | 7.44e-01 | 0.1131 |
| 5700 | PSMC1 | P10T-E | Human | Esophagus | ESCC | 3.84e-85 | 1.51e+00 | 0.116 |
| 5700 | PSMC1 | P11T-E | Human | Esophagus | ESCC | 2.59e-33 | 1.56e+00 | 0.1426 |
| 5700 | PSMC1 | P12T-E | Human | Esophagus | ESCC | 1.93e-79 | 1.67e+00 | 0.1122 |
| 5700 | PSMC1 | P15T-E | Human | Esophagus | ESCC | 1.81e-83 | 2.05e+00 | 0.1149 |
| Page: 1 2 3 4 5 6 7 |
| Tissue | Expression Dynamics | Abbreviation |
| Esophagus | 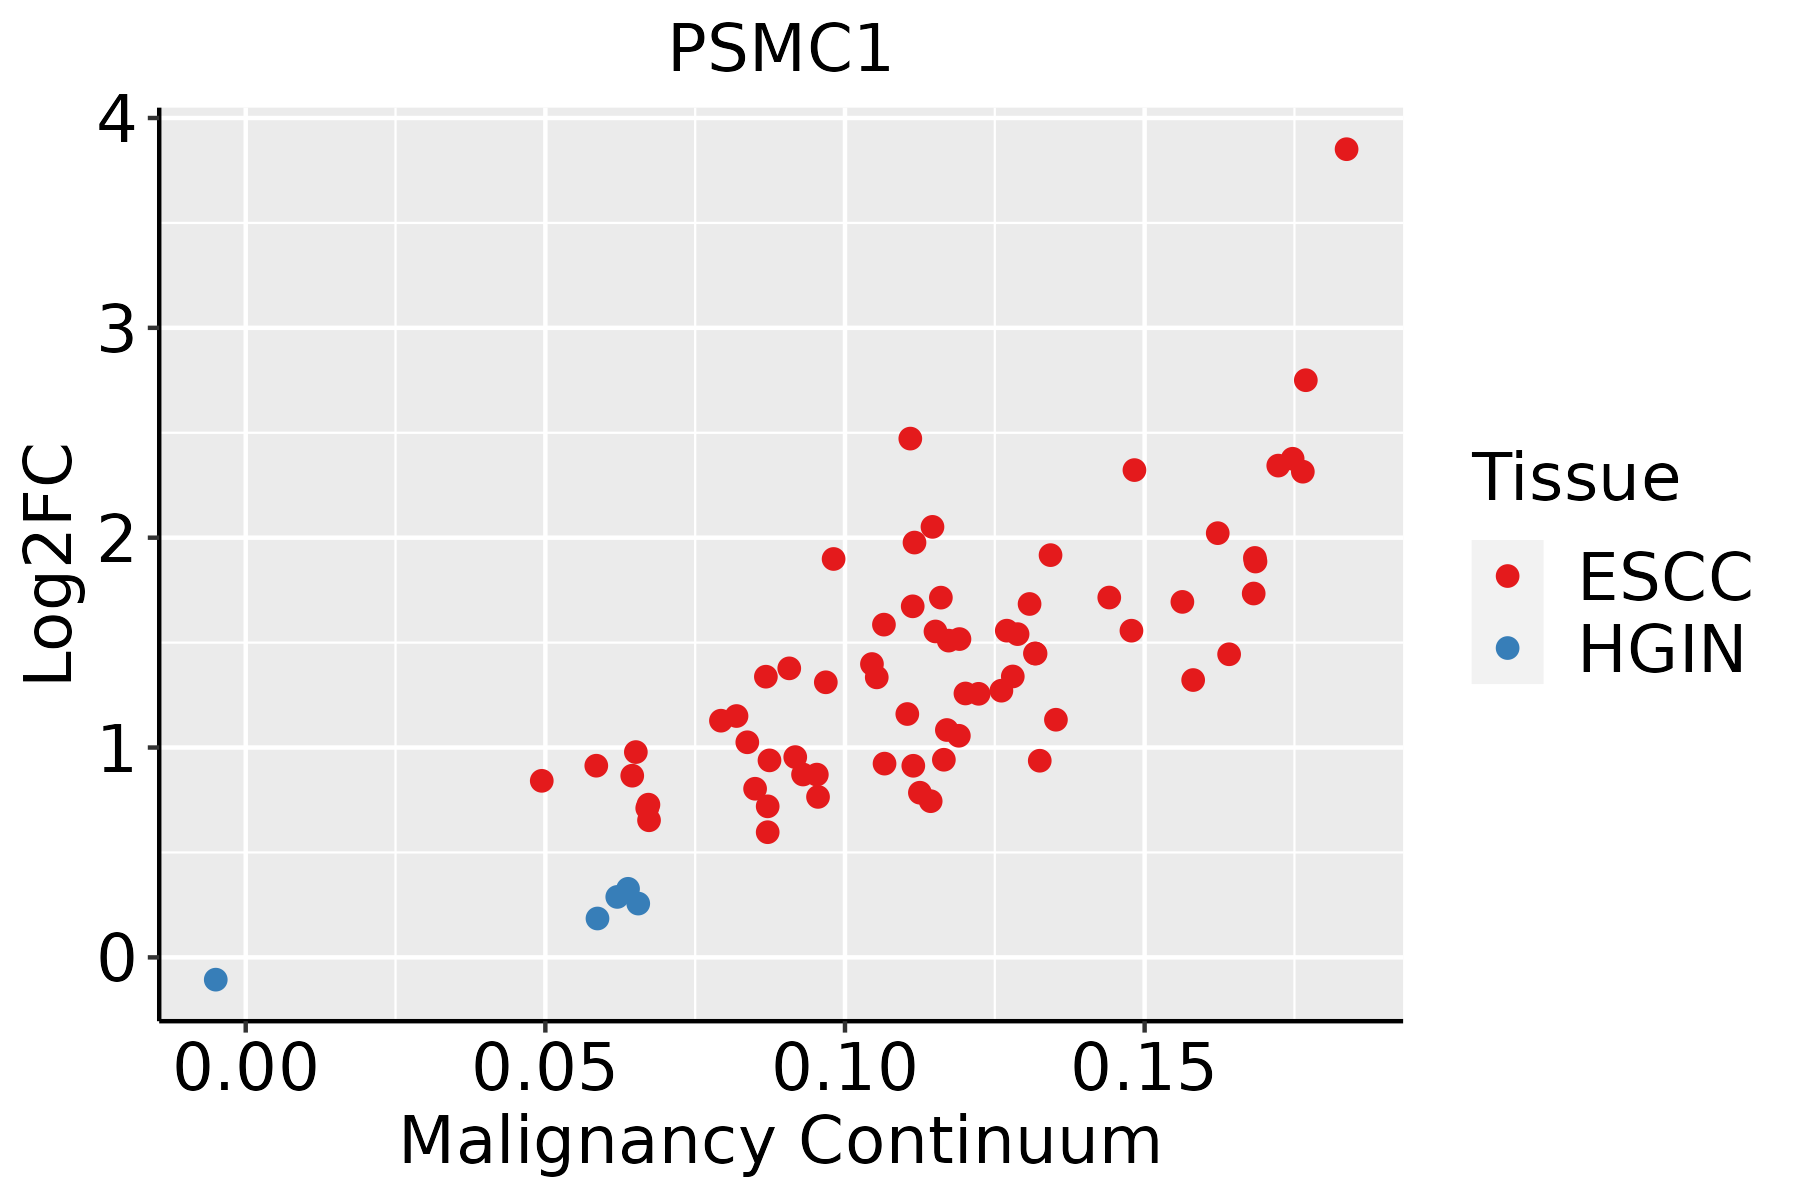 | ESCC: Esophageal squamous cell carcinoma |
| HGIN: High-grade intraepithelial neoplasias | ||
| LGIN: Low-grade intraepithelial neoplasias | ||
| Liver |  | HCC: Hepatocellular carcinoma |
| NAFLD: Non-alcoholic fatty liver disease | ||
| Lung |  | AAH: Atypical adenomatous hyperplasia |
| AIS: Adenocarcinoma in situ | ||
| IAC: Invasive lung adenocarcinoma | ||
| MIA: Minimally invasive adenocarcinoma | ||
| Oral Cavity | 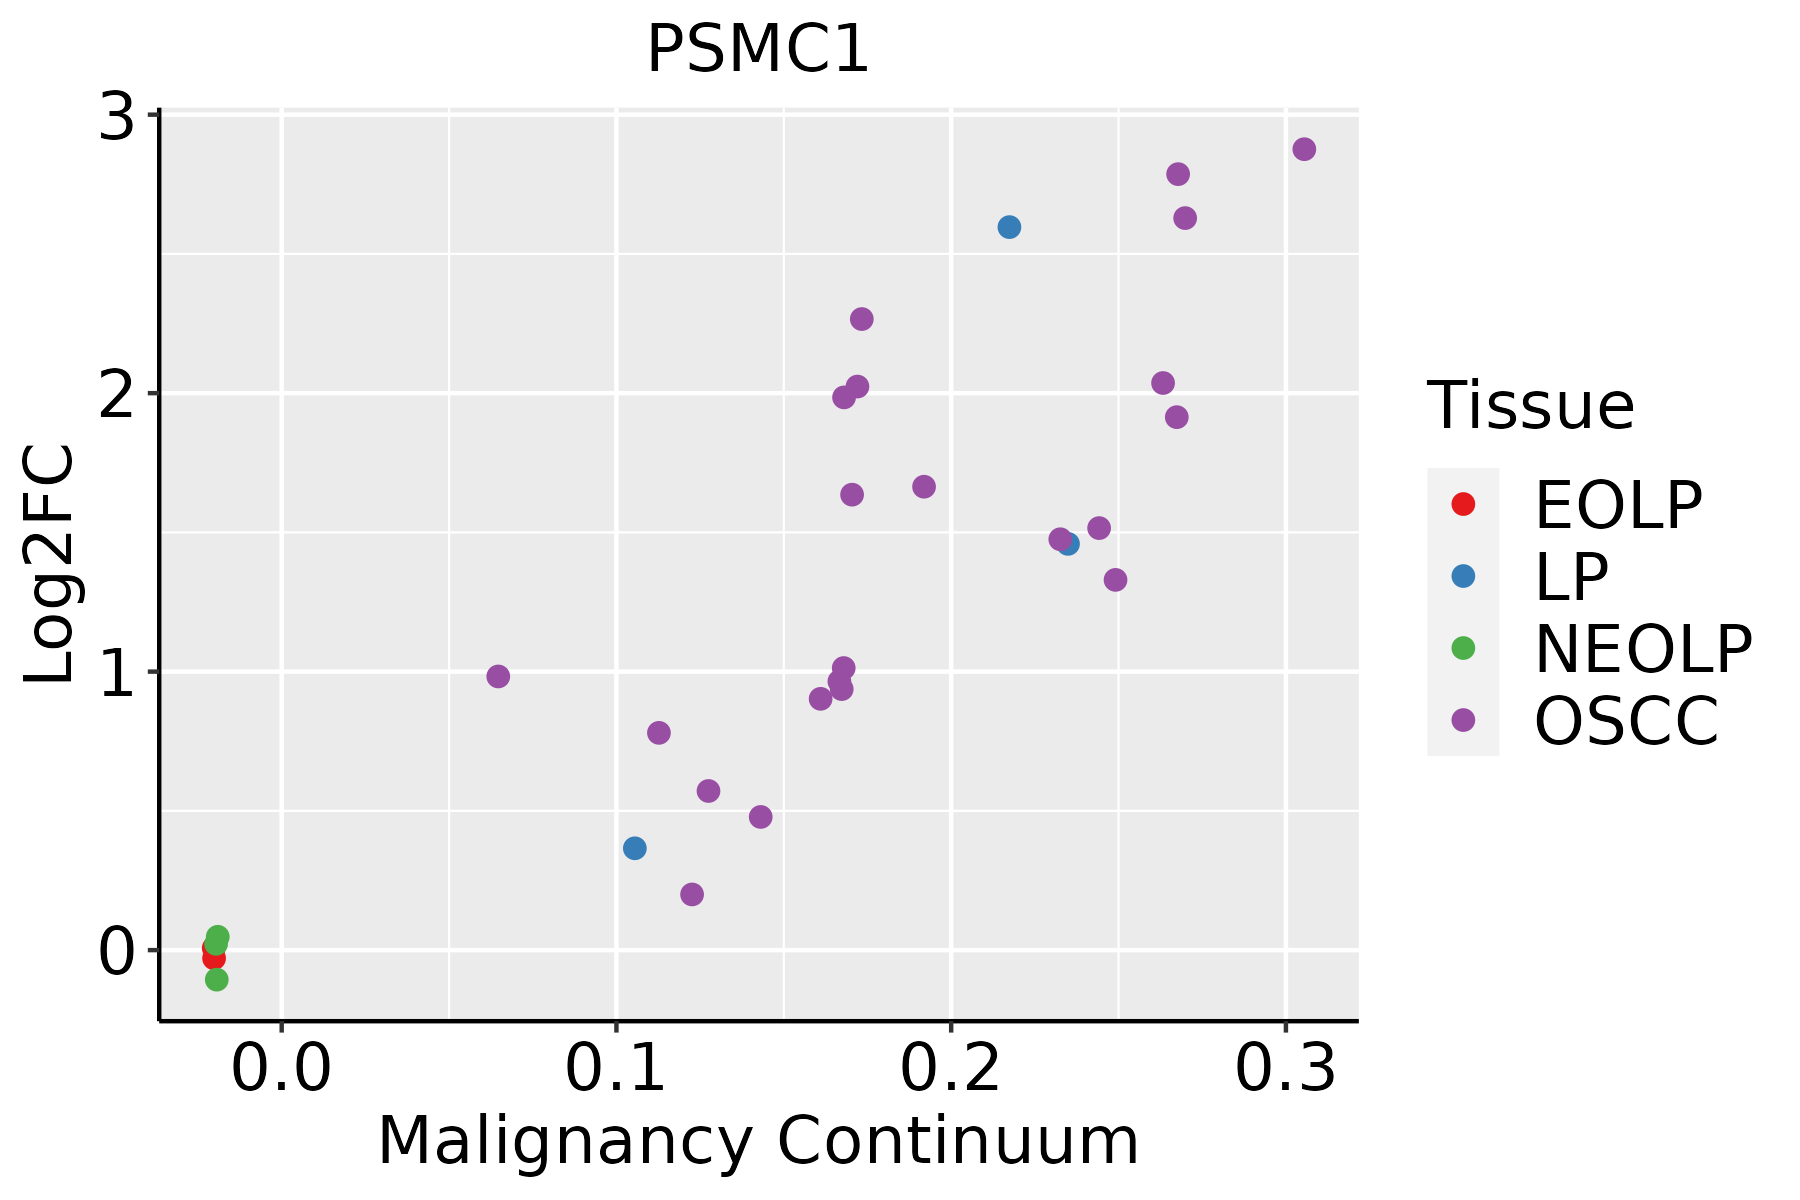 | EOLP: Erosive Oral lichen planus |
| LP: leukoplakia | ||
| NEOLP: Non-erosive oral lichen planus | ||
| OSCC: Oral squamous cell carcinoma | ||
| Prostate | 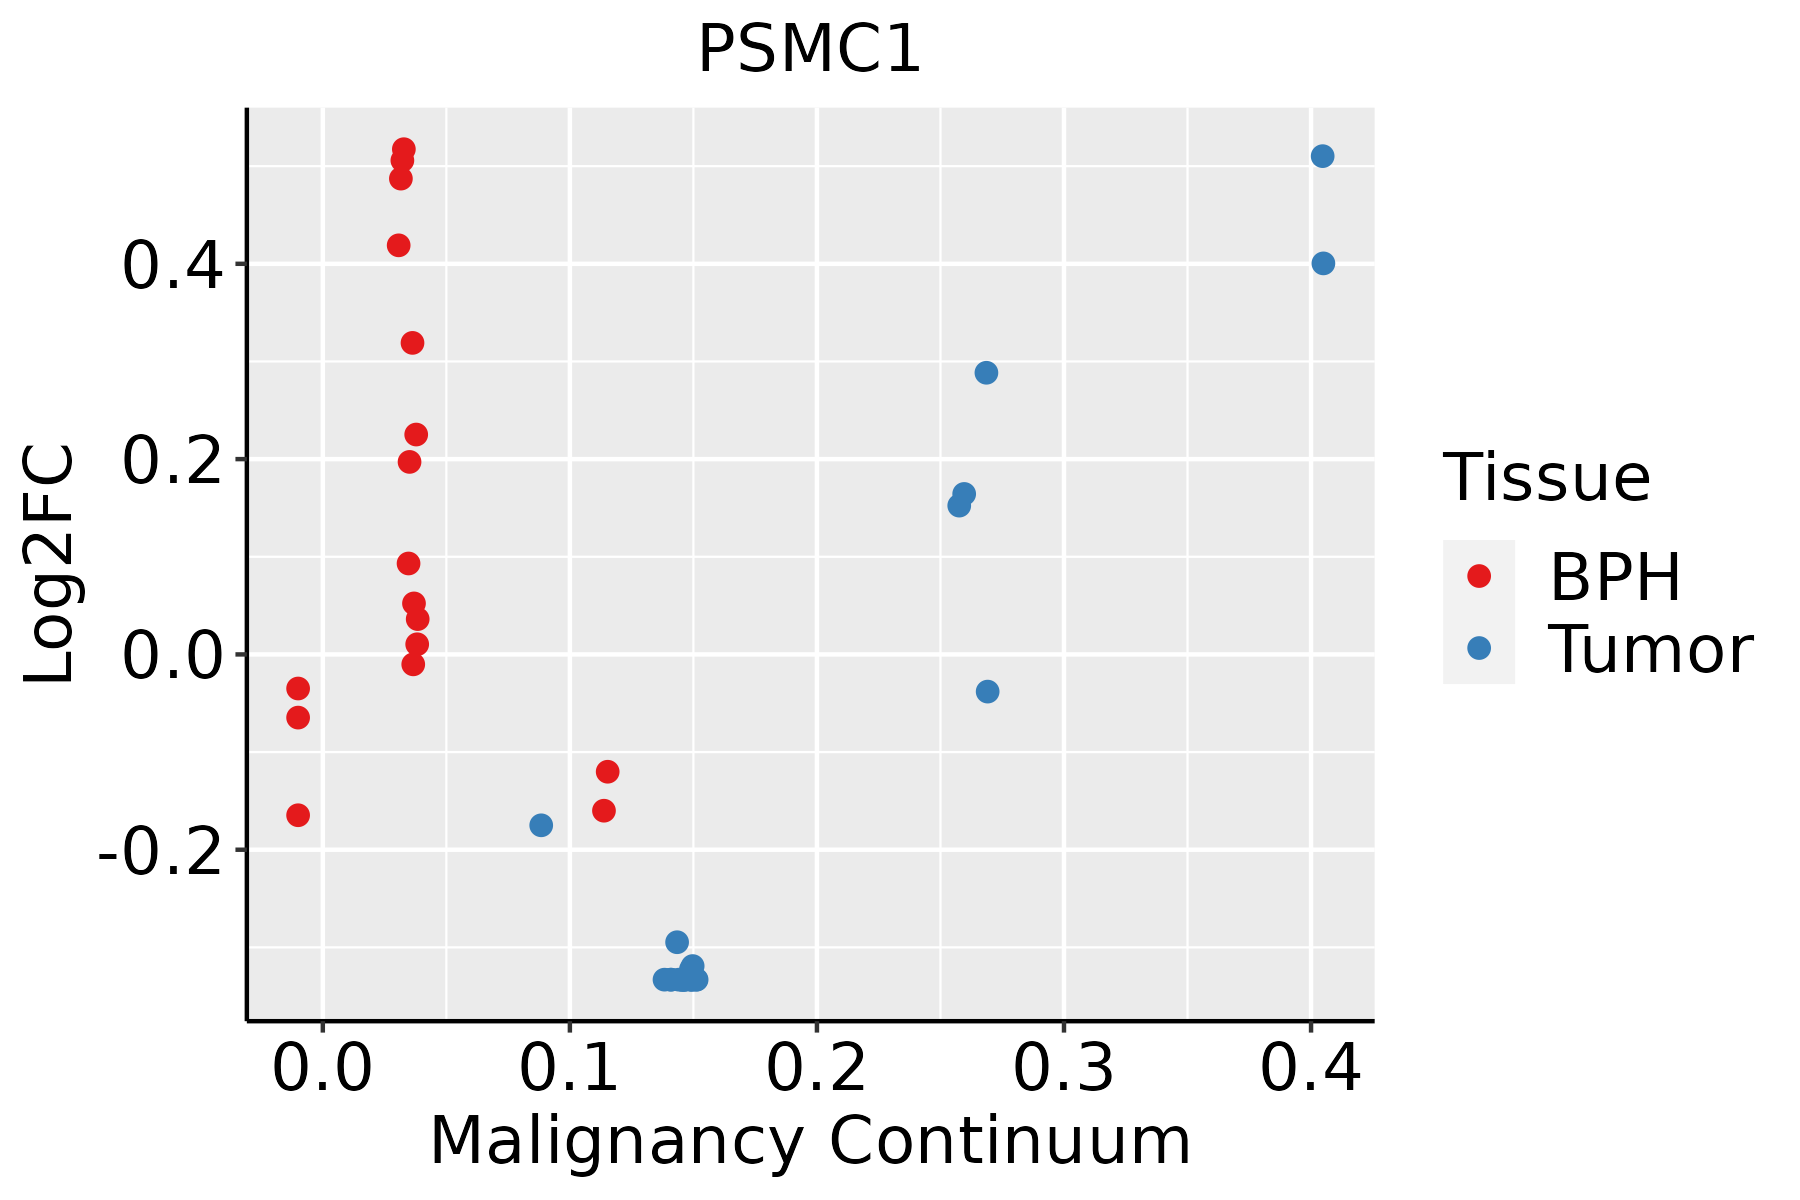 | BPH: Benign Prostatic Hyperplasia |
| Skin | 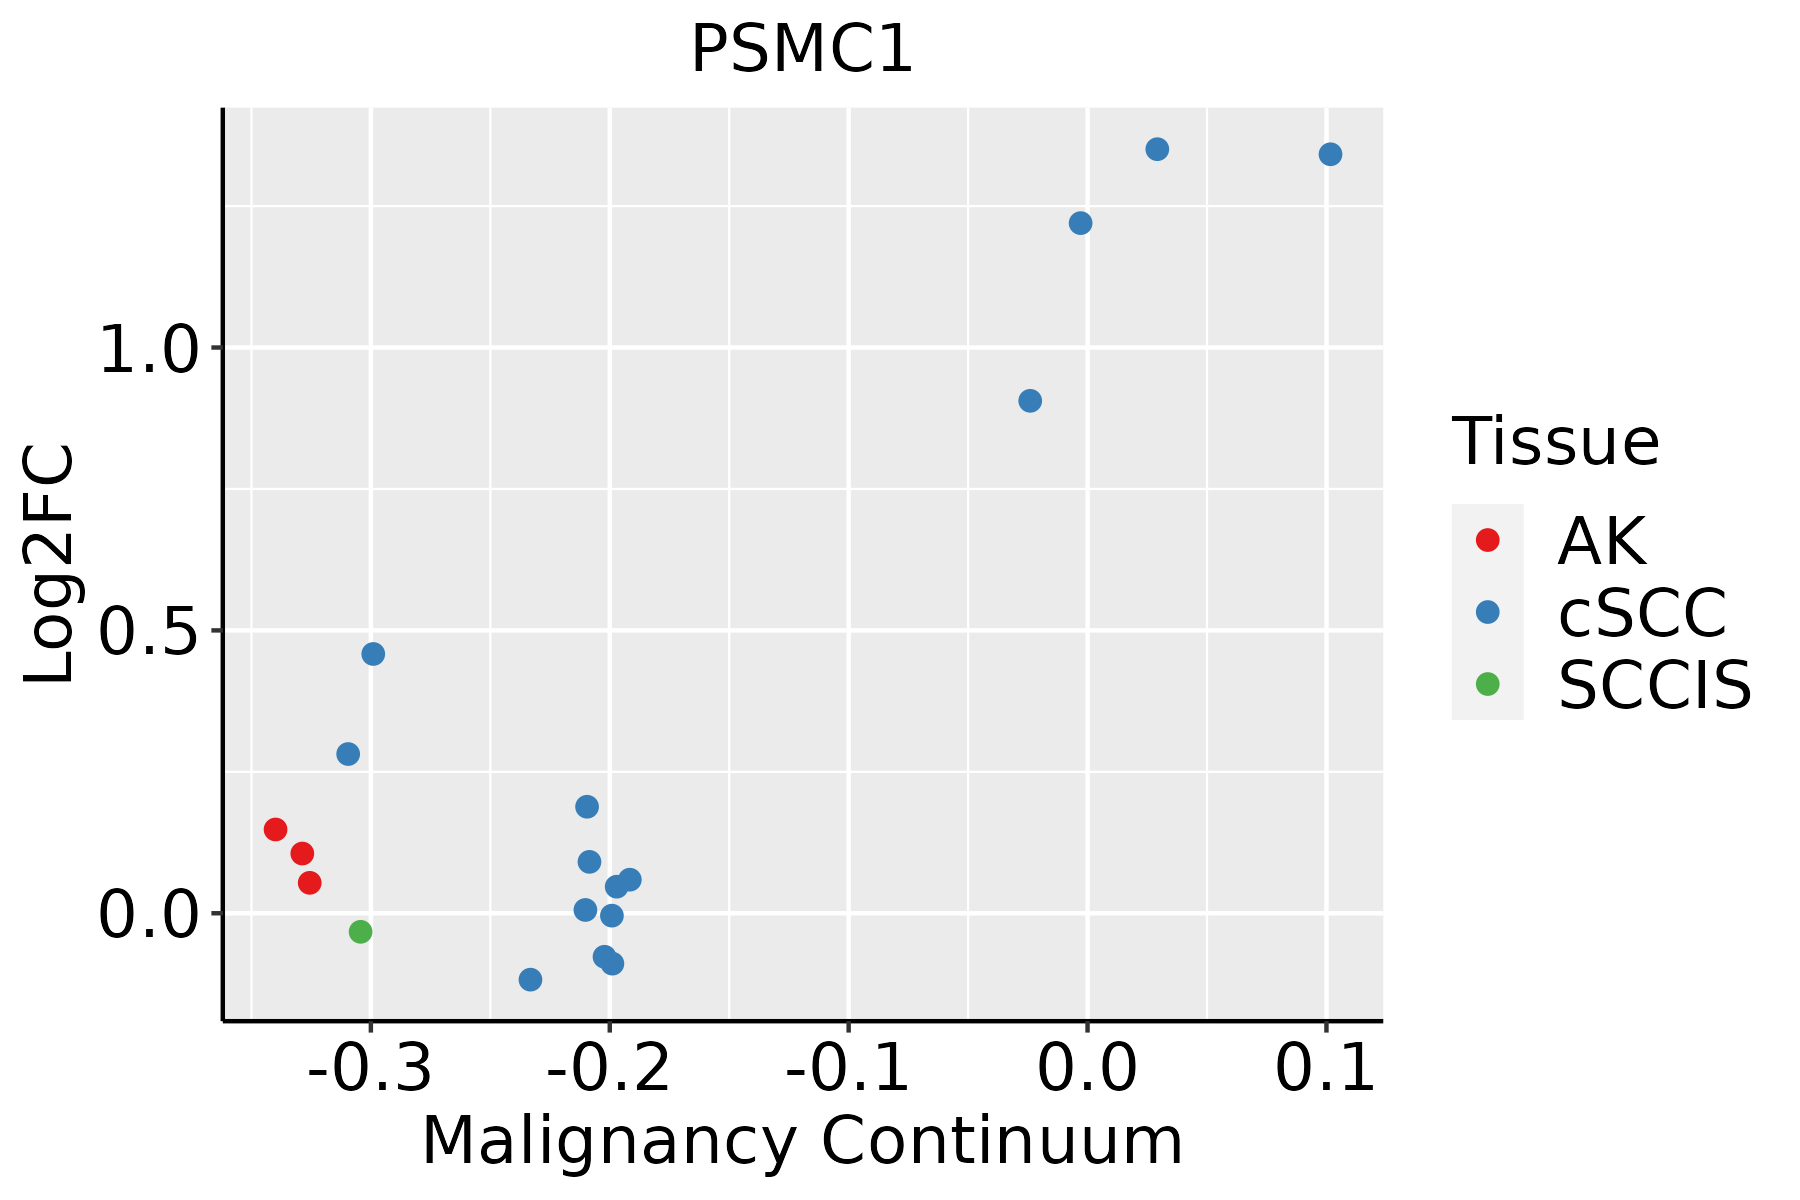 | AK: Actinic keratosis |
| cSCC: Cutaneous squamous cell carcinoma | ||
| SCCIS:squamous cell carcinoma in situ | ||
| Thyroid |  | ATC: Anaplastic thyroid cancer |
| HT: Hashimoto's thyroiditis | ||
| PTC: Papillary thyroid cancer |
| ∗log2FC in expression of this searched gene in stem-like cells from each diseased tissue sample relative to stem-like cells in normal samples in each tissue plotted against the malignancy continuum. Samples are colored based on if they are from different disease stage. |
Top |
Malignant transformation related pathway analysis |
| Find out the enriched GO biological processes and KEGG pathways involved in transition from healthy to precancer to cancer |
| Tissue | Disease Stage | Enriched GO biological Processes |
| Colorectum | AD |  |
| Colorectum | SER |  |
| Colorectum | MSS |  |
| Colorectum | MSI-H |  |
| Colorectum | FAP |  |
| ∗Top 15 enriched GO BP terms are showed in the bar plot of each disease state in each tissue. Each row represents a significant GO biological process which is colored according to the -log10(p.adjust). |
| Page: 1 2 3 4 5 6 7 8 9 |
| GO ID | Tissue | Disease Stage | Description | Gene Ratio | Bg Ratio | pvalue | p.adjust | Count |
| GO:0010498111 | Esophagus | ESCC | proteasomal protein catabolic process | 369/8552 | 490/18723 | 1.13e-41 | 1.80e-38 | 369 |
| GO:0043161111 | Esophagus | ESCC | proteasome-mediated ubiquitin-dependent protein catabolic process | 312/8552 | 412/18723 | 3.53e-36 | 4.48e-33 | 312 |
| GO:0042176111 | Esophagus | ESCC | regulation of protein catabolic process | 280/8552 | 391/18723 | 8.65e-26 | 2.39e-23 | 280 |
| GO:0009896111 | Esophagus | ESCC | positive regulation of catabolic process | 332/8552 | 492/18723 | 4.36e-23 | 9.22e-21 | 332 |
| GO:0031331111 | Esophagus | ESCC | positive regulation of cellular catabolic process | 292/8552 | 427/18723 | 8.67e-22 | 1.53e-19 | 292 |
| GO:1903362111 | Esophagus | ESCC | regulation of cellular protein catabolic process | 188/8552 | 255/18723 | 5.12e-20 | 6.62e-18 | 188 |
| GO:0045862111 | Esophagus | ESCC | positive regulation of proteolysis | 256/8552 | 372/18723 | 7.88e-20 | 9.43e-18 | 256 |
| GO:1903050111 | Esophagus | ESCC | regulation of proteolysis involved in cellular protein catabolic process | 163/8552 | 221/18723 | 1.44e-17 | 1.27e-15 | 163 |
| GO:0061136111 | Esophagus | ESCC | regulation of proteasomal protein catabolic process | 142/8552 | 187/18723 | 2.40e-17 | 2.00e-15 | 142 |
| GO:0045732111 | Esophagus | ESCC | positive regulation of protein catabolic process | 167/8552 | 231/18723 | 1.47e-16 | 1.14e-14 | 167 |
| GO:1903364111 | Esophagus | ESCC | positive regulation of cellular protein catabolic process | 117/8552 | 155/18723 | 3.25e-14 | 1.66e-12 | 117 |
| GO:1901800110 | Esophagus | ESCC | positive regulation of proteasomal protein catabolic process | 91/8552 | 114/18723 | 6.74e-14 | 3.34e-12 | 91 |
| GO:1903052110 | Esophagus | ESCC | positive regulation of proteolysis involved in cellular protein catabolic process | 101/8552 | 133/18723 | 9.58e-13 | 4.19e-11 | 101 |
| GO:0070997111 | Esophagus | ESCC | neuron death | 216/8552 | 361/18723 | 3.49e-08 | 6.45e-07 | 216 |
| GO:1901214111 | Esophagus | ESCC | regulation of neuron death | 186/8552 | 319/18723 | 3.35e-06 | 3.73e-05 | 186 |
| GO:190121516 | Esophagus | ESCC | negative regulation of neuron death | 115/8552 | 208/18723 | 3.24e-03 | 1.34e-02 | 115 |
| GO:001049812 | Liver | Cirrhotic | proteasomal protein catabolic process | 216/4634 | 490/18723 | 2.52e-21 | 9.29e-19 | 216 |
| GO:004217612 | Liver | Cirrhotic | regulation of protein catabolic process | 181/4634 | 391/18723 | 7.94e-21 | 2.77e-18 | 181 |
| GO:000989612 | Liver | Cirrhotic | positive regulation of catabolic process | 215/4634 | 492/18723 | 1.13e-20 | 3.56e-18 | 215 |
| GO:003133112 | Liver | Cirrhotic | positive regulation of cellular catabolic process | 190/4634 | 427/18723 | 1.94e-19 | 4.18e-17 | 190 |
| Page: 1 2 3 4 5 6 7 8 9 10 |
| Pathway ID | Tissue | Disease Stage | Description | Gene Ratio | Bg Ratio | pvalue | p.adjust | qvalue | Count |
| hsa05014210 | Esophagus | ESCC | Amyotrophic lateral sclerosis | 266/4205 | 364/8465 | 1.31e-20 | 2.20e-18 | 1.13e-18 | 266 |
| hsa05016210 | Esophagus | ESCC | Huntington disease | 226/4205 | 306/8465 | 1.38e-18 | 8.72e-17 | 4.46e-17 | 226 |
| hsa05012211 | Esophagus | ESCC | Parkinson disease | 201/4205 | 266/8465 | 1.56e-18 | 8.72e-17 | 4.46e-17 | 201 |
| hsa05022210 | Esophagus | ESCC | Pathways of neurodegeneration - multiple diseases | 318/4205 | 476/8465 | 6.10e-15 | 2.04e-13 | 1.05e-13 | 318 |
| hsa05010210 | Esophagus | ESCC | Alzheimer disease | 263/4205 | 384/8465 | 1.80e-14 | 5.47e-13 | 2.80e-13 | 263 |
| hsa05169210 | Esophagus | ESCC | Epstein-Barr virus infection | 151/4205 | 202/8465 | 1.55e-13 | 3.45e-12 | 1.77e-12 | 151 |
| hsa05020210 | Esophagus | ESCC | Prion disease | 193/4205 | 273/8465 | 6.42e-13 | 1.34e-11 | 6.89e-12 | 193 |
| hsa0305028 | Esophagus | ESCC | Proteasome | 44/4205 | 46/8465 | 1.05e-11 | 1.60e-10 | 8.21e-11 | 44 |
| hsa0516510 | Esophagus | ESCC | Human papillomavirus infection | 215/4205 | 331/8465 | 7.86e-09 | 7.12e-08 | 3.65e-08 | 215 |
| hsa0520325 | Esophagus | ESCC | Viral carcinogenesis | 137/4205 | 204/8465 | 2.47e-07 | 1.88e-06 | 9.62e-07 | 137 |
| hsa0501728 | Esophagus | ESCC | Spinocerebellar ataxia | 94/4205 | 143/8465 | 6.77e-05 | 2.90e-04 | 1.48e-04 | 94 |
| hsa0501438 | Esophagus | ESCC | Amyotrophic lateral sclerosis | 266/4205 | 364/8465 | 1.31e-20 | 2.20e-18 | 1.13e-18 | 266 |
| hsa0501638 | Esophagus | ESCC | Huntington disease | 226/4205 | 306/8465 | 1.38e-18 | 8.72e-17 | 4.46e-17 | 226 |
| hsa05012310 | Esophagus | ESCC | Parkinson disease | 201/4205 | 266/8465 | 1.56e-18 | 8.72e-17 | 4.46e-17 | 201 |
| hsa0502238 | Esophagus | ESCC | Pathways of neurodegeneration - multiple diseases | 318/4205 | 476/8465 | 6.10e-15 | 2.04e-13 | 1.05e-13 | 318 |
| hsa0501038 | Esophagus | ESCC | Alzheimer disease | 263/4205 | 384/8465 | 1.80e-14 | 5.47e-13 | 2.80e-13 | 263 |
| hsa0516937 | Esophagus | ESCC | Epstein-Barr virus infection | 151/4205 | 202/8465 | 1.55e-13 | 3.45e-12 | 1.77e-12 | 151 |
| hsa0502038 | Esophagus | ESCC | Prion disease | 193/4205 | 273/8465 | 6.42e-13 | 1.34e-11 | 6.89e-12 | 193 |
| hsa0305037 | Esophagus | ESCC | Proteasome | 44/4205 | 46/8465 | 1.05e-11 | 1.60e-10 | 8.21e-11 | 44 |
| hsa0516515 | Esophagus | ESCC | Human papillomavirus infection | 215/4205 | 331/8465 | 7.86e-09 | 7.12e-08 | 3.65e-08 | 215 |
| Page: 1 2 3 4 5 6 7 8 9 10 |
Top |
Cell-cell communication analysis |
| Identification of potential cell-cell interactions between two cell types and their ligand-receptor pairs for different disease states |
| Ligand | Receptor | LRpair | Pathway | Tissue | Disease Stage |
| Page: 1 |
Top |
Single-cell gene regulatory network inference analysis |
| Find out the significant the regulons (TFs) and the target genes of each regulon across cell types for different disease states |
| TF | Cell Type | Tissue | Disease Stage | Target Gene | RSS | Regulon Activity |
| ∗The dot plots of a searched regulon are shown for all cell subpopulations in each disease state of each tissue based on the regulon specific score inferred using pySCENIC and by calculating the average expression. |
| Page: 1 |
Top |
Somatic mutation of malignant transformation related genes |
| Annotation of somatic variants for genes involved in malignant transformation |
| Hugo Symbol | Variant Class | Variant Classification | dbSNP RS | HGVSc | HGVSp | HGVSp Short | SWISSPROT | BIOTYPE | SIFT | PolyPhen | Tumor Sample Barcode | Tissue | Histology | Sex | Age | Stage | Therapy Types | Drugs | Outcome |
| PSMC1 | SNV | Missense_Mutation | rs772023510 | c.1118N>T | p.Thr373Met | p.T373M | P62191 | protein_coding | tolerated(0.14) | benign(0.047) | TCGA-2W-A8YY-01 | Cervix | cervical & endocervical cancer | Female | <65 | I/II | Chemotherapy | cisplatin | CR |
| PSMC1 | SNV | Missense_Mutation | c.744N>C | p.Leu248Phe | p.L248F | P62191 | protein_coding | deleterious(0.02) | probably_damaging(1) | TCGA-Q1-A73O-01 | Cervix | cervical & endocervical cancer | Female | <65 | I/II | Chemotherapy | cisplatin | CR | |
| PSMC1 | SNV | Missense_Mutation | c.114N>C | p.Lys38Asn | p.K38N | P62191 | protein_coding | tolerated(0.05) | benign(0.403) | TCGA-R2-A69V-01 | Cervix | cervical & endocervical cancer | Female | <65 | I/II | Chemotherapy | cisplatin | SD | |
| PSMC1 | SNV | Missense_Mutation | rs772023510 | c.1118N>T | p.Thr373Met | p.T373M | P62191 | protein_coding | tolerated(0.14) | benign(0.047) | TCGA-VS-A954-01 | Cervix | cervical & endocervical cancer | Female | >=65 | III/IV | Chemotherapy | cisplatin | CR |
| PSMC1 | SNV | Missense_Mutation | novel | c.40G>C | p.Gly14Arg | p.G14R | P62191 | protein_coding | tolerated_low_confidence(0.29) | probably_damaging(0.953) | TCGA-AA-3866-01 | Colorectum | colon adenocarcinoma | Female | >=65 | I/II | Unknown | Unknown | SD |
| PSMC1 | SNV | Missense_Mutation | c.788N>T | p.Gly263Val | p.G263V | P62191 | protein_coding | deleterious(0) | probably_damaging(1) | TCGA-AY-6197-01 | Colorectum | colon adenocarcinoma | Male | <65 | I/II | Unknown | Unknown | SD | |
| PSMC1 | SNV | Missense_Mutation | novel | c.100G>T | p.Gly34Trp | p.G34W | P62191 | protein_coding | deleterious(0) | probably_damaging(0.965) | TCGA-CA-6717-01 | Colorectum | colon adenocarcinoma | Male | <65 | I/II | Chemotherapy | oxaliplatin | CR |
| PSMC1 | SNV | Missense_Mutation | novel | c.655C>T | p.Pro219Ser | p.P219S | P62191 | protein_coding | deleterious(0) | probably_damaging(0.924) | TCGA-CA-6717-01 | Colorectum | colon adenocarcinoma | Male | <65 | I/II | Chemotherapy | oxaliplatin | CR |
| PSMC1 | SNV | Missense_Mutation | c.829N>T | p.His277Tyr | p.H277Y | P62191 | protein_coding | tolerated(0.25) | benign(0.007) | TCGA-DY-A1DC-01 | Colorectum | rectum adenocarcinoma | Female | >=65 | I/II | Chemotherapy | capecitabine | PR | |
| PSMC1 | SNV | Missense_Mutation | c.643G>A | p.Gly215Ser | p.G215S | P62191 | protein_coding | deleterious(0) | probably_damaging(0.999) | TCGA-EF-5830-01 | Colorectum | rectum adenocarcinoma | Male | <65 | I/II | Unknown | Unknown | SD |
| Page: 1 2 3 4 |
Top |
Related drugs of malignant transformation related genes |
| Identification of chemicals and drugs interact with genes involved in malignant transfromation |
| (DGIdb 4.0) |
| Entrez ID | Symbol | Category | Interaction Types | Drug Claim Name | Drug Name | PMIDs |
| 5700 | PSMC1 | PROTEASE | inhibitor | CHEMBL3545432 | IXAZOMIB CITRATE | |
| 5700 | PSMC1 | PROTEASE | inhibitor | CHEMBL451887 | CARFILZOMIB | |
| 5700 | PSMC1 | PROTEASE | BORTEZOMIB | BORTEZOMIB | 24524217 | |
| 5700 | PSMC1 | PROTEASE | inhibitor | CHEMBL2103884 | OPROZOMIB | |
| 5700 | PSMC1 | PROTEASE | inhibitor | CHEMBL325041 | BORTEZOMIB | |
| 5700 | PSMC1 | PROTEASE | inhibitor | BORTEZOMIB | BORTEZOMIB | |
| 5700 | PSMC1 | PROTEASE | CARFILZOMIB | CARFILZOMIB | 24524217 | |
| 5700 | PSMC1 | PROTEASE | inhibitor | CARFILZOMIB | CARFILZOMIB |
| Page: 1 |

Copyright 2023-Present -The University of Texas Health Science Center at Houston |