
|
|||||
|
 | |
| |
| |
| |
| |
| |
|
Gene: PSMB9 |
Gene summary for PSMB9 |
| Gene information | Species | Human | Gene symbol | PSMB9 | Gene ID | 5698 |
| Gene name | proteasome 20S subunit beta 9 | |
| Gene Alias | LMP2 | |
| Cytomap | 6p21.32 | |
| Gene Type | protein-coding | GO ID | GO:0002376 | UniProtAcc | A0A1U9X8D7 |
Top |
Malignant transformation analysis |
| Identification of the aberrant gene expression in precancerous and cancerous lesions by comparing the gene expression of stem-like cells in diseased tissues with normal stem cells |
| Entrez ID | Symbol | Replicates | Species | Organ | Tissue | Adj P-value | Log2FC | Malignancy |
| 5698 | PSMB9 | GSM4909281 | Human | Breast | IDC | 1.55e-09 | 4.61e-01 | 0.21 |
| 5698 | PSMB9 | GSM4909285 | Human | Breast | IDC | 6.45e-03 | -1.78e-01 | 0.21 |
| 5698 | PSMB9 | GSM4909286 | Human | Breast | IDC | 3.30e-12 | -2.36e-01 | 0.1081 |
| 5698 | PSMB9 | GSM4909287 | Human | Breast | IDC | 7.62e-08 | 4.81e-01 | 0.2057 |
| 5698 | PSMB9 | GSM4909297 | Human | Breast | IDC | 1.80e-05 | -1.35e-01 | 0.1517 |
| 5698 | PSMB9 | GSM4909311 | Human | Breast | IDC | 1.46e-09 | -2.07e-01 | 0.1534 |
| 5698 | PSMB9 | GSM4909312 | Human | Breast | IDC | 1.90e-08 | -1.95e-01 | 0.1552 |
| 5698 | PSMB9 | GSM4909319 | Human | Breast | IDC | 1.65e-15 | -3.85e-02 | 0.1563 |
| 5698 | PSMB9 | GSM4909321 | Human | Breast | IDC | 3.40e-05 | 4.70e-02 | 0.1559 |
| 5698 | PSMB9 | M1 | Human | Breast | IDC | 1.09e-02 | 3.24e-01 | 0.1577 |
| 5698 | PSMB9 | M2 | Human | Breast | IDC | 7.36e-03 | 5.35e-01 | 0.21 |
| 5698 | PSMB9 | NCCBC14 | Human | Breast | DCIS | 2.71e-04 | -1.57e-01 | 0.2021 |
| 5698 | PSMB9 | NCCBC5 | Human | Breast | DCIS | 1.66e-11 | 5.09e-01 | 0.2046 |
| 5698 | PSMB9 | P2 | Human | Breast | IDC | 2.06e-23 | 8.64e-01 | 0.21 |
| 5698 | PSMB9 | DCIS2 | Human | Breast | DCIS | 1.69e-17 | -5.90e-02 | 0.0085 |
| 5698 | PSMB9 | CA_HPV_1 | Human | Cervix | CC | 1.67e-11 | 5.37e-01 | 0.0264 |
| 5698 | PSMB9 | CA_HPV_2 | Human | Cervix | CC | 1.58e-02 | 3.17e-01 | 0.0391 |
| 5698 | PSMB9 | CA_HPV_3 | Human | Cervix | CC | 1.83e-07 | 3.16e-01 | 0.0414 |
| 5698 | PSMB9 | N_HPV_2 | Human | Cervix | N_HPV | 1.21e-06 | 3.32e-01 | -0.0131 |
| 5698 | PSMB9 | CCII_1 | Human | Cervix | CC | 2.62e-09 | -4.47e-01 | 0.3249 |
| Page: 1 2 3 4 5 6 7 8 9 10 |
| Tissue | Expression Dynamics | Abbreviation |
| Breast | 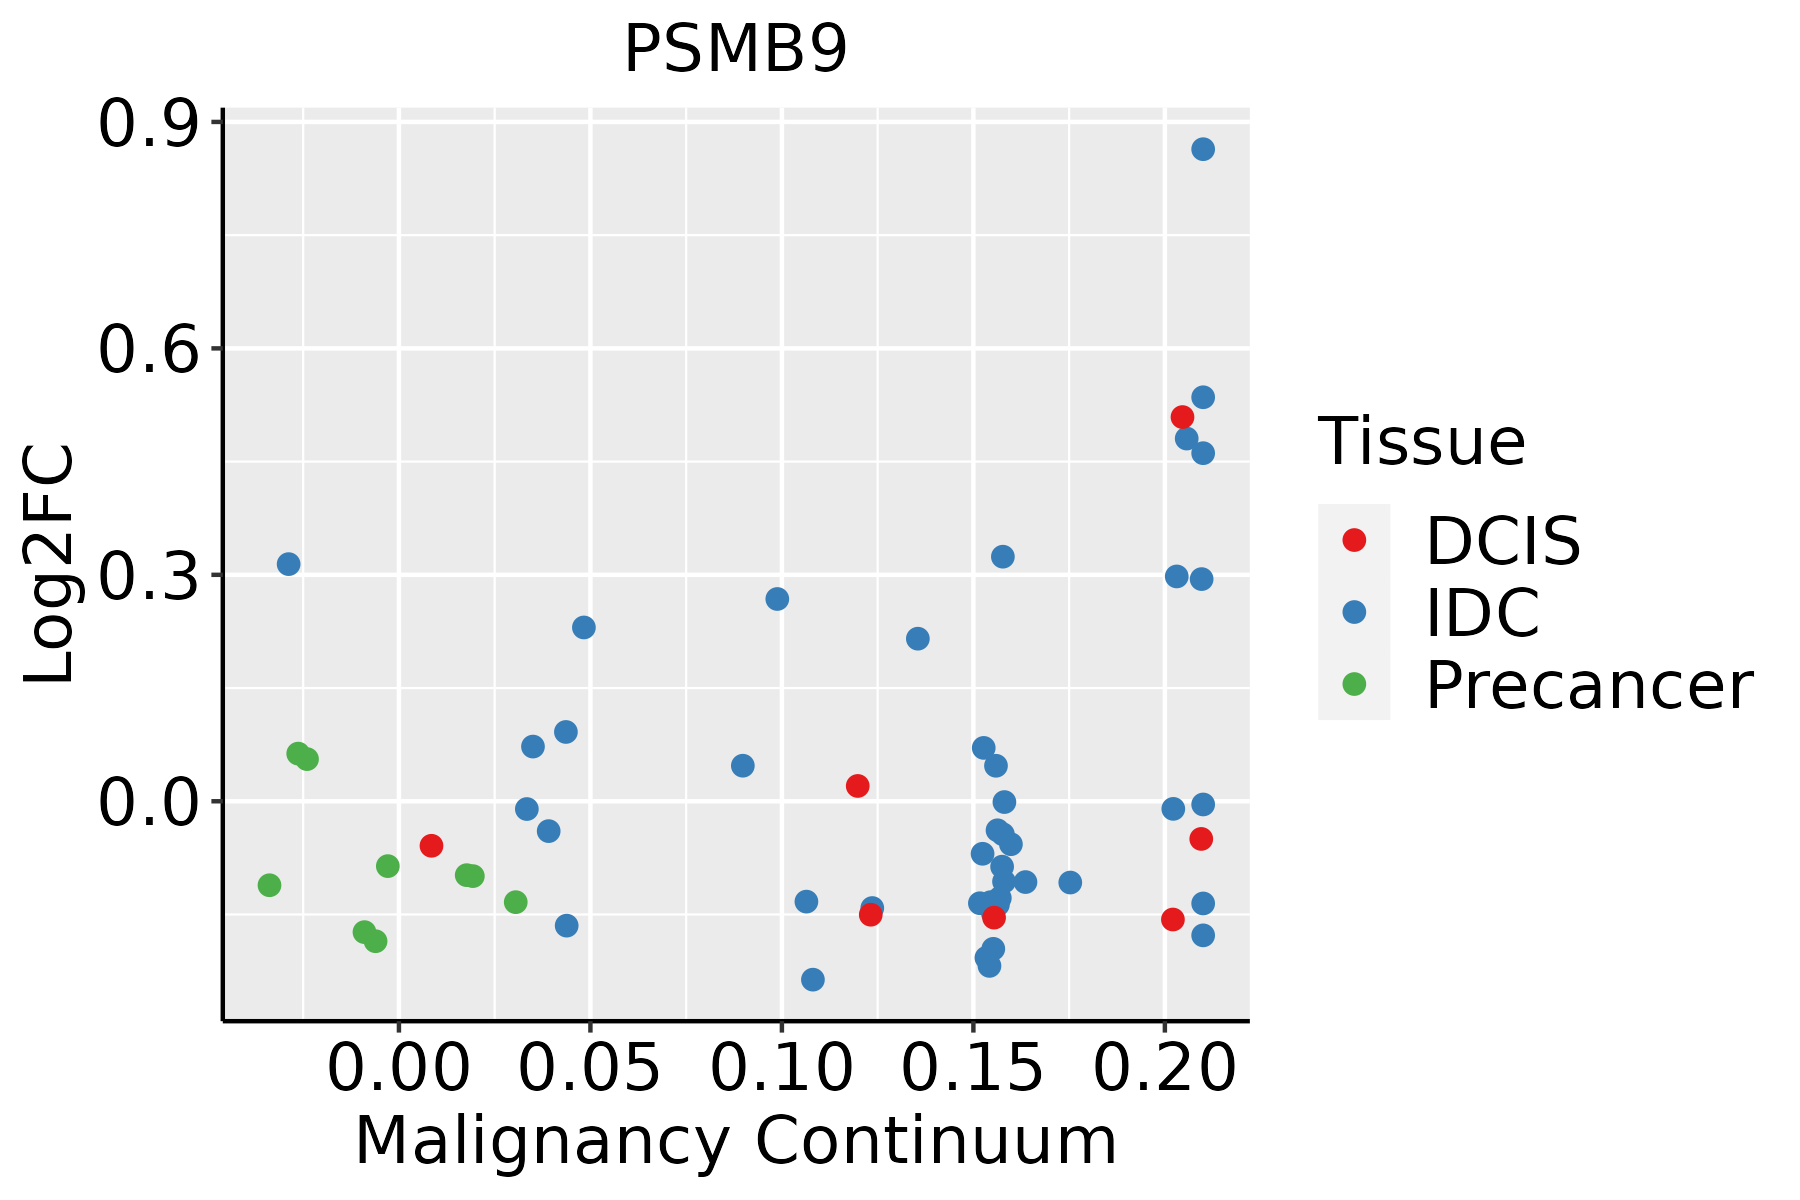 | IDC: Invasive ductal carcinoma |
| DCIS: Ductal carcinoma in situ | ||
| Precancer(BRCA1-mut): Precancerous lesion from BRCA1 mutation carriers | ||
| Cervix | 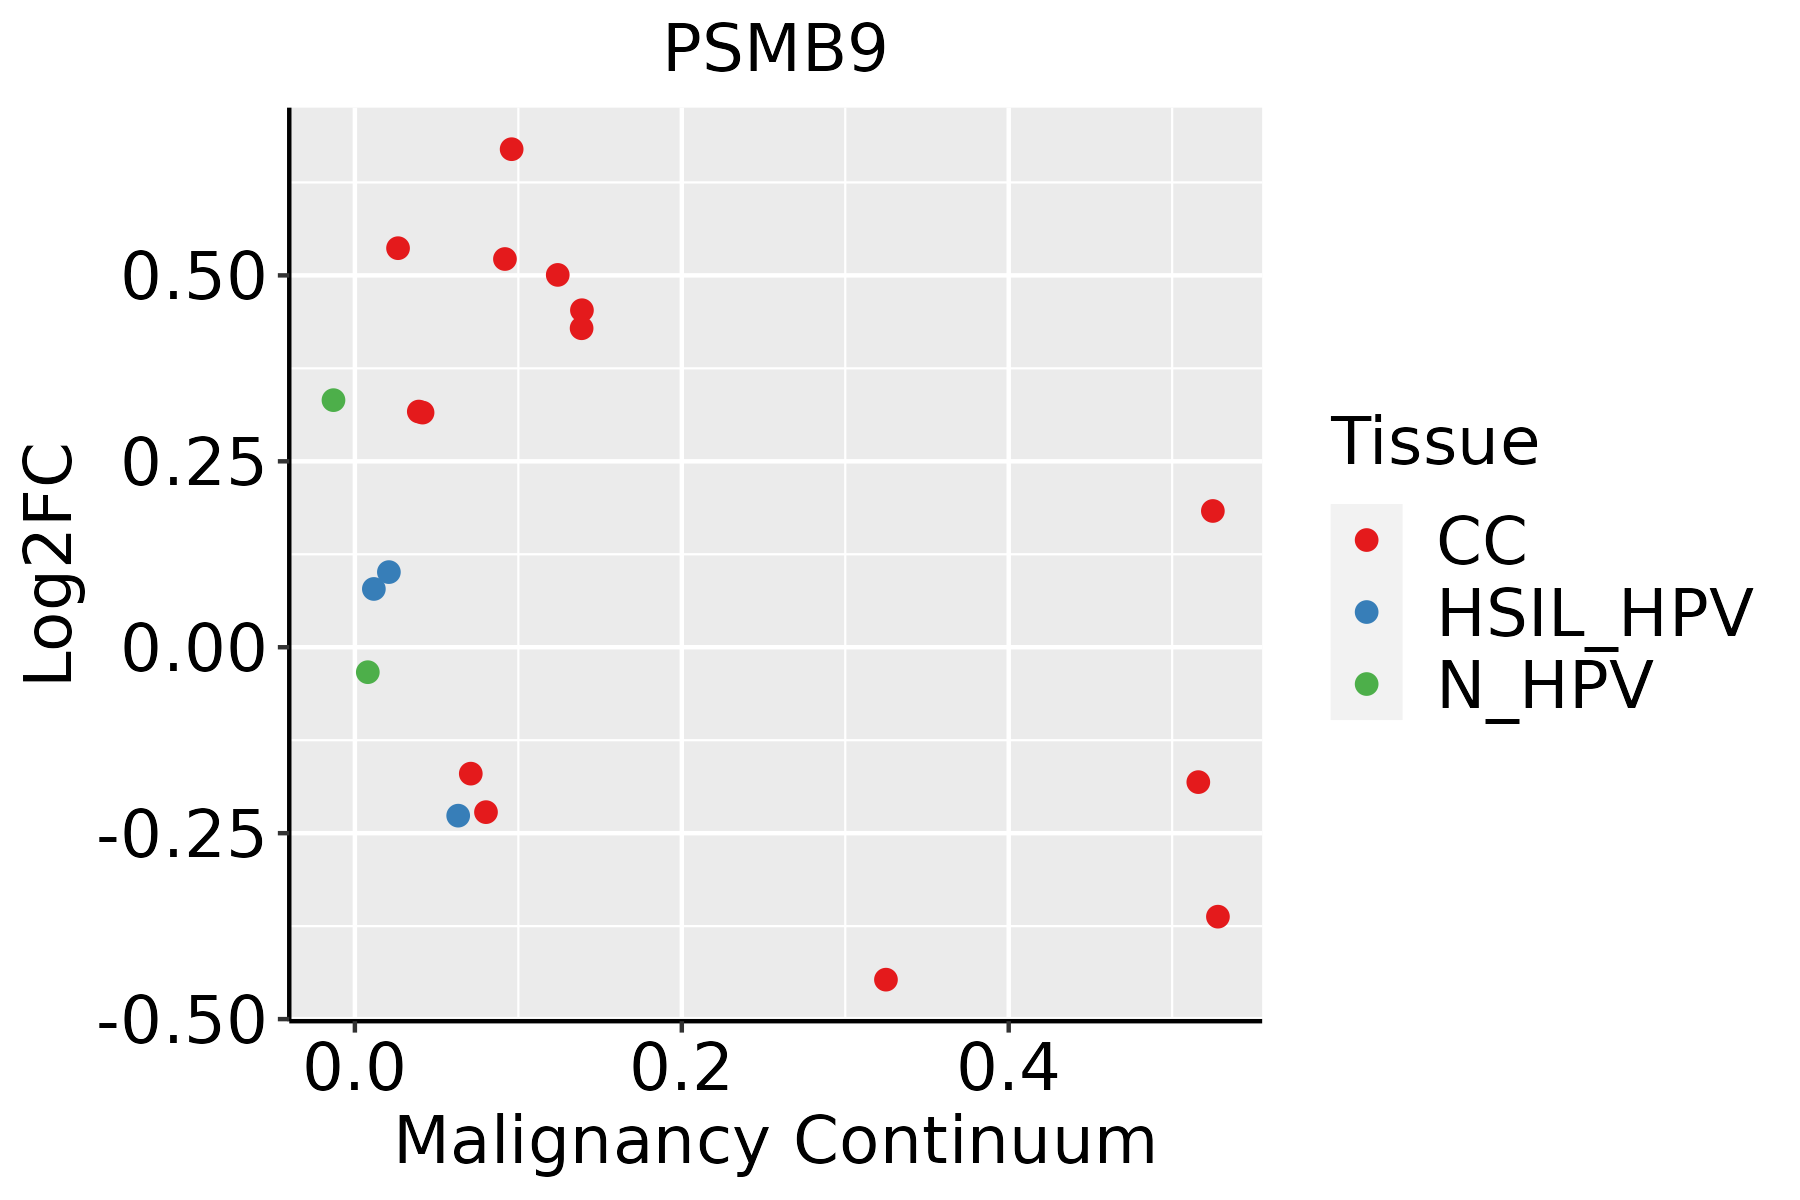 | CC: Cervix cancer |
| HSIL_HPV: HPV-infected high-grade squamous intraepithelial lesions | ||
| N_HPV: HPV-infected normal cervix | ||
| Colorectum (GSE201348) | 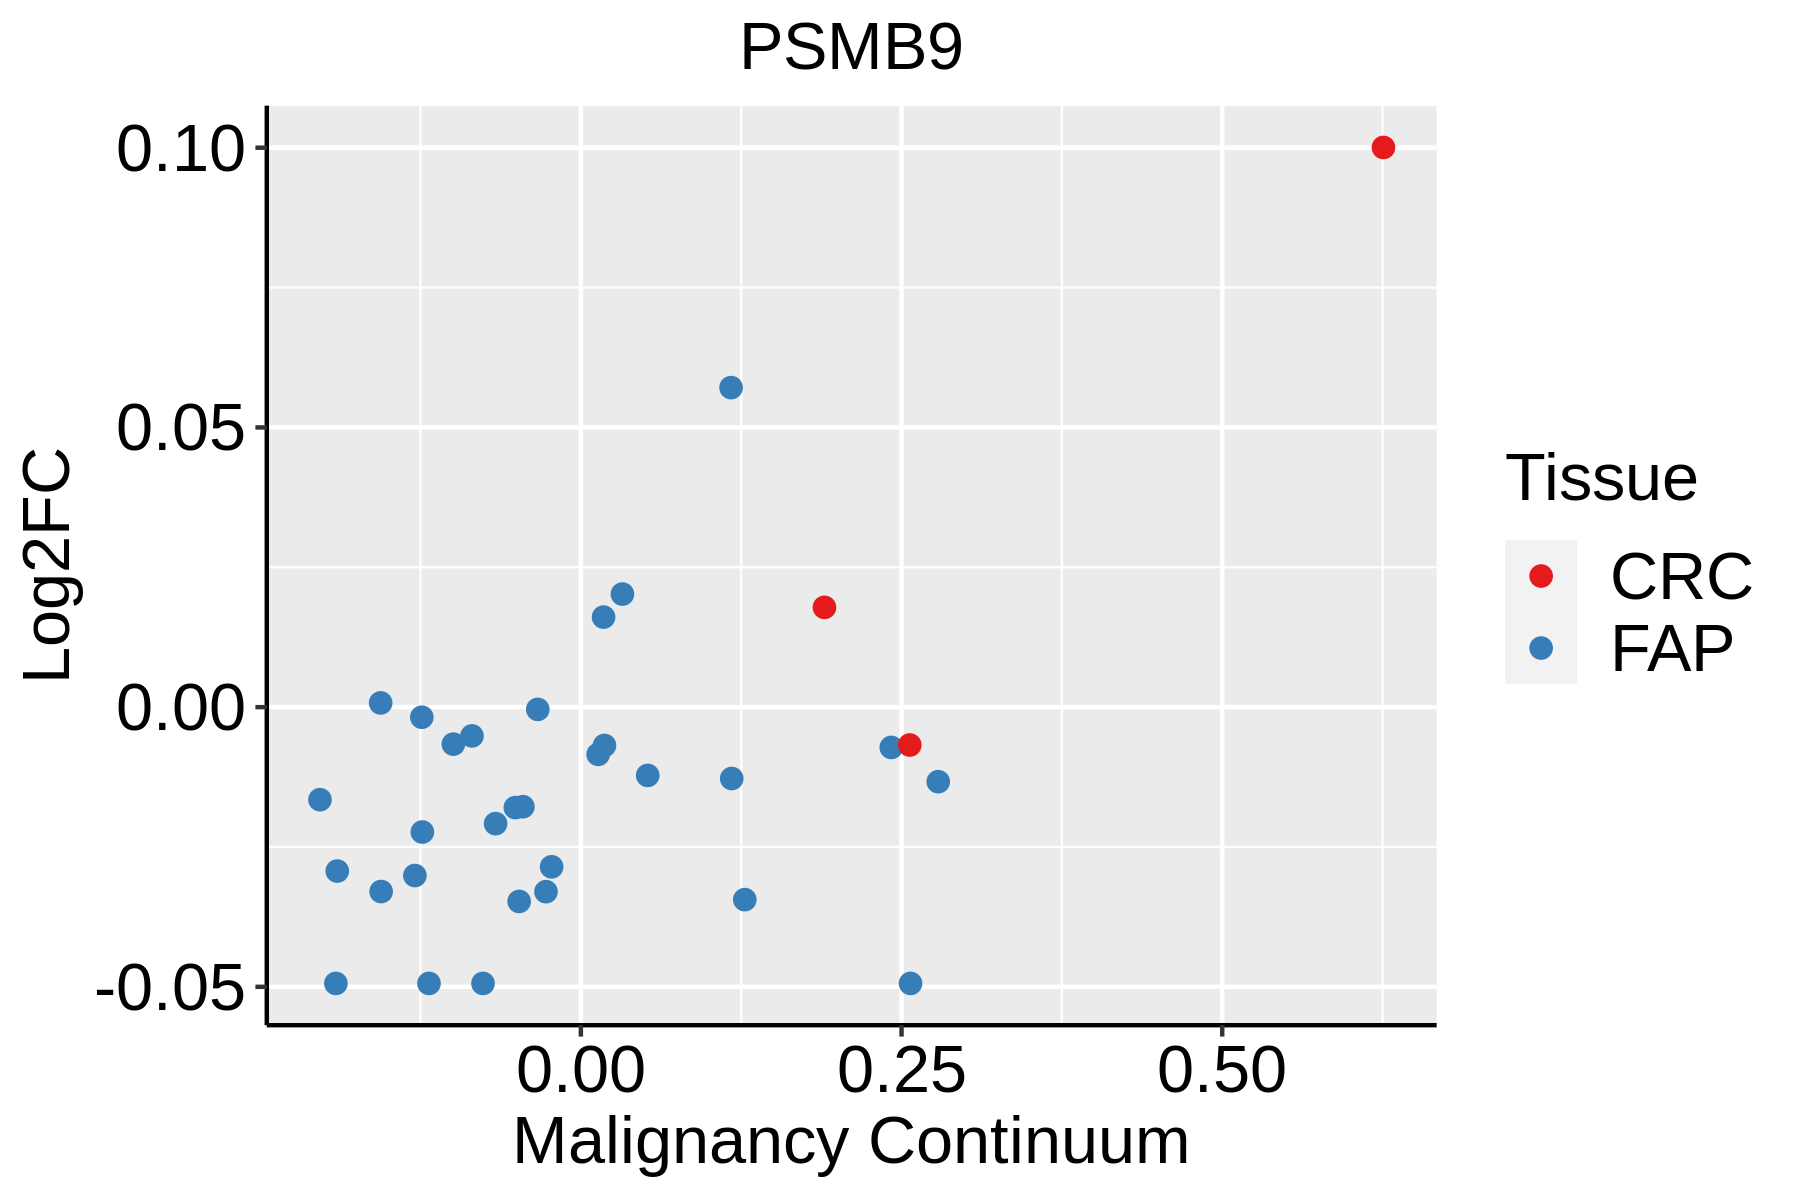 | FAP: Familial adenomatous polyposis |
| CRC: Colorectal cancer | ||
| Colorectum (HTA11) |  | AD: Adenomas |
| SER: Sessile serrated lesions | ||
| MSI-H: Microsatellite-high colorectal cancer | ||
| MSS: Microsatellite stable colorectal cancer | ||
| Esophagus | 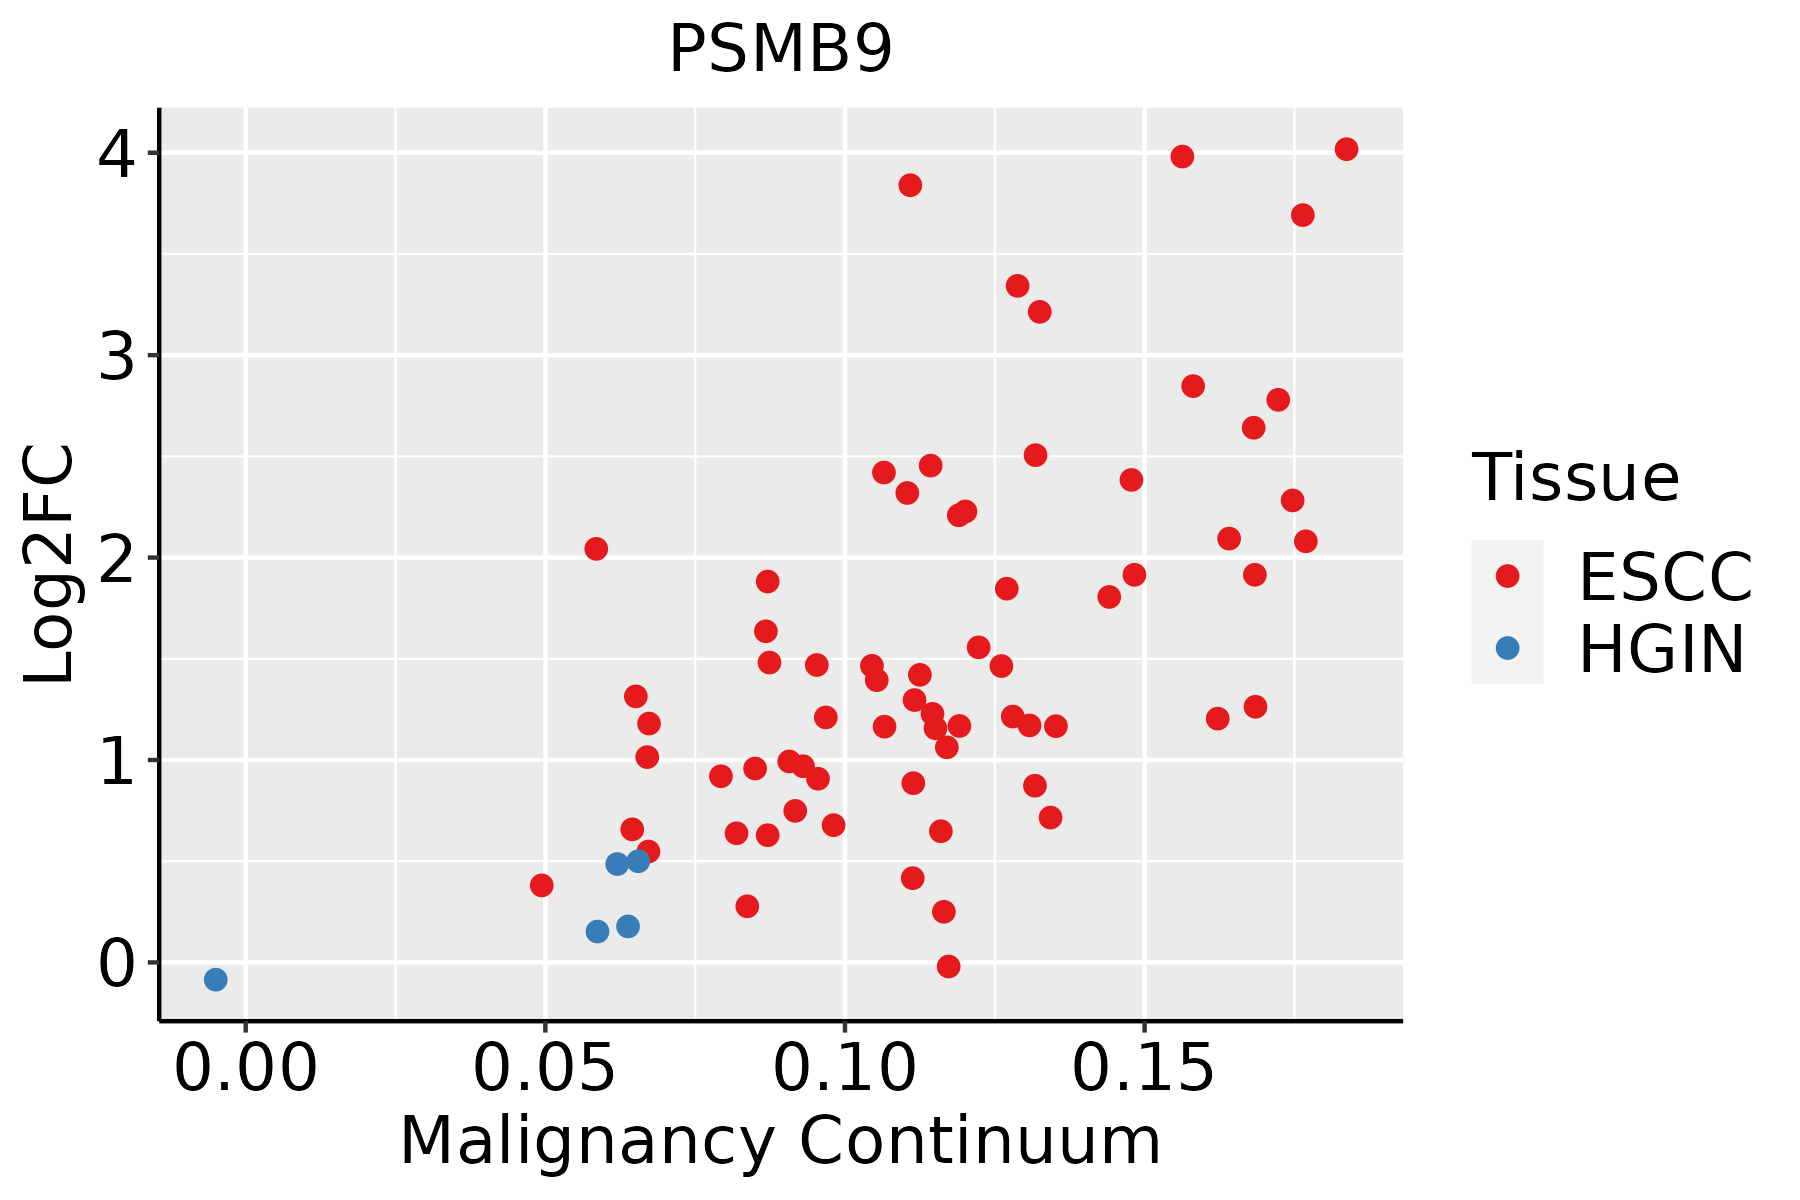 | ESCC: Esophageal squamous cell carcinoma |
| HGIN: High-grade intraepithelial neoplasias | ||
| LGIN: Low-grade intraepithelial neoplasias | ||
| GC | 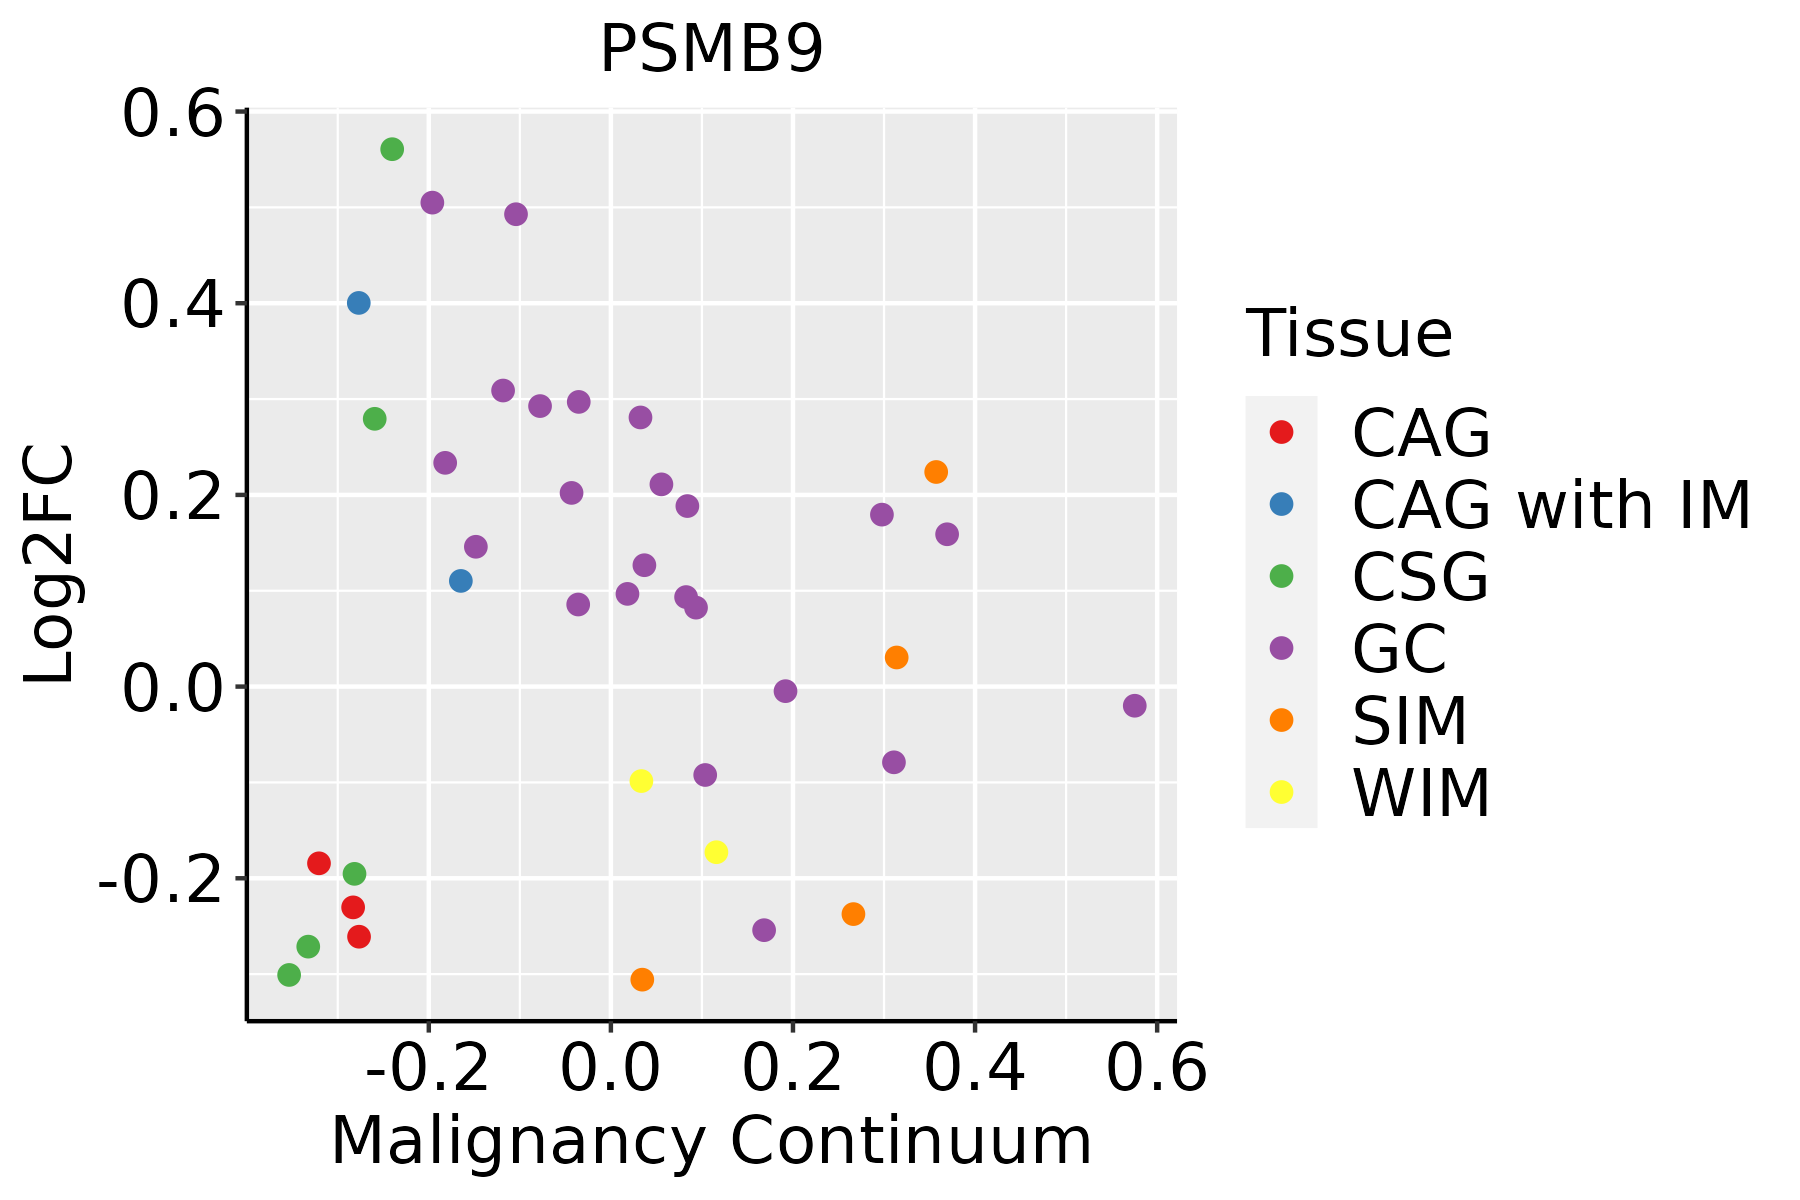 | CAG: Chronic atrophic gastritis |
| CAG with IM: Chronic atrophic gastritis with intestinal metaplasia | ||
| CSG: Chronic superficial gastritis | ||
| GC: Gastric cancer | ||
| SIM: Severe intestinal metaplasia | ||
| WIM: Wild intestinal metaplasia | ||
| Liver | 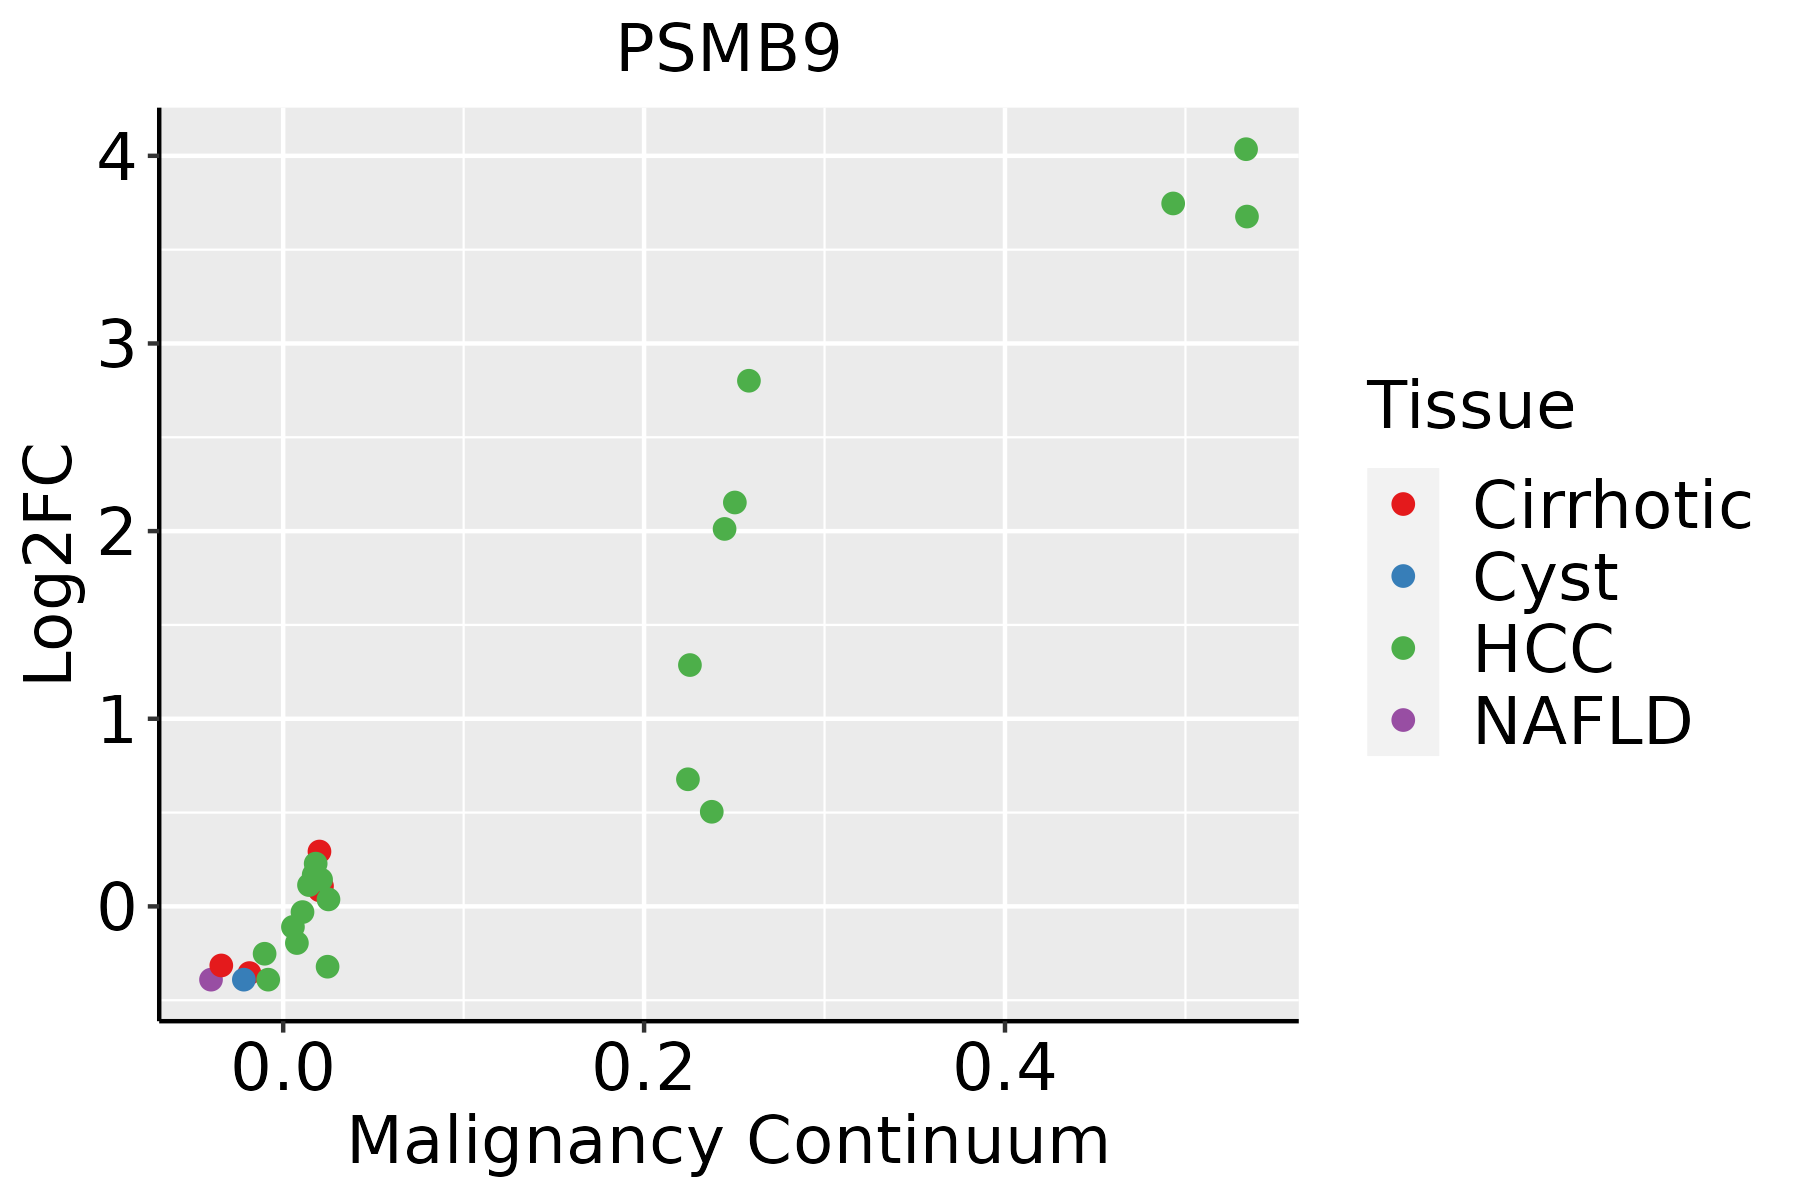 | HCC: Hepatocellular carcinoma |
| NAFLD: Non-alcoholic fatty liver disease | ||
| Oral Cavity | 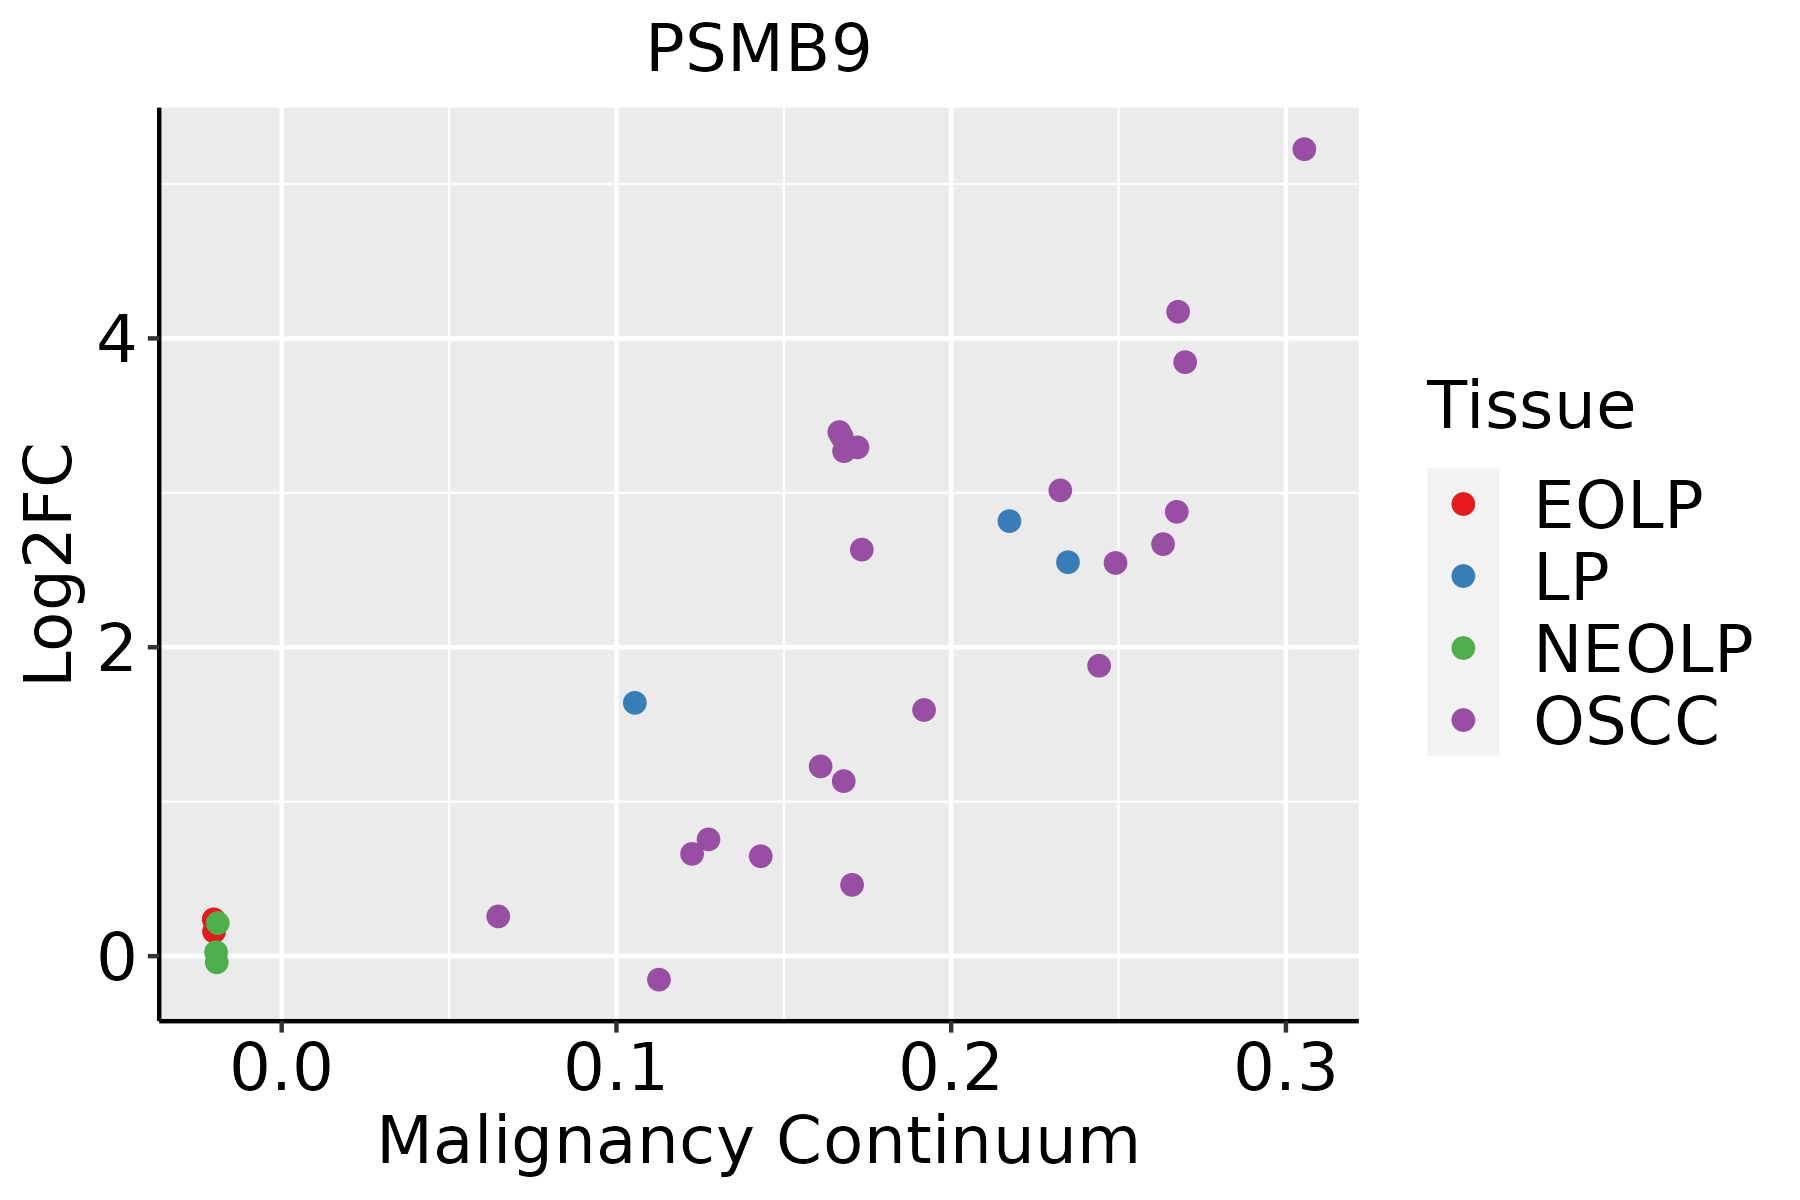 | EOLP: Erosive Oral lichen planus |
| LP: leukoplakia | ||
| NEOLP: Non-erosive oral lichen planus | ||
| OSCC: Oral squamous cell carcinoma | ||
| Skin |  | AK: Actinic keratosis |
| cSCC: Cutaneous squamous cell carcinoma | ||
| SCCIS:squamous cell carcinoma in situ | ||
| Thyroid | 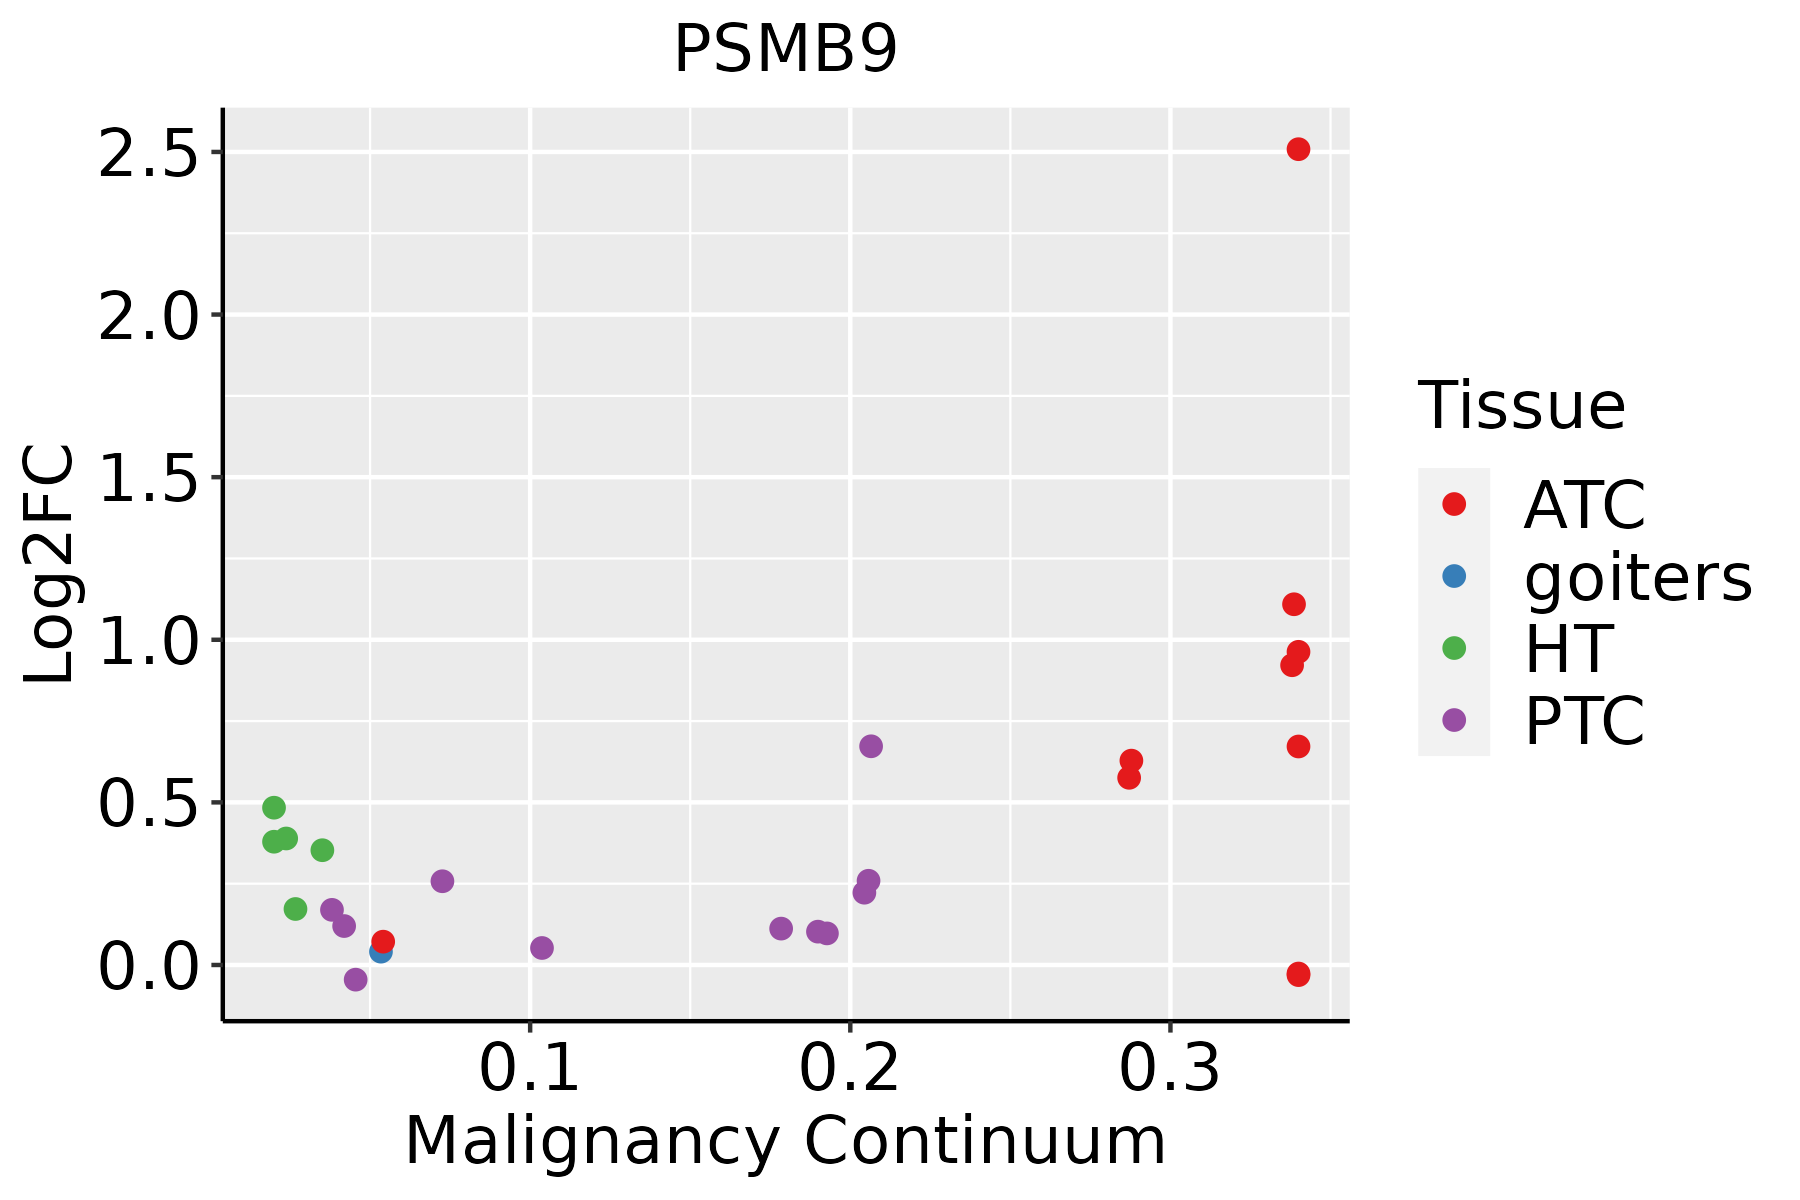 | ATC: Anaplastic thyroid cancer |
| HT: Hashimoto's thyroiditis | ||
| PTC: Papillary thyroid cancer |
| ∗log2FC in expression of this searched gene in stem-like cells from each diseased tissue sample relative to stem-like cells in normal samples in each tissue plotted against the malignancy continuum. Samples are colored based on if they are from different disease stage. |
Top |
Malignant transformation related pathway analysis |
| Find out the enriched GO biological processes and KEGG pathways involved in transition from healthy to precancer to cancer |
| Tissue | Disease Stage | Enriched GO biological Processes |
| Colorectum | AD |  |
| Colorectum | SER |  |
| Colorectum | MSS |  |
| Colorectum | MSI-H |  |
| Colorectum | FAP |  |
| ∗Top 15 enriched GO BP terms are showed in the bar plot of each disease state in each tissue. Each row represents a significant GO biological process which is colored according to the -log10(p.adjust). |
| Page: 1 2 3 4 5 6 7 8 9 |
| GO ID | Tissue | Disease Stage | Description | Gene Ratio | Bg Ratio | pvalue | p.adjust | Count |
| GO:005254714 | Breast | IDC | regulation of peptidase activity | 96/1434 | 461/18723 | 7.58e-20 | 6.15e-17 | 96 |
| GO:005254814 | Breast | IDC | regulation of endopeptidase activity | 88/1434 | 432/18723 | 1.20e-17 | 4.85e-15 | 88 |
| GO:200011614 | Breast | IDC | regulation of cysteine-type endopeptidase activity | 55/1434 | 235/18723 | 4.25e-14 | 1.21e-11 | 55 |
| GO:001049814 | Breast | IDC | proteasomal protein catabolic process | 75/1434 | 490/18723 | 5.59e-09 | 4.41e-07 | 75 |
| GO:005254723 | Breast | DCIS | regulation of peptidase activity | 88/1390 | 461/18723 | 1.18e-16 | 4.78e-14 | 88 |
| GO:005254823 | Breast | DCIS | regulation of endopeptidase activity | 83/1390 | 432/18723 | 6.07e-16 | 2.15e-13 | 83 |
| GO:200011623 | Breast | DCIS | regulation of cysteine-type endopeptidase activity | 54/1390 | 235/18723 | 4.56e-14 | 1.29e-11 | 54 |
| GO:001049824 | Breast | DCIS | proteasomal protein catabolic process | 75/1390 | 490/18723 | 1.44e-09 | 1.40e-07 | 75 |
| GO:005254710 | Cervix | CC | regulation of peptidase activity | 112/2311 | 461/18723 | 6.70e-13 | 3.08e-10 | 112 |
| GO:005254810 | Cervix | CC | regulation of endopeptidase activity | 103/2311 | 432/18723 | 1.89e-11 | 5.14e-09 | 103 |
| GO:001049810 | Cervix | CC | proteasomal protein catabolic process | 111/2311 | 490/18723 | 8.98e-11 | 1.58e-08 | 111 |
| GO:200011610 | Cervix | CC | regulation of cysteine-type endopeptidase activity | 61/2311 | 235/18723 | 8.69e-09 | 7.22e-07 | 61 |
| GO:005254824 | Cervix | N_HPV | regulation of endopeptidase activity | 36/534 | 432/18723 | 9.74e-09 | 1.72e-06 | 36 |
| GO:005254724 | Cervix | N_HPV | regulation of peptidase activity | 36/534 | 461/18723 | 5.15e-08 | 5.59e-06 | 36 |
| GO:200011624 | Cervix | N_HPV | regulation of cysteine-type endopeptidase activity | 17/534 | 235/18723 | 4.36e-04 | 6.01e-03 | 17 |
| GO:001049815 | Cervix | N_HPV | proteasomal protein catabolic process | 27/534 | 490/18723 | 9.06e-04 | 1.08e-02 | 27 |
| GO:0010498 | Colorectum | AD | proteasomal protein catabolic process | 174/3918 | 490/18723 | 3.18e-14 | 7.66e-12 | 174 |
| GO:2000116 | Colorectum | AD | regulation of cysteine-type endopeptidase activity | 79/3918 | 235/18723 | 3.74e-06 | 1.03e-04 | 79 |
| GO:0052547 | Colorectum | AD | regulation of peptidase activity | 137/3918 | 461/18723 | 4.12e-06 | 1.12e-04 | 137 |
| GO:0052548 | Colorectum | AD | regulation of endopeptidase activity | 124/3918 | 432/18723 | 6.58e-05 | 1.07e-03 | 124 |
| Page: 1 2 3 4 5 |
| Pathway ID | Tissue | Disease Stage | Description | Gene Ratio | Bg Ratio | pvalue | p.adjust | qvalue | Count |
| hsa0305023 | Breast | IDC | Proteasome | 26/867 | 46/8465 | 9.89e-15 | 2.47e-13 | 1.85e-13 | 26 |
| hsa0305033 | Breast | IDC | Proteasome | 26/867 | 46/8465 | 9.89e-15 | 2.47e-13 | 1.85e-13 | 26 |
| hsa0305042 | Breast | DCIS | Proteasome | 26/846 | 46/8465 | 5.46e-15 | 1.36e-13 | 9.99e-14 | 26 |
| hsa0305052 | Breast | DCIS | Proteasome | 26/846 | 46/8465 | 5.46e-15 | 1.36e-13 | 9.99e-14 | 26 |
| hsa0305014 | Cervix | CC | Proteasome | 16/1267 | 46/8465 | 6.69e-04 | 3.09e-03 | 1.83e-03 | 16 |
| hsa0305015 | Cervix | CC | Proteasome | 16/1267 | 46/8465 | 6.69e-04 | 3.09e-03 | 1.83e-03 | 16 |
| hsa03050 | Colorectum | AD | Proteasome | 29/2092 | 46/8465 | 3.87e-08 | 6.18e-07 | 3.94e-07 | 29 |
| hsa030501 | Colorectum | AD | Proteasome | 29/2092 | 46/8465 | 3.87e-08 | 6.18e-07 | 3.94e-07 | 29 |
| hsa030502 | Colorectum | SER | Proteasome | 24/1580 | 46/8465 | 3.05e-07 | 5.96e-06 | 4.33e-06 | 24 |
| hsa030503 | Colorectum | SER | Proteasome | 24/1580 | 46/8465 | 3.05e-07 | 5.96e-06 | 4.33e-06 | 24 |
| hsa030504 | Colorectum | MSS | Proteasome | 29/1875 | 46/8465 | 2.72e-09 | 5.69e-08 | 3.48e-08 | 29 |
| hsa030505 | Colorectum | MSS | Proteasome | 29/1875 | 46/8465 | 2.72e-09 | 5.69e-08 | 3.48e-08 | 29 |
| hsa030506 | Colorectum | MSI-H | Proteasome | 23/797 | 46/8465 | 1.86e-12 | 4.64e-11 | 3.89e-11 | 23 |
| hsa030507 | Colorectum | MSI-H | Proteasome | 23/797 | 46/8465 | 1.86e-12 | 4.64e-11 | 3.89e-11 | 23 |
| hsa0305028 | Esophagus | ESCC | Proteasome | 44/4205 | 46/8465 | 1.05e-11 | 1.60e-10 | 8.21e-11 | 44 |
| hsa0305037 | Esophagus | ESCC | Proteasome | 44/4205 | 46/8465 | 1.05e-11 | 1.60e-10 | 8.21e-11 | 44 |
| hsa030509 | Liver | Cirrhotic | Proteasome | 41/2530 | 46/8465 | 6.22e-17 | 2.30e-15 | 1.42e-15 | 41 |
| hsa0305012 | Liver | Cirrhotic | Proteasome | 41/2530 | 46/8465 | 6.22e-17 | 2.30e-15 | 1.42e-15 | 41 |
| hsa0305022 | Liver | HCC | Proteasome | 43/4020 | 46/8465 | 2.62e-11 | 4.61e-10 | 2.56e-10 | 43 |
| hsa0305032 | Liver | HCC | Proteasome | 43/4020 | 46/8465 | 2.62e-11 | 4.61e-10 | 2.56e-10 | 43 |
| Page: 1 2 |
Top |
Cell-cell communication analysis |
| Identification of potential cell-cell interactions between two cell types and their ligand-receptor pairs for different disease states |
| Ligand | Receptor | LRpair | Pathway | Tissue | Disease Stage |
| Page: 1 |
Top |
Single-cell gene regulatory network inference analysis |
| Find out the significant the regulons (TFs) and the target genes of each regulon across cell types for different disease states |
| TF | Cell Type | Tissue | Disease Stage | Target Gene | RSS | Regulon Activity |
| ∗The dot plots of a searched regulon are shown for all cell subpopulations in each disease state of each tissue based on the regulon specific score inferred using pySCENIC and by calculating the average expression. |
| Page: 1 |
Top |
Somatic mutation of malignant transformation related genes |
| Annotation of somatic variants for genes involved in malignant transformation |
| Hugo Symbol | Variant Class | Variant Classification | dbSNP RS | HGVSc | HGVSp | HGVSp Short | SWISSPROT | BIOTYPE | SIFT | PolyPhen | Tumor Sample Barcode | Tissue | Histology | Sex | Age | Stage | Therapy Types | Drugs | Outcome |
| PSMB9 | SNV | Missense_Mutation | novel | c.311N>A | p.Arg104Lys | p.R104K | P28065 | protein_coding | tolerated(0.85) | benign(0.006) | TCGA-C5-A8XJ-01 | Cervix | cervical & endocervical cancer | Female | >=65 | I/II | Chemotherapy | cisplatin | SD |
| PSMB9 | SNV | Missense_Mutation | c.35N>T | p.Pro12Leu | p.P12L | P28065 | protein_coding | tolerated(0.72) | benign(0) | TCGA-JW-A5VI-01 | Cervix | cervical & endocervical cancer | Female | <65 | I/II | Chemotherapy | topotecan | PD | |
| PSMB9 | SNV | Missense_Mutation | c.434N>T | p.Ala145Val | p.A145V | P28065 | protein_coding | deleterious(0.04) | benign(0.114) | TCGA-AA-3821-01 | Colorectum | colon adenocarcinoma | Female | >=65 | I/II | Unknown | Unknown | SD | |
| PSMB9 | SNV | Missense_Mutation | novel | c.315N>G | p.Asn105Lys | p.N105K | P28065 | protein_coding | tolerated(0.29) | possibly_damaging(0.506) | TCGA-AA-3984-01 | Colorectum | colon adenocarcinoma | Female | <65 | I/II | Unknown | Unknown | SD |
| PSMB9 | SNV | Missense_Mutation | novel | c.175N>A | p.Glu59Lys | p.E59K | P28065 | protein_coding | deleterious(0.03) | benign(0.005) | TCGA-EI-6917-01 | Colorectum | rectum adenocarcinoma | Male | <65 | III/IV | Chemotherapy | 5fluorouracil+oxaciplatina+l-folinian | SD |
| PSMB9 | SNV | Missense_Mutation | c.73N>A | p.Ala25Thr | p.A25T | P28065 | protein_coding | deleterious(0) | possibly_damaging(0.624) | TCGA-EI-7002-01 | Colorectum | rectum adenocarcinoma | Male | <65 | III/IV | Chemotherapy | irinotecan+5-fluorouracilim | SD | |
| PSMB9 | SNV | Missense_Mutation | c.648N>A | p.Phe216Leu | p.F216L | P28065 | protein_coding | deleterious(0.05) | probably_damaging(0.987) | TCGA-AX-A0J0-01 | Endometrium | uterine corpus endometrioid carcinoma | Female | <65 | I/II | Unknown | Unknown | SD | |
| PSMB9 | SNV | Missense_Mutation | rs148645171 | c.652G>C | p.Asp218His | p.D218H | P28065 | protein_coding | deleterious(0) | possibly_damaging(0.841) | TCGA-AX-A1C5-01 | Endometrium | uterine corpus endometrioid carcinoma | Female | <65 | III/IV | Unspecific | Carboplatin | SD |
| PSMB9 | SNV | Missense_Mutation | c.648N>A | p.Phe216Leu | p.F216L | P28065 | protein_coding | deleterious(0.05) | probably_damaging(0.987) | TCGA-EY-A1GD-01 | Endometrium | uterine corpus endometrioid carcinoma | Female | <65 | I/II | Unknown | Unknown | SD | |
| PSMB9 | SNV | Missense_Mutation | rs369359789 | c.494G>A | p.Gly165Asp | p.G165D | P28065 | protein_coding | tolerated(0.23) | benign(0.028) | TCGA-FI-A2D5-01 | Endometrium | uterine corpus endometrioid carcinoma | Female | <65 | III/IV | Chemotherapy | carboplatinum | PD |
| Page: 1 2 |
Top |
Related drugs of malignant transformation related genes |
| Identification of chemicals and drugs interact with genes involved in malignant transfromation |
| (DGIdb 4.0) |
| Entrez ID | Symbol | Category | Interaction Types | Drug Claim Name | Drug Name | PMIDs |
| 5698 | PSMB9 | DRUGGABLE GENOME, PROTEASE, ENZYME | CARFILZOMIB | CARFILZOMIB | 24524217 | |
| 5698 | PSMB9 | DRUGGABLE GENOME, PROTEASE, ENZYME | inhibitor | 385612170 | KZR-616 | |
| 5698 | PSMB9 | DRUGGABLE GENOME, PROTEASE, ENZYME | inhibitor | CHEMBL451887 | CARFILZOMIB | |
| 5698 | PSMB9 | DRUGGABLE GENOME, PROTEASE, ENZYME | inhibitor | CHEMBL2103884 | OPROZOMIB | |
| 5698 | PSMB9 | DRUGGABLE GENOME, PROTEASE, ENZYME | inhibitor | CHEMBL325041 | BORTEZOMIB | |
| 5698 | PSMB9 | DRUGGABLE GENOME, PROTEASE, ENZYME | inhibitor | BORTEZOMIB | BORTEZOMIB | |
| 5698 | PSMB9 | DRUGGABLE GENOME, PROTEASE, ENZYME | inhibitor | CHEMBL371405 | MARIZOMIB | |
| 5698 | PSMB9 | DRUGGABLE GENOME, PROTEASE, ENZYME | BORTEZOMIB | BORTEZOMIB | 24524217 | |
| 5698 | PSMB9 | DRUGGABLE GENOME, PROTEASE, ENZYME | inhibitor | CHEMBL3545432 | IXAZOMIB CITRATE | |
| 5698 | PSMB9 | DRUGGABLE GENOME, PROTEASE, ENZYME | inhibitor | CARFILZOMIB | CARFILZOMIB |
| Page: 1 |

Copyright 2023-Present -The University of Texas Health Science Center at Houston |