
|
|||||
|
 | |
| |
| |
| |
| |
| |
|
Gene: PSMB7 |
Gene summary for PSMB7 |
| Gene information | Species | Human | Gene symbol | PSMB7 | Gene ID | 5695 |
| Gene name | proteasome 20S subunit beta 7 | |
| Gene Alias | Z | |
| Cytomap | 9q33.3 | |
| Gene Type | protein-coding | GO ID | GO:0006508 | UniProtAcc | E9KL30 |
Top |
Malignant transformation analysis |
| Identification of the aberrant gene expression in precancerous and cancerous lesions by comparing the gene expression of stem-like cells in diseased tissues with normal stem cells |
| Entrez ID | Symbol | Replicates | Species | Organ | Tissue | Adj P-value | Log2FC | Malignancy |
| 5695 | PSMB7 | HTA11_3410_2000001011 | Human | Colorectum | AD | 1.61e-02 | 2.17e-01 | 0.0155 |
| 5695 | PSMB7 | HTA11_2487_2000001011 | Human | Colorectum | SER | 1.71e-07 | 6.47e-01 | -0.1808 |
| 5695 | PSMB7 | HTA11_1938_2000001011 | Human | Colorectum | AD | 1.22e-09 | 6.93e-01 | -0.0811 |
| 5695 | PSMB7 | HTA11_78_2000001011 | Human | Colorectum | AD | 1.01e-09 | 5.83e-01 | -0.1088 |
| 5695 | PSMB7 | HTA11_347_2000001011 | Human | Colorectum | AD | 1.20e-19 | 6.70e-01 | -0.1954 |
| 5695 | PSMB7 | HTA11_83_2000001011 | Human | Colorectum | SER | 1.08e-05 | 6.29e-01 | -0.1526 |
| 5695 | PSMB7 | HTA11_696_2000001011 | Human | Colorectum | AD | 4.59e-20 | 6.97e-01 | -0.1464 |
| 5695 | PSMB7 | HTA11_866_2000001011 | Human | Colorectum | AD | 6.86e-04 | 3.15e-01 | -0.1001 |
| 5695 | PSMB7 | HTA11_1391_2000001011 | Human | Colorectum | AD | 6.60e-16 | 8.07e-01 | -0.059 |
| 5695 | PSMB7 | HTA11_2992_2000001011 | Human | Colorectum | SER | 7.03e-07 | 8.56e-01 | -0.1706 |
| 5695 | PSMB7 | HTA11_5216_2000001011 | Human | Colorectum | SER | 1.01e-03 | 5.67e-01 | -0.1462 |
| 5695 | PSMB7 | HTA11_546_2000001011 | Human | Colorectum | AD | 1.93e-05 | 5.62e-01 | -0.0842 |
| 5695 | PSMB7 | HTA11_7862_2000001011 | Human | Colorectum | AD | 3.80e-03 | 5.00e-01 | -0.0179 |
| 5695 | PSMB7 | HTA11_866_3004761011 | Human | Colorectum | AD | 9.48e-19 | 8.44e-01 | 0.096 |
| 5695 | PSMB7 | HTA11_8622_2000001021 | Human | Colorectum | SER | 1.83e-03 | 6.43e-01 | 0.0528 |
| 5695 | PSMB7 | HTA11_7663_2000001011 | Human | Colorectum | SER | 1.67e-05 | 7.69e-01 | 0.0131 |
| 5695 | PSMB7 | HTA11_6801_2000001011 | Human | Colorectum | SER | 1.62e-06 | 1.01e+00 | 0.0171 |
| 5695 | PSMB7 | HTA11_10711_2000001011 | Human | Colorectum | AD | 1.79e-02 | 4.32e-01 | 0.0338 |
| 5695 | PSMB7 | HTA11_7696_3000711011 | Human | Colorectum | AD | 3.85e-17 | 6.70e-01 | 0.0674 |
| 5695 | PSMB7 | HTA11_6818_2000001021 | Human | Colorectum | AD | 1.13e-06 | 5.70e-01 | 0.0588 |
| Page: 1 2 3 4 5 6 7 8 9 10 |
| Tissue | Expression Dynamics | Abbreviation |
| Colorectum (GSE201348) |  | FAP: Familial adenomatous polyposis |
| CRC: Colorectal cancer | ||
| Colorectum (HTA11) | 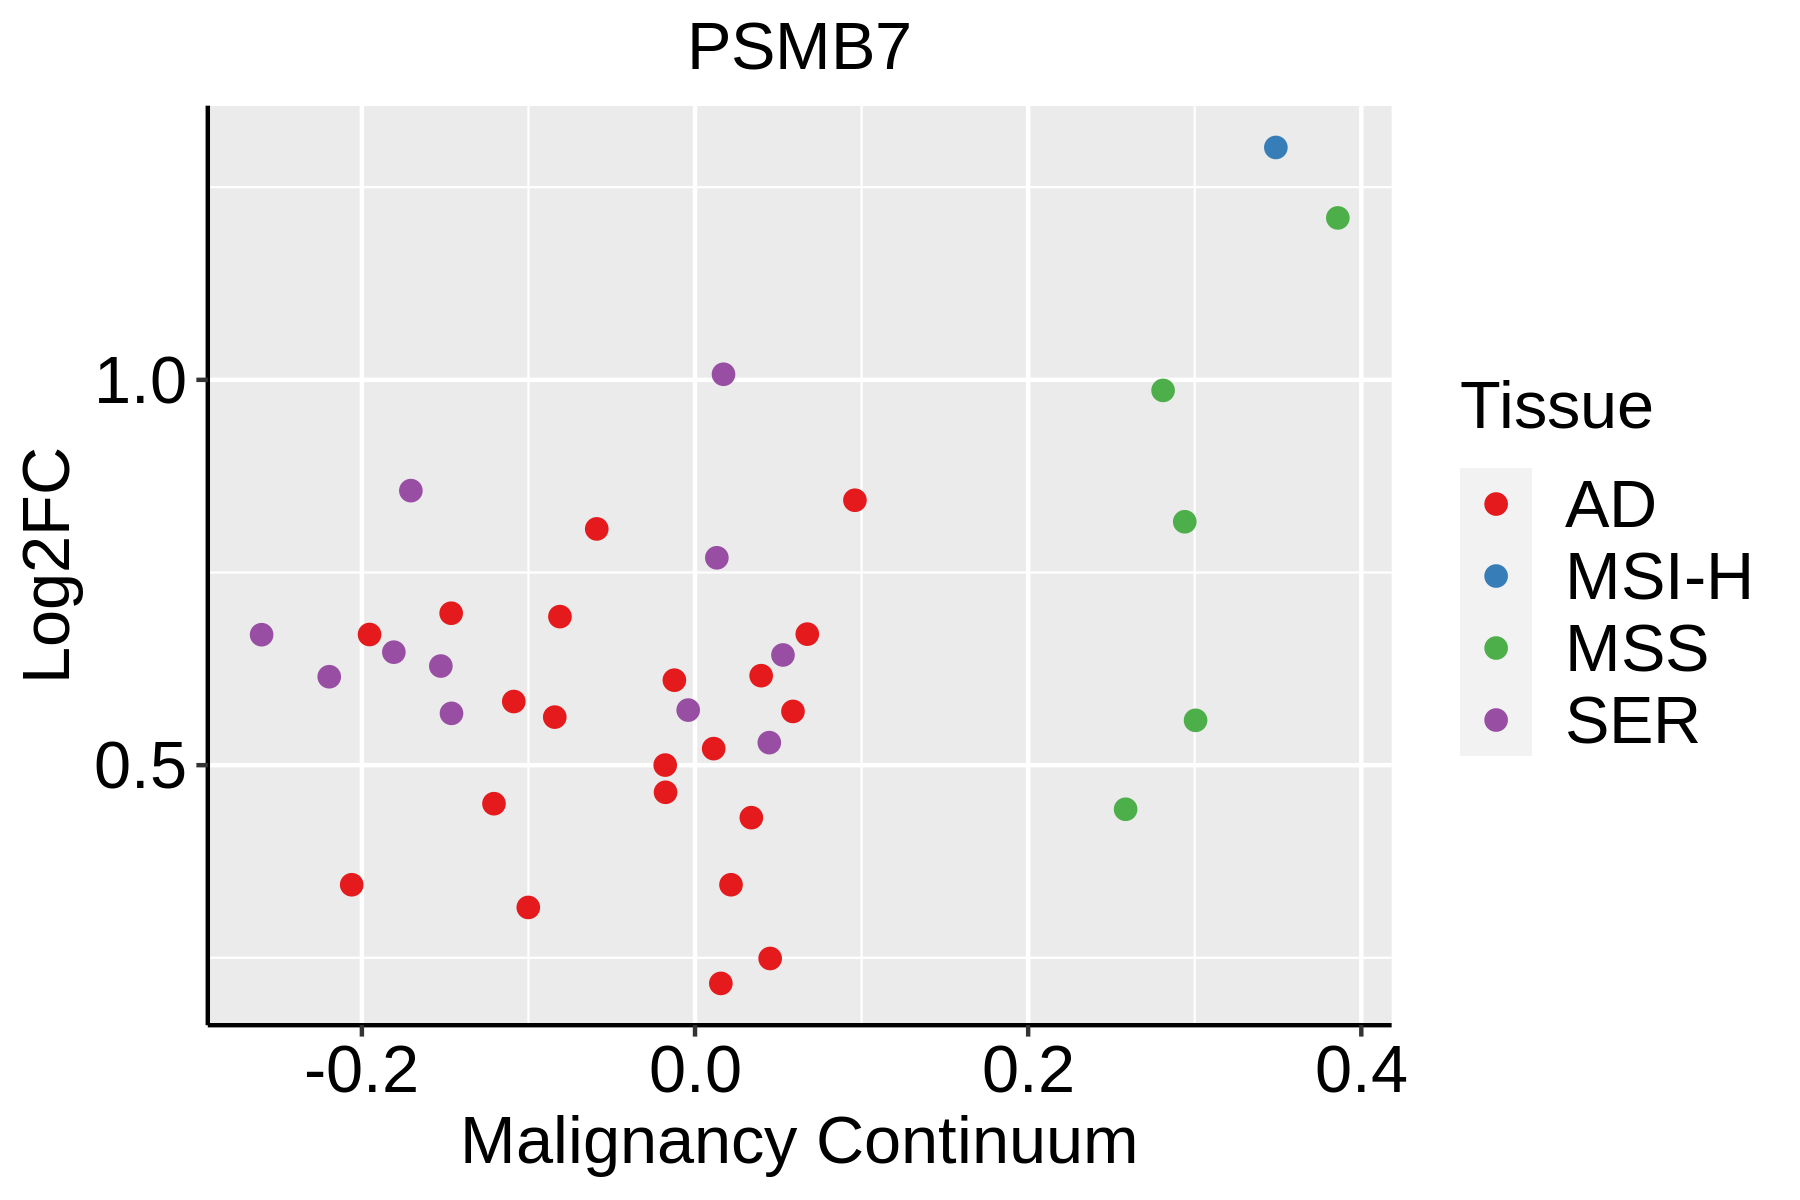 | AD: Adenomas |
| SER: Sessile serrated lesions | ||
| MSI-H: Microsatellite-high colorectal cancer | ||
| MSS: Microsatellite stable colorectal cancer | ||
| Endometrium | 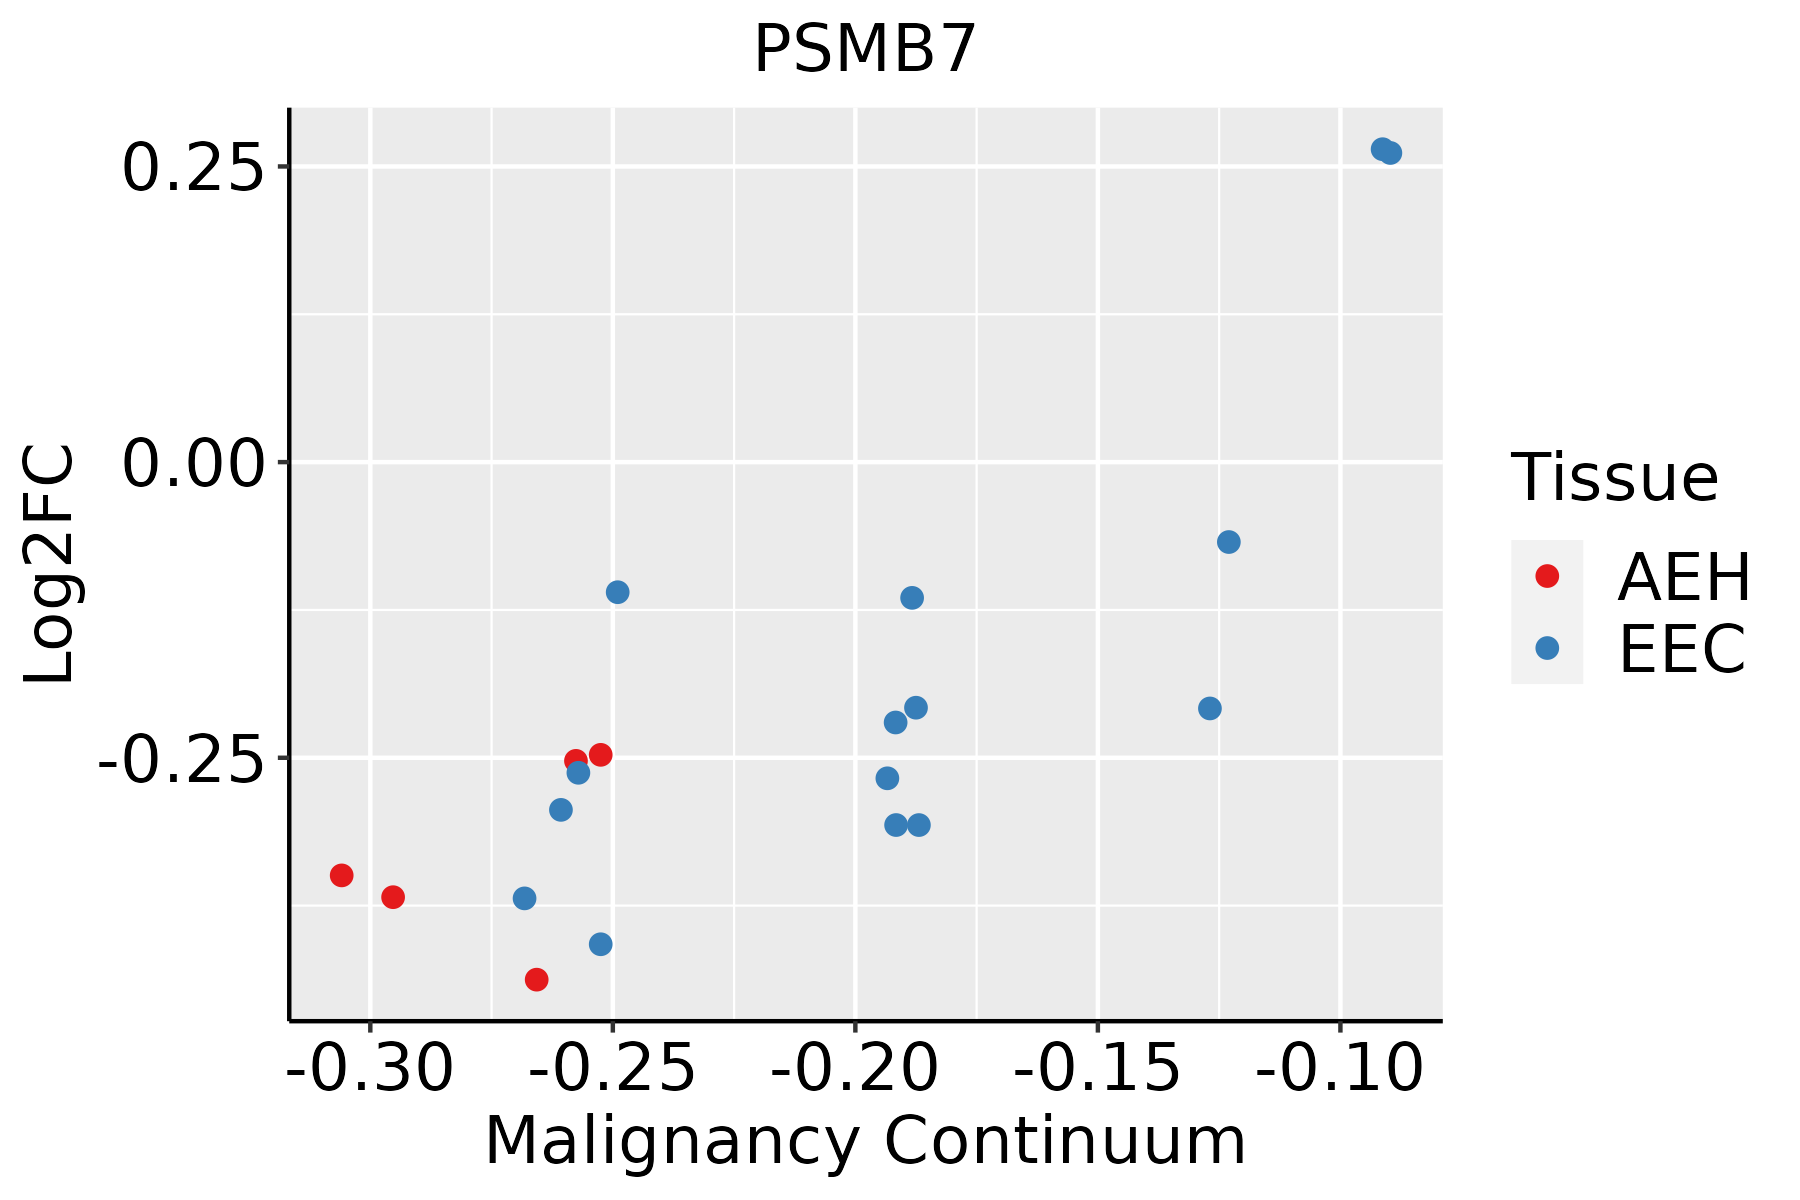 | AEH: Atypical endometrial hyperplasia |
| EEC: Endometrioid Cancer | ||
| Esophagus | 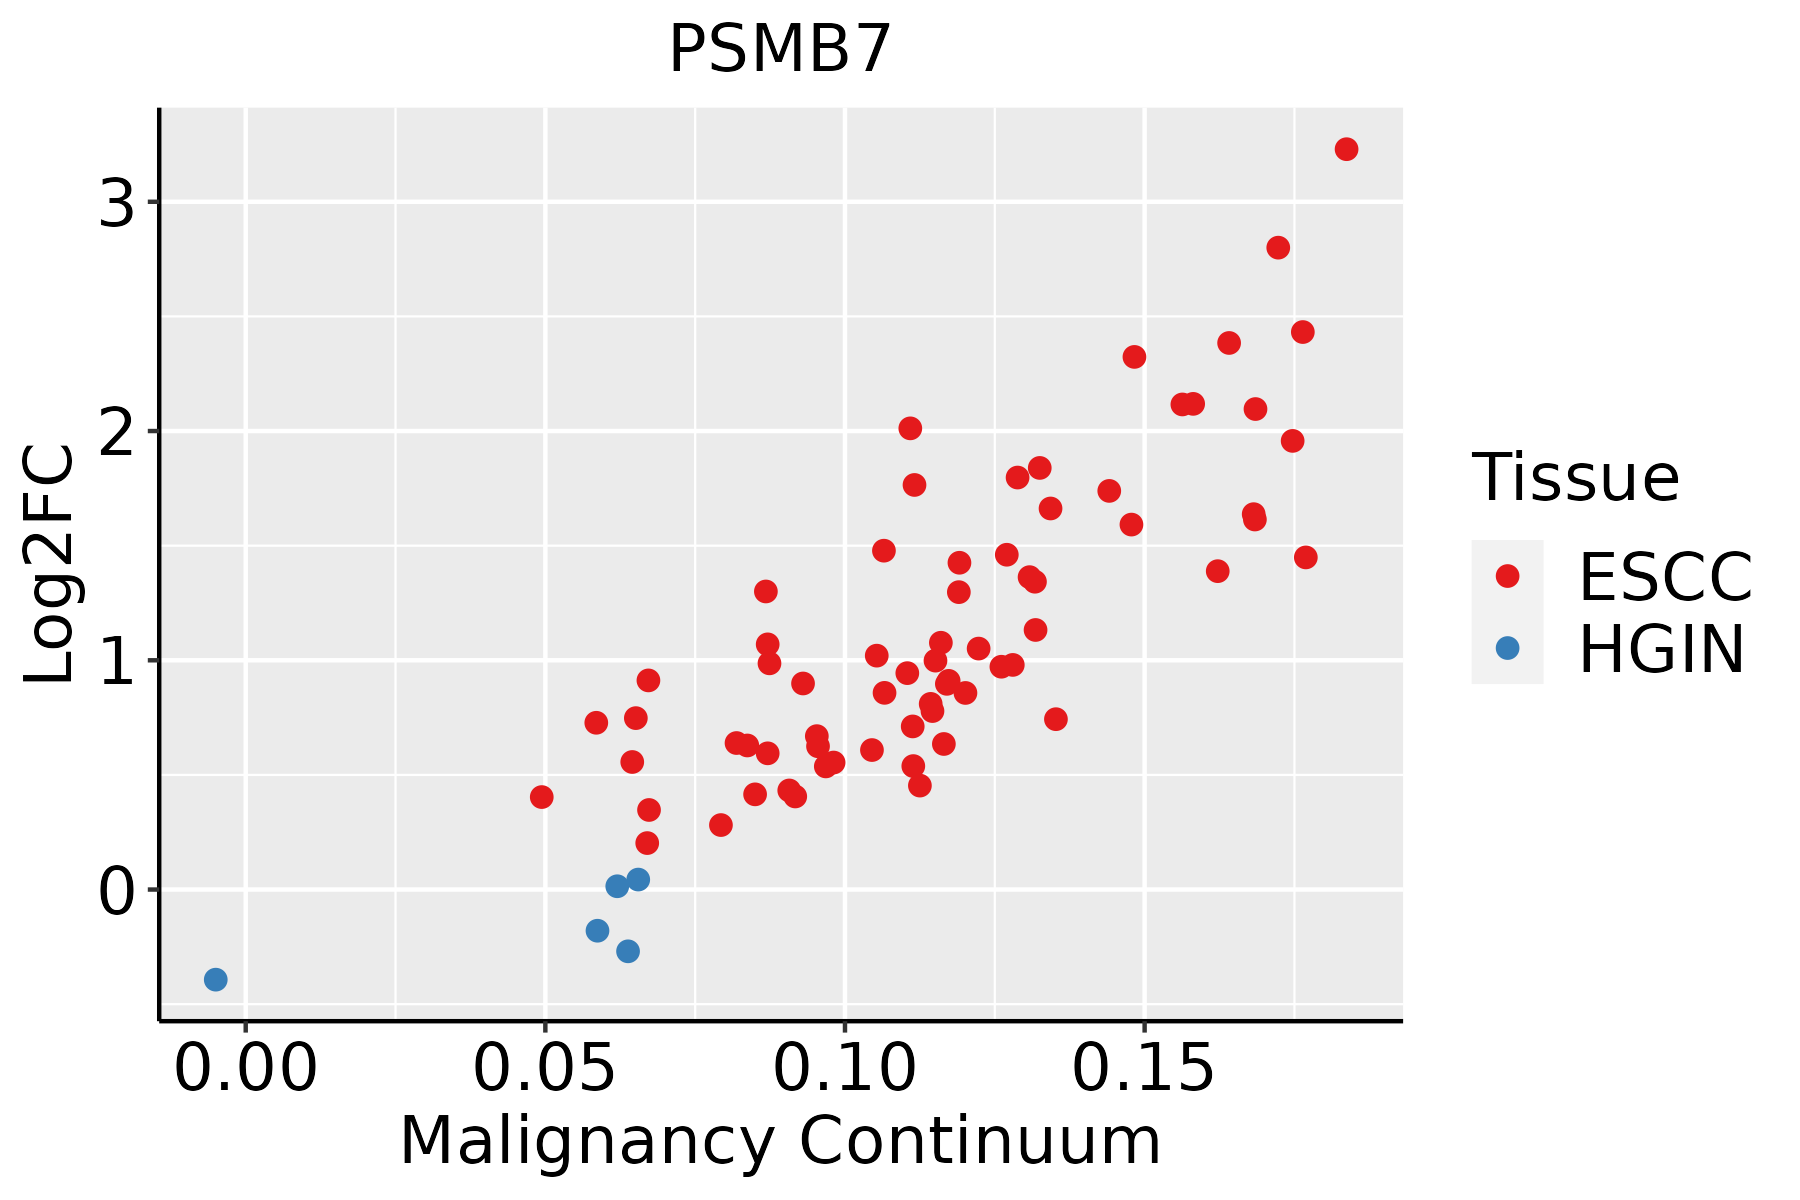 | ESCC: Esophageal squamous cell carcinoma |
| HGIN: High-grade intraepithelial neoplasias | ||
| LGIN: Low-grade intraepithelial neoplasias | ||
| Liver | 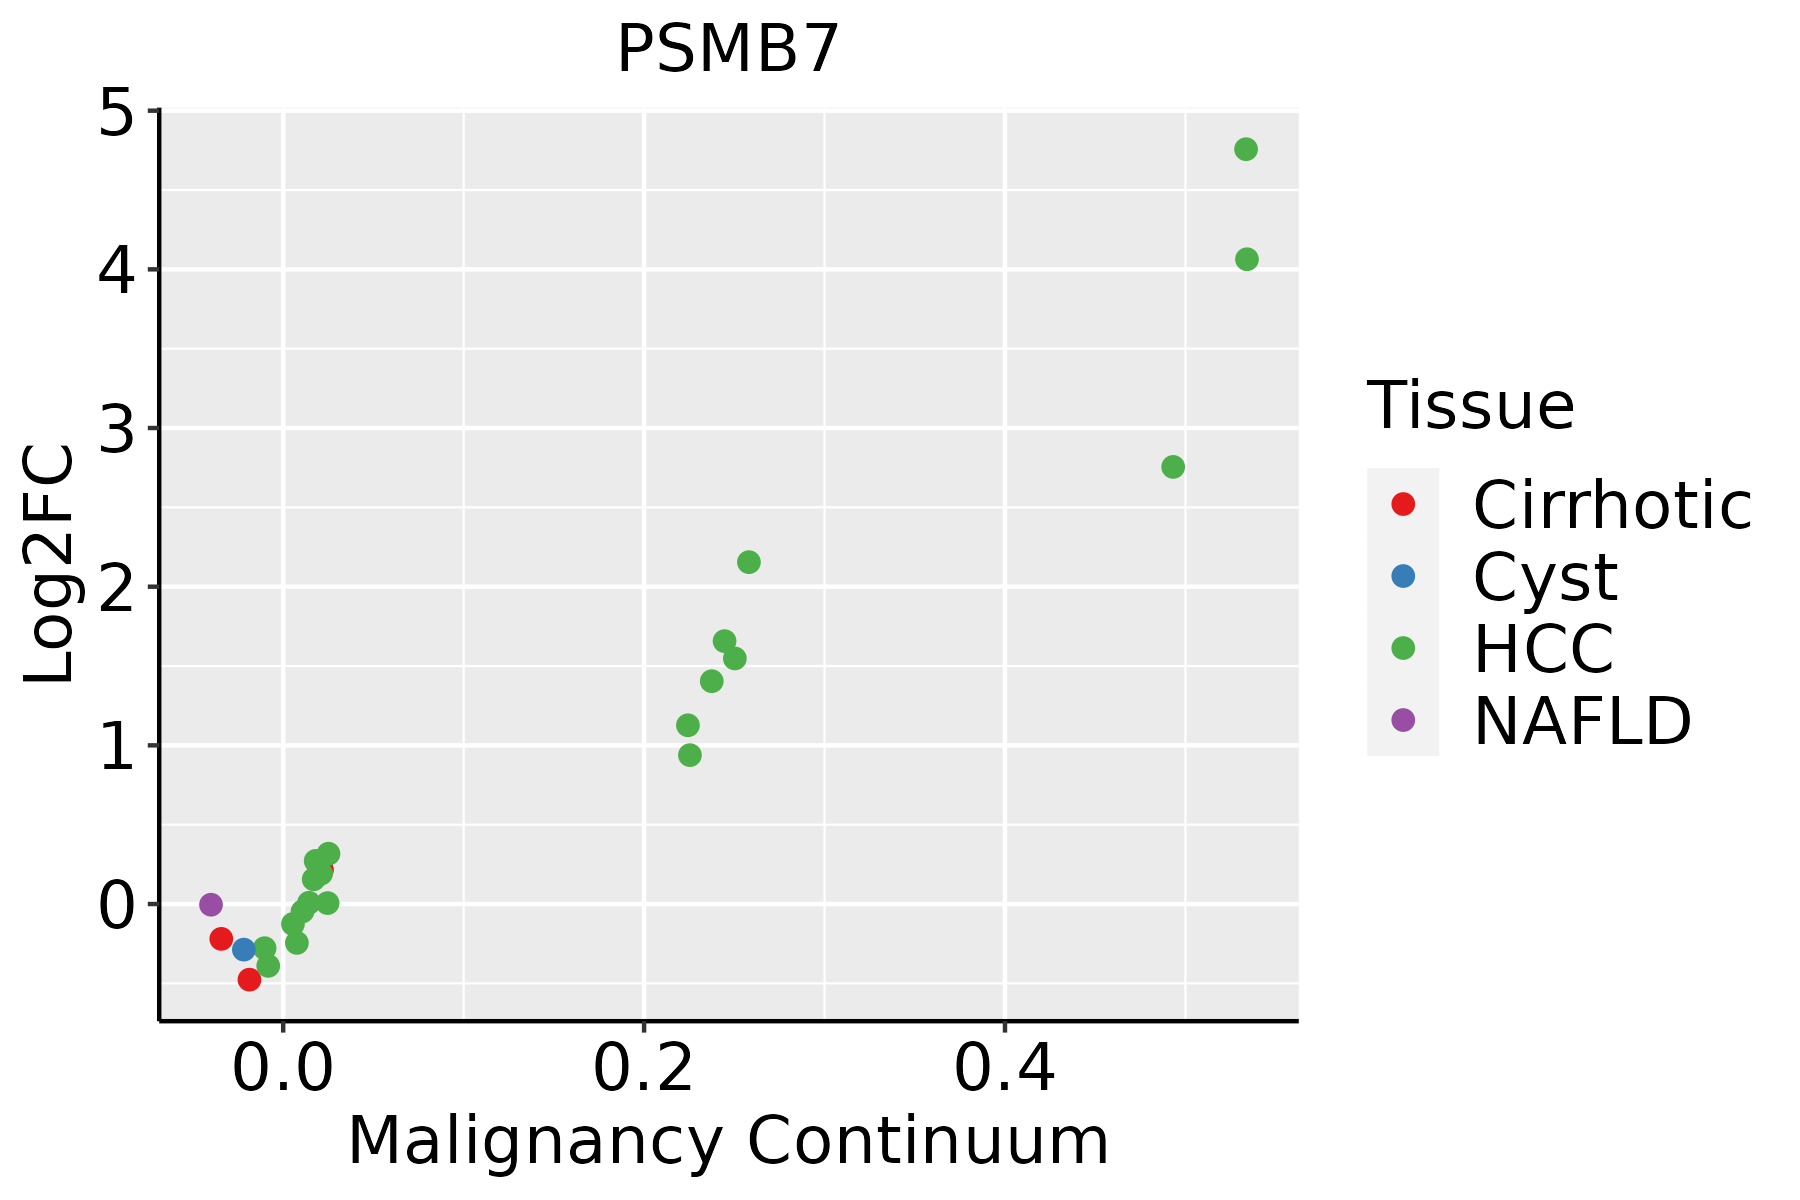 | HCC: Hepatocellular carcinoma |
| NAFLD: Non-alcoholic fatty liver disease | ||
| Oral Cavity | 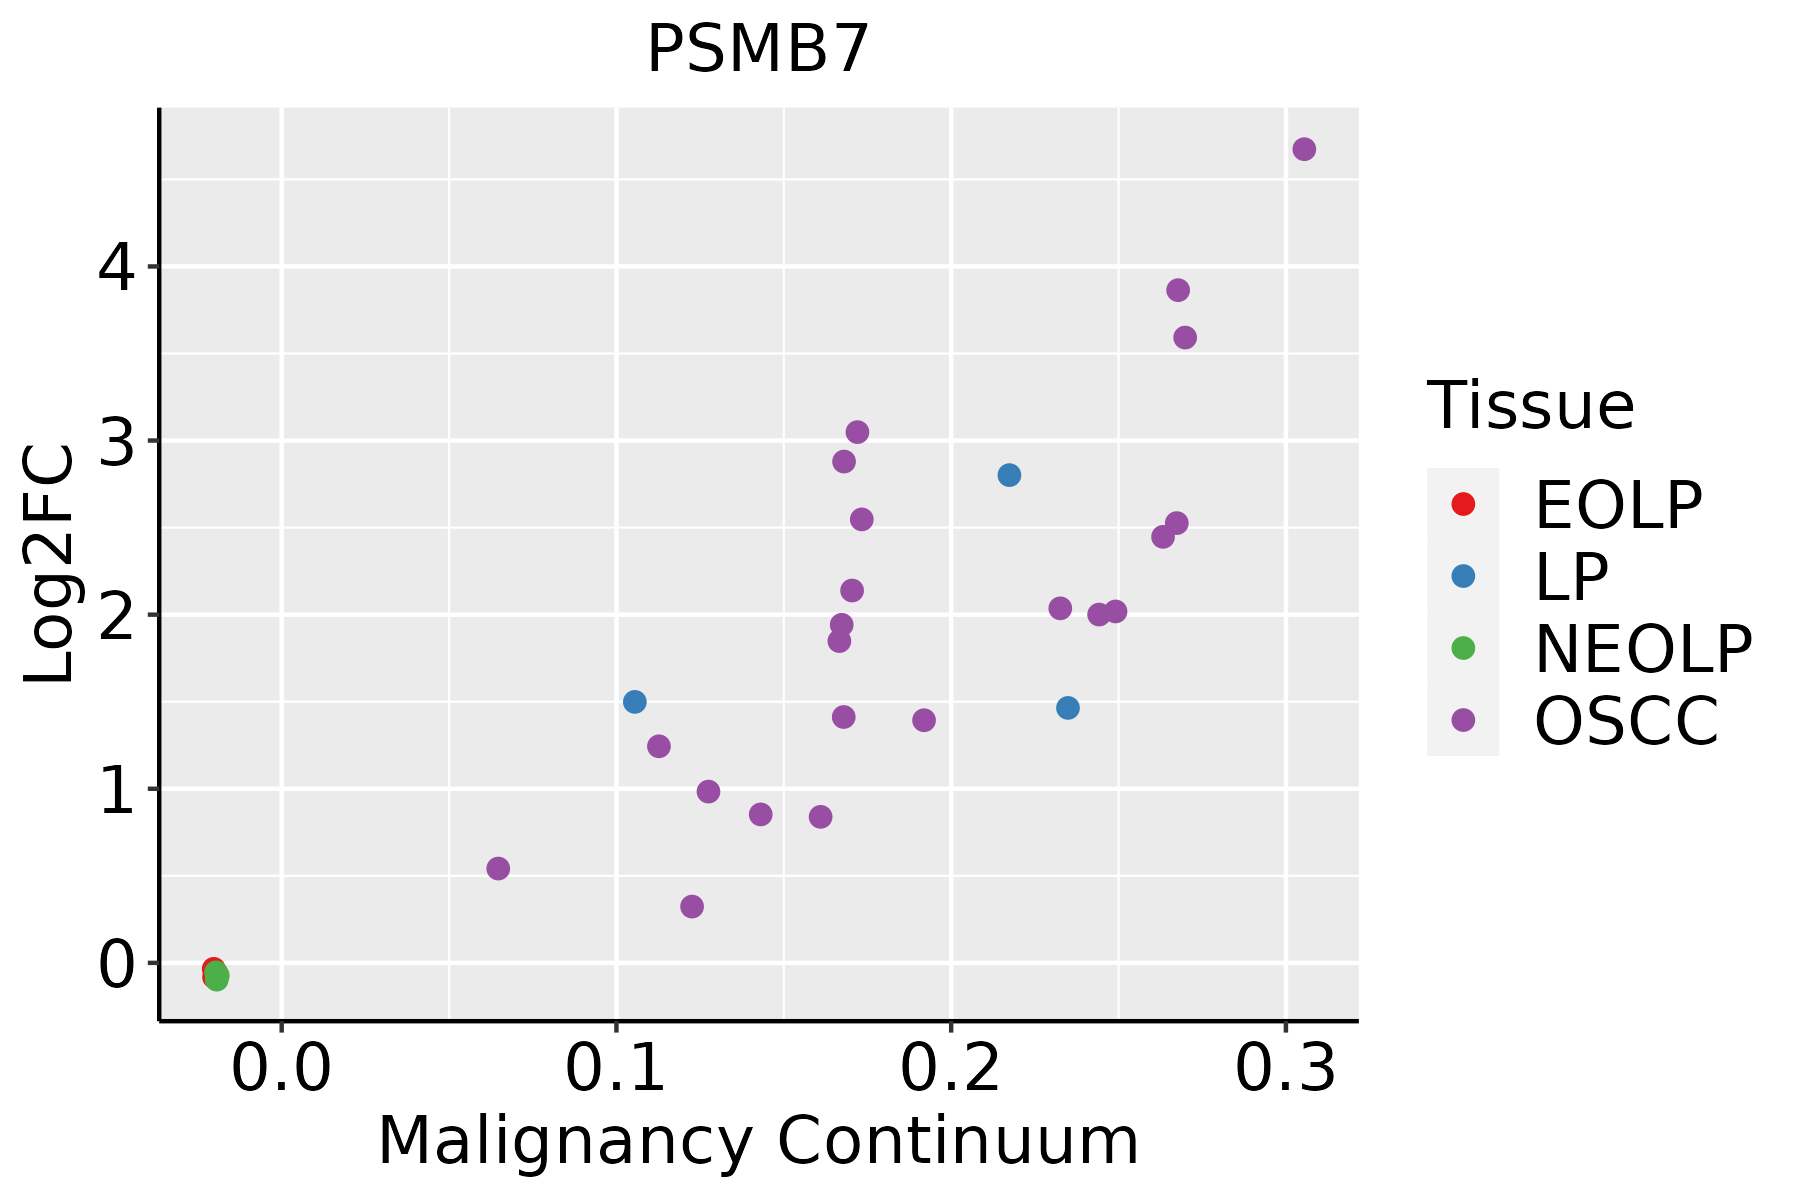 | EOLP: Erosive Oral lichen planus |
| LP: leukoplakia | ||
| NEOLP: Non-erosive oral lichen planus | ||
| OSCC: Oral squamous cell carcinoma | ||
| Prostate | 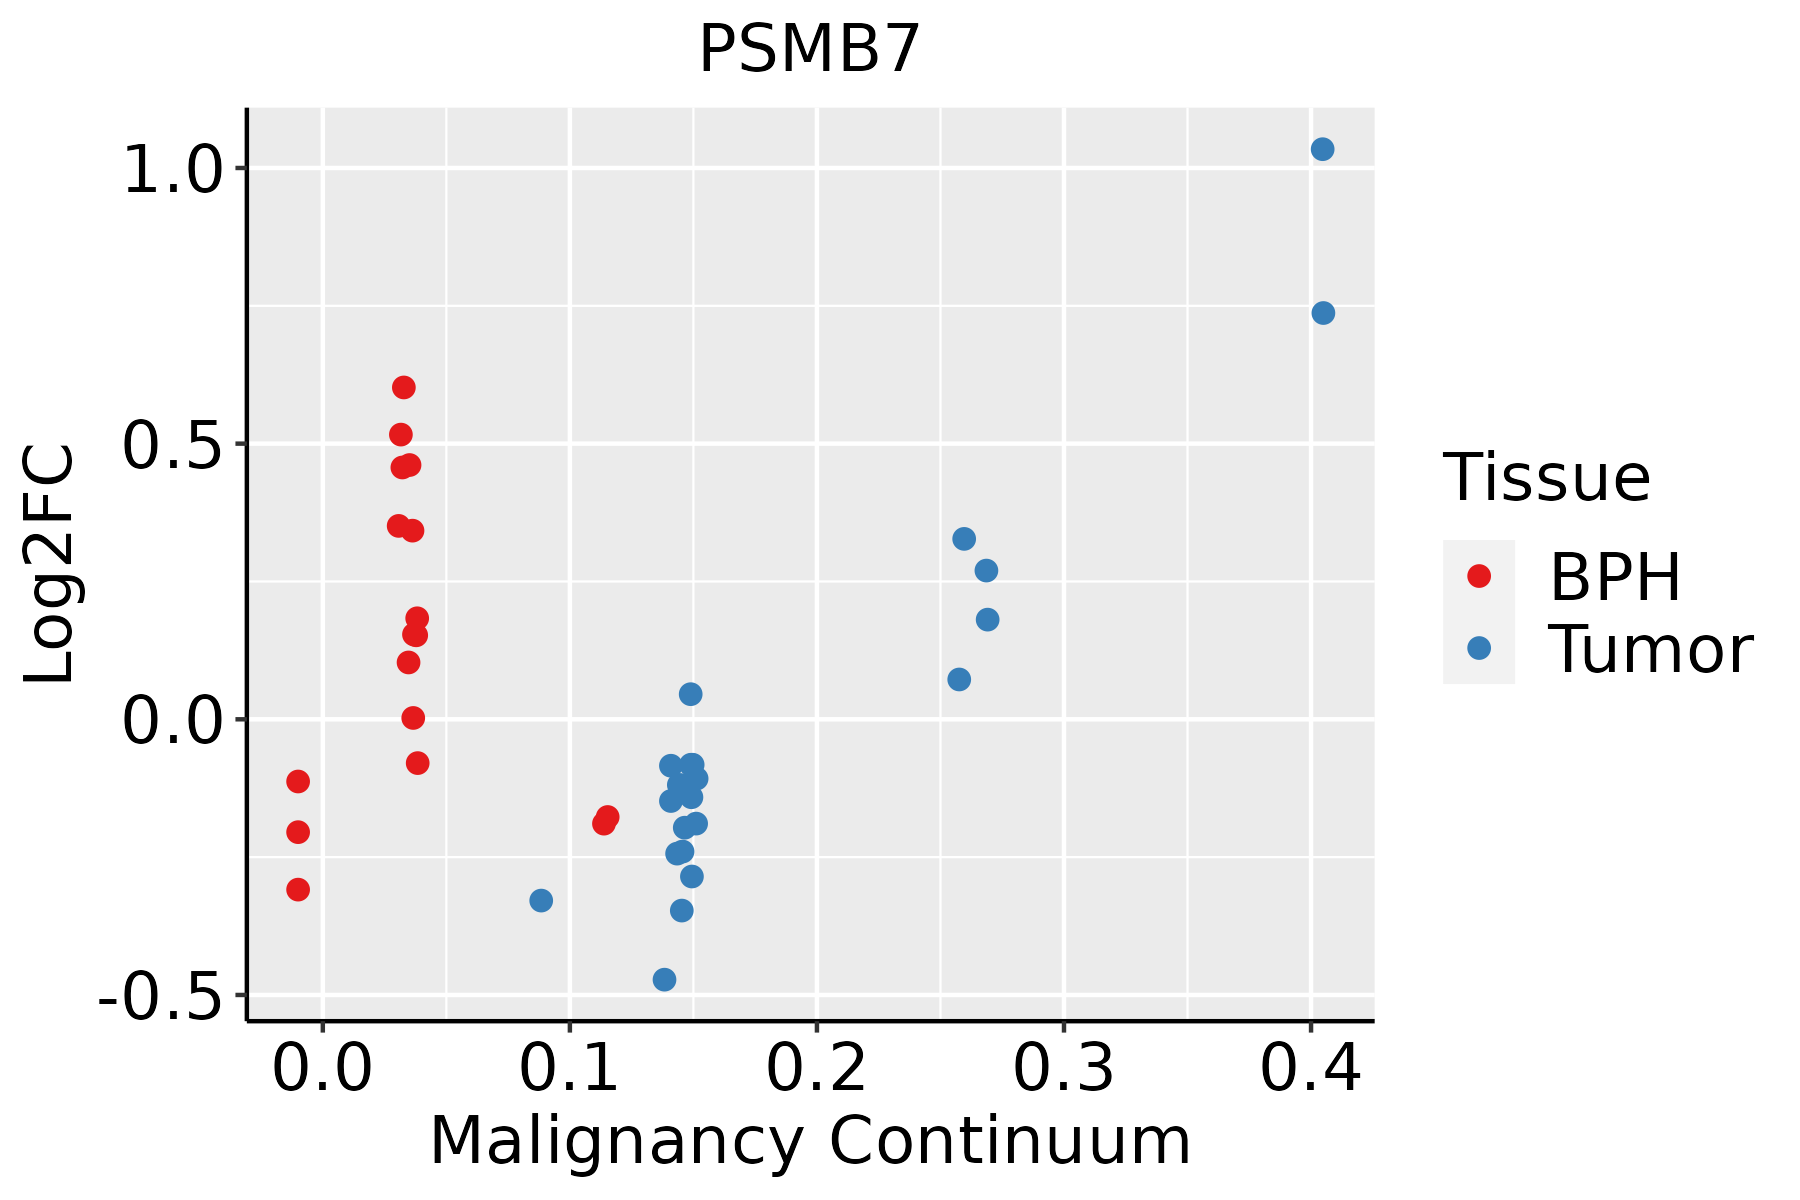 | BPH: Benign Prostatic Hyperplasia |
| Skin | 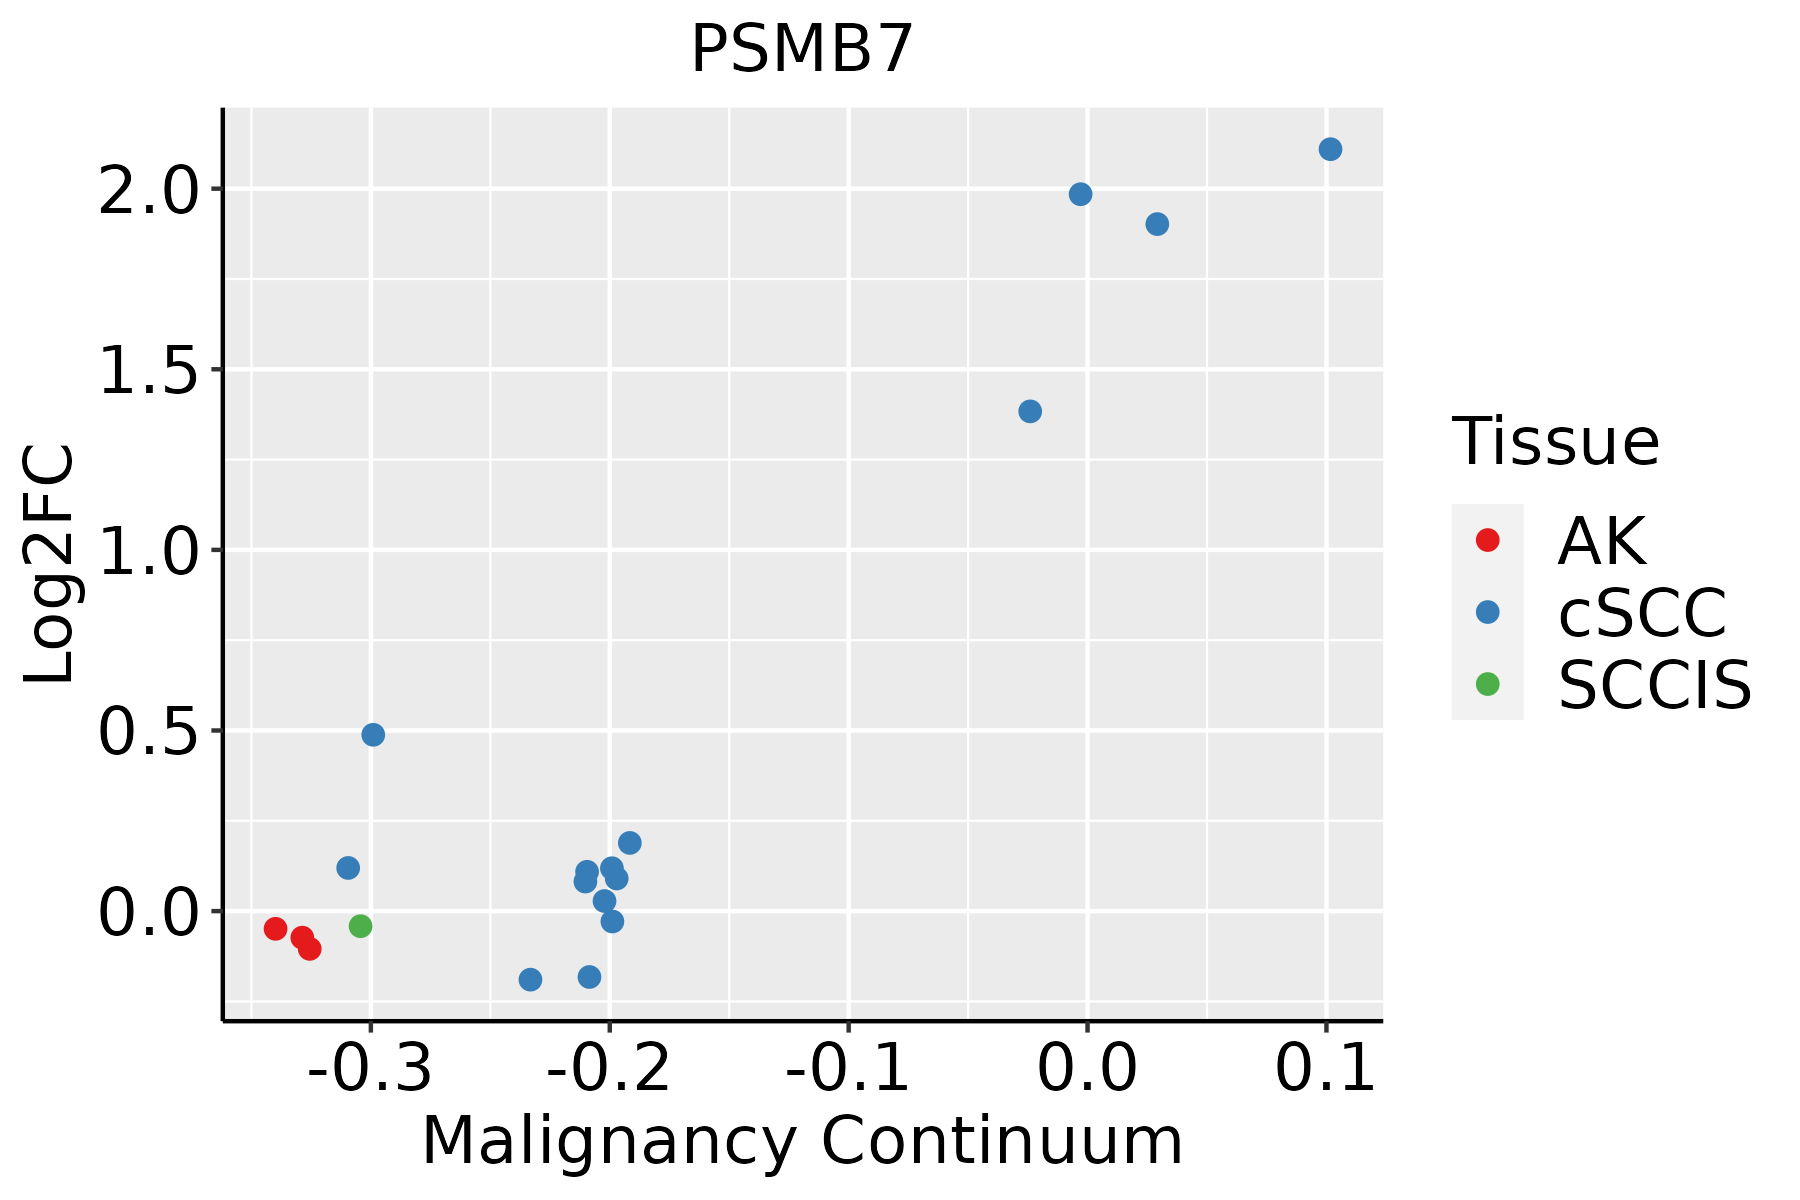 | AK: Actinic keratosis |
| cSCC: Cutaneous squamous cell carcinoma | ||
| SCCIS:squamous cell carcinoma in situ | ||
| Thyroid | 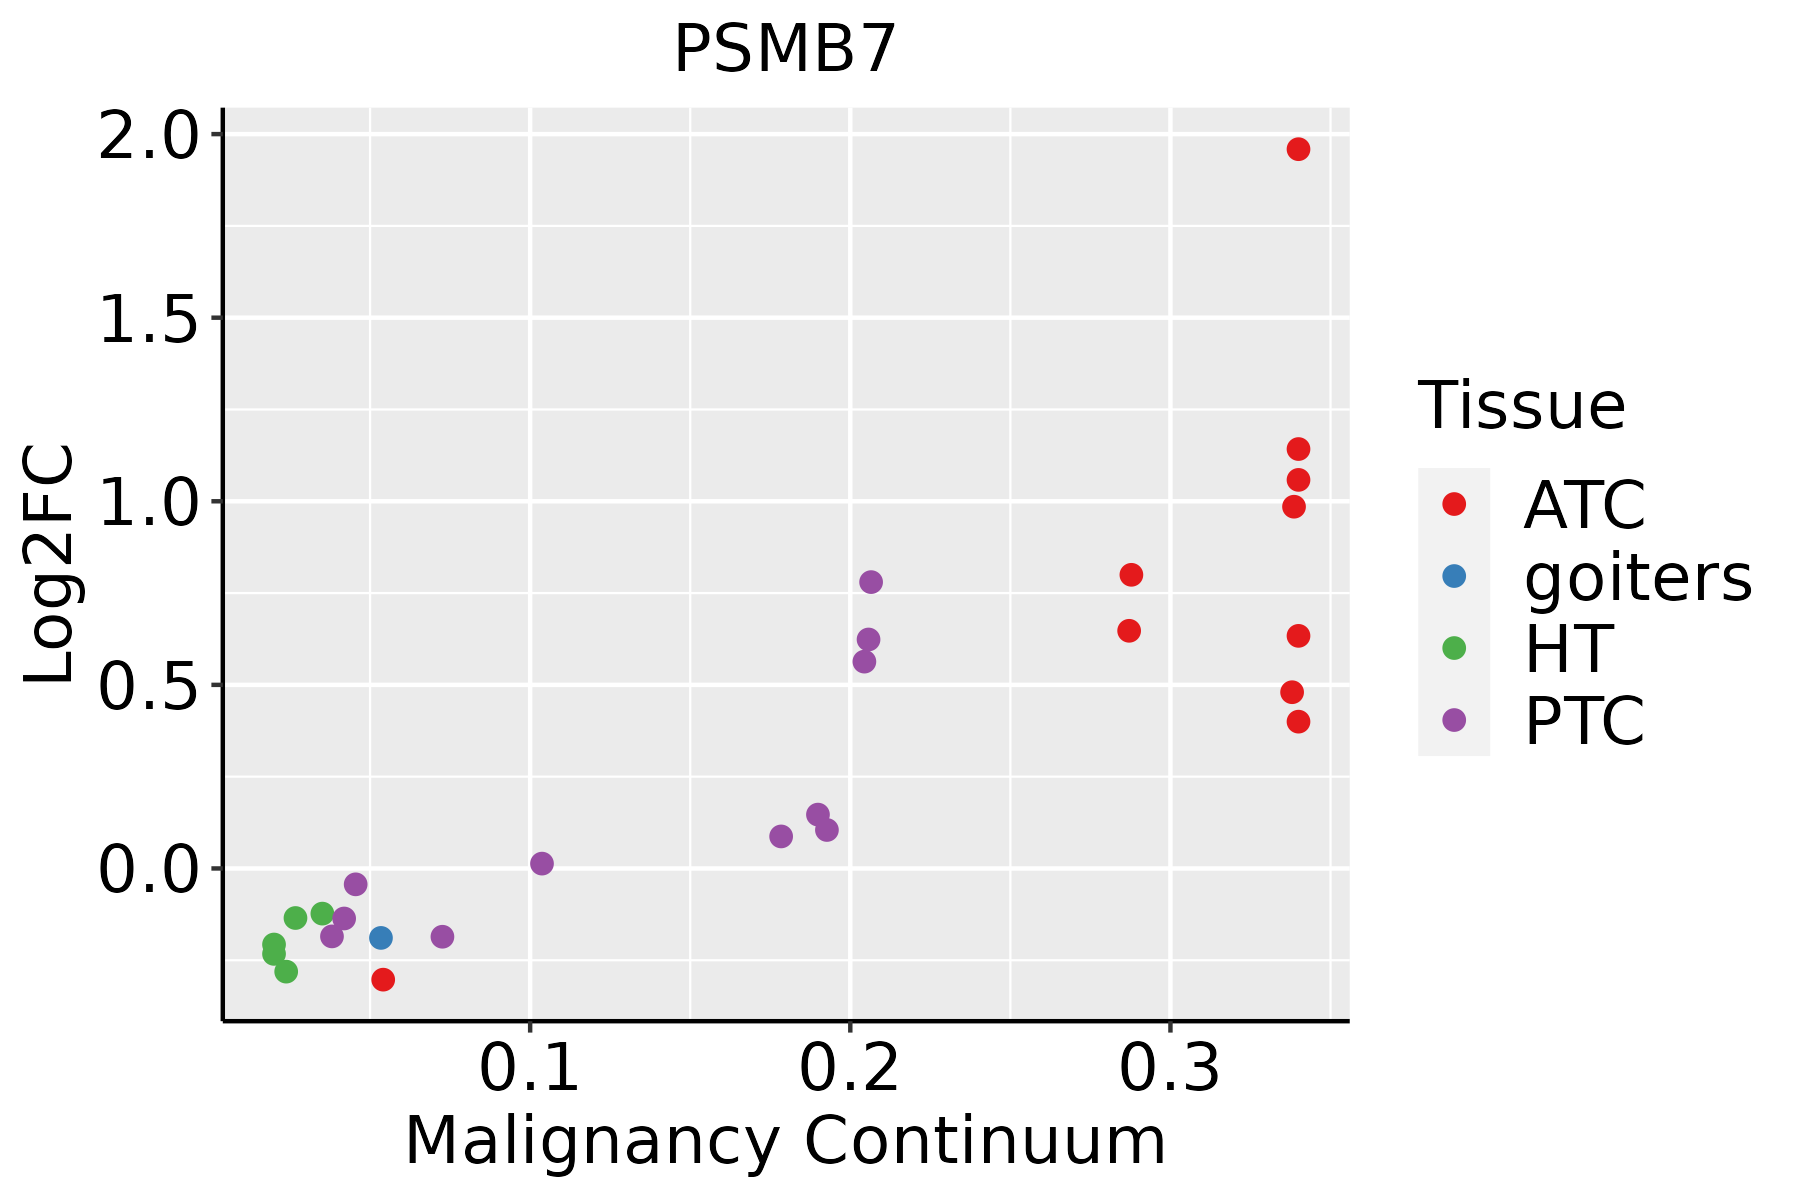 | ATC: Anaplastic thyroid cancer |
| HT: Hashimoto's thyroiditis | ||
| PTC: Papillary thyroid cancer |
| ∗log2FC in expression of this searched gene in stem-like cells from each diseased tissue sample relative to stem-like cells in normal samples in each tissue plotted against the malignancy continuum. Samples are colored based on if they are from different disease stage. |
Top |
Malignant transformation related pathway analysis |
| Find out the enriched GO biological processes and KEGG pathways involved in transition from healthy to precancer to cancer |
| Tissue | Disease Stage | Enriched GO biological Processes |
| Colorectum | AD |  |
| Colorectum | SER |  |
| Colorectum | MSS |  |
| Colorectum | MSI-H |  |
| Colorectum | FAP |  |
| ∗Top 15 enriched GO BP terms are showed in the bar plot of each disease state in each tissue. Each row represents a significant GO biological process which is colored according to the -log10(p.adjust). |
| Page: 1 2 3 4 5 6 7 8 9 |
| GO ID | Tissue | Disease Stage | Description | Gene Ratio | Bg Ratio | pvalue | p.adjust | Count |
| GO:0010498 | Colorectum | AD | proteasomal protein catabolic process | 174/3918 | 490/18723 | 3.18e-14 | 7.66e-12 | 174 |
| GO:00104981 | Colorectum | SER | proteasomal protein catabolic process | 132/2897 | 490/18723 | 3.08e-11 | 5.55e-09 | 132 |
| GO:00104982 | Colorectum | MSS | proteasomal protein catabolic process | 157/3467 | 490/18723 | 2.39e-13 | 5.25e-11 | 157 |
| GO:00104983 | Colorectum | MSI-H | proteasomal protein catabolic process | 71/1319 | 490/18723 | 4.67e-09 | 6.03e-07 | 71 |
| GO:00104984 | Colorectum | FAP | proteasomal protein catabolic process | 110/2622 | 490/18723 | 2.12e-07 | 1.26e-05 | 110 |
| GO:001049816 | Endometrium | AEH | proteasomal protein catabolic process | 108/2100 | 490/18723 | 2.73e-12 | 4.67e-10 | 108 |
| GO:001049817 | Endometrium | EEC | proteasomal protein catabolic process | 112/2168 | 490/18723 | 6.99e-13 | 1.40e-10 | 112 |
| GO:0010498111 | Esophagus | ESCC | proteasomal protein catabolic process | 369/8552 | 490/18723 | 1.13e-41 | 1.80e-38 | 369 |
| GO:001049812 | Liver | Cirrhotic | proteasomal protein catabolic process | 216/4634 | 490/18723 | 2.52e-21 | 9.29e-19 | 216 |
| GO:001049822 | Liver | HCC | proteasomal protein catabolic process | 351/7958 | 490/18723 | 6.92e-40 | 1.46e-36 | 351 |
| GO:001049820 | Oral cavity | OSCC | proteasomal protein catabolic process | 336/7305 | 490/18723 | 5.45e-41 | 8.63e-38 | 336 |
| GO:0010498110 | Oral cavity | LP | proteasomal protein catabolic process | 224/4623 | 490/18723 | 9.57e-25 | 4.00e-22 | 224 |
| GO:001049818 | Prostate | BPH | proteasomal protein catabolic process | 153/3107 | 490/18723 | 4.13e-16 | 7.51e-14 | 153 |
| GO:001049819 | Prostate | Tumor | proteasomal protein catabolic process | 158/3246 | 490/18723 | 3.05e-16 | 6.76e-14 | 158 |
| GO:001049828 | Skin | cSCC | proteasomal protein catabolic process | 243/4864 | 490/18723 | 7.85e-30 | 4.10e-27 | 243 |
| GO:0010498113 | Thyroid | PTC | proteasomal protein catabolic process | 297/5968 | 490/18723 | 4.58e-40 | 9.63e-37 | 297 |
| GO:001049832 | Thyroid | ATC | proteasomal protein catabolic process | 309/6293 | 490/18723 | 1.78e-41 | 1.13e-37 | 309 |
| Page: 1 |
| Pathway ID | Tissue | Disease Stage | Description | Gene Ratio | Bg Ratio | pvalue | p.adjust | qvalue | Count |
| hsa05012 | Colorectum | AD | Parkinson disease | 147/2092 | 266/8465 | 2.53e-27 | 8.48e-25 | 5.41e-25 | 147 |
| hsa05010 | Colorectum | AD | Alzheimer disease | 174/2092 | 384/8465 | 1.82e-19 | 9.26e-18 | 5.91e-18 | 174 |
| hsa05016 | Colorectum | AD | Huntington disease | 147/2092 | 306/8465 | 1.93e-19 | 9.26e-18 | 5.91e-18 | 147 |
| hsa05020 | Colorectum | AD | Prion disease | 133/2092 | 273/8465 | 2.47e-18 | 8.29e-17 | 5.29e-17 | 133 |
| hsa05014 | Colorectum | AD | Amyotrophic lateral sclerosis | 164/2092 | 364/8465 | 4.28e-18 | 1.27e-16 | 8.09e-17 | 164 |
| hsa05022 | Colorectum | AD | Pathways of neurodegeneration - multiple diseases | 201/2092 | 476/8465 | 4.54e-18 | 1.27e-16 | 8.09e-17 | 201 |
| hsa03050 | Colorectum | AD | Proteasome | 29/2092 | 46/8465 | 3.87e-08 | 6.18e-07 | 3.94e-07 | 29 |
| hsa05017 | Colorectum | AD | Spinocerebellar ataxia | 60/2092 | 143/8465 | 3.78e-06 | 4.35e-05 | 2.78e-05 | 60 |
| hsa050121 | Colorectum | AD | Parkinson disease | 147/2092 | 266/8465 | 2.53e-27 | 8.48e-25 | 5.41e-25 | 147 |
| hsa050101 | Colorectum | AD | Alzheimer disease | 174/2092 | 384/8465 | 1.82e-19 | 9.26e-18 | 5.91e-18 | 174 |
| hsa050161 | Colorectum | AD | Huntington disease | 147/2092 | 306/8465 | 1.93e-19 | 9.26e-18 | 5.91e-18 | 147 |
| hsa050201 | Colorectum | AD | Prion disease | 133/2092 | 273/8465 | 2.47e-18 | 8.29e-17 | 5.29e-17 | 133 |
| hsa050141 | Colorectum | AD | Amyotrophic lateral sclerosis | 164/2092 | 364/8465 | 4.28e-18 | 1.27e-16 | 8.09e-17 | 164 |
| hsa050221 | Colorectum | AD | Pathways of neurodegeneration - multiple diseases | 201/2092 | 476/8465 | 4.54e-18 | 1.27e-16 | 8.09e-17 | 201 |
| hsa030501 | Colorectum | AD | Proteasome | 29/2092 | 46/8465 | 3.87e-08 | 6.18e-07 | 3.94e-07 | 29 |
| hsa050171 | Colorectum | AD | Spinocerebellar ataxia | 60/2092 | 143/8465 | 3.78e-06 | 4.35e-05 | 2.78e-05 | 60 |
| hsa050122 | Colorectum | SER | Parkinson disease | 132/1580 | 266/8465 | 2.72e-31 | 9.03e-29 | 6.55e-29 | 132 |
| hsa050202 | Colorectum | SER | Prion disease | 119/1580 | 273/8465 | 4.61e-22 | 3.06e-20 | 2.22e-20 | 119 |
| hsa050162 | Colorectum | SER | Huntington disease | 127/1580 | 306/8465 | 3.29e-21 | 1.37e-19 | 9.92e-20 | 127 |
| hsa050102 | Colorectum | SER | Alzheimer disease | 146/1580 | 384/8465 | 6.52e-20 | 2.40e-18 | 1.75e-18 | 146 |
| Page: 1 2 3 4 5 6 7 8 9 10 11 12 |
Top |
Cell-cell communication analysis |
| Identification of potential cell-cell interactions between two cell types and their ligand-receptor pairs for different disease states |
| Ligand | Receptor | LRpair | Pathway | Tissue | Disease Stage |
| Page: 1 |
Top |
Single-cell gene regulatory network inference analysis |
| Find out the significant the regulons (TFs) and the target genes of each regulon across cell types for different disease states |
| TF | Cell Type | Tissue | Disease Stage | Target Gene | RSS | Regulon Activity |
| ∗The dot plots of a searched regulon are shown for all cell subpopulations in each disease state of each tissue based on the regulon specific score inferred using pySCENIC and by calculating the average expression. |
| Page: 1 |
Top |
Somatic mutation of malignant transformation related genes |
| Annotation of somatic variants for genes involved in malignant transformation |
| Hugo Symbol | Variant Class | Variant Classification | dbSNP RS | HGVSc | HGVSp | HGVSp Short | SWISSPROT | BIOTYPE | SIFT | PolyPhen | Tumor Sample Barcode | Tissue | Histology | Sex | Age | Stage | Therapy Types | Drugs | Outcome |
| PSMB7 | SNV | Missense_Mutation | rs149845424 | c.134C>T | p.Thr45Ile | p.T45I | Q99436 | protein_coding | deleterious(0) | probably_damaging(0.999) | TCGA-A6-6654-01 | Colorectum | colon adenocarcinoma | Female | >=65 | III/IV | Chemotherapy | oxaliplatin | SD |
| PSMB7 | SNV | Missense_Mutation | novel | c.602N>T | p.Ala201Val | p.A201V | Q99436 | protein_coding | deleterious(0) | probably_damaging(0.963) | TCGA-AA-3956-01 | Colorectum | colon adenocarcinoma | Male | >=65 | I/II | Unknown | Unknown | SD |
| PSMB7 | SNV | Missense_Mutation | rs375266282 | c.370N>T | p.Arg124Trp | p.R124W | Q99436 | protein_coding | tolerated(0.08) | probably_damaging(0.949) | TCGA-AJ-A3EL-01 | Endometrium | uterine corpus endometrioid carcinoma | Female | <65 | I/II | Unknown | Unknown | SD |
| PSMB7 | SNV | Missense_Mutation | novel | c.169N>A | p.Leu57Ile | p.L57I | Q99436 | protein_coding | tolerated(0.15) | possibly_damaging(0.654) | TCGA-AP-A1DV-01 | Endometrium | uterine corpus endometrioid carcinoma | Female | <65 | I/II | Unknown | Unknown | SD |
| PSMB7 | SNV | Missense_Mutation | novel | c.260N>A | p.Cys87Tyr | p.C87Y | Q99436 | protein_coding | deleterious(0.01) | probably_damaging(0.996) | TCGA-AX-A2HD-01 | Endometrium | uterine corpus endometrioid carcinoma | Female | >=65 | III/IV | Unknown | Unknown | SD |
| PSMB7 | SNV | Missense_Mutation | novel | c.8C>A | p.Ala3Asp | p.A3D | Q99436 | protein_coding | tolerated(0.2) | benign(0.003) | TCGA-B5-A3FC-01 | Endometrium | uterine corpus endometrioid carcinoma | Female | <65 | I/II | Unknown | Unknown | SD |
| PSMB7 | SNV | Missense_Mutation | rs369427242 | c.658N>A | p.Val220Ile | p.V220I | Q99436 | protein_coding | tolerated(0.16) | benign(0.097) | TCGA-BG-A221-01 | Endometrium | uterine corpus endometrioid carcinoma | Female | >=65 | I/II | Unknown | Unknown | SD |
| PSMB7 | SNV | Missense_Mutation | rs142971341 | c.607N>A | p.Ala203Thr | p.A203T | Q99436 | protein_coding | tolerated(0.71) | benign(0.006) | TCGA-DF-A2KU-01 | Endometrium | uterine corpus endometrioid carcinoma | Female | Unknown | I/II | Unknown | Unknown | SD |
| PSMB7 | SNV | Missense_Mutation | novel | c.669N>T | p.Lys223Asn | p.K223N | Q99436 | protein_coding | tolerated(0.06) | benign(0.047) | TCGA-E6-A1LX-01 | Endometrium | uterine corpus endometrioid carcinoma | Female | <65 | I/II | Unknown | Unknown | SD |
| PSMB7 | SNV | Missense_Mutation | rs749255446 | c.812N>C | p.Val271Ala | p.V271A | Q99436 | protein_coding | deleterious(0.03) | benign(0.082) | TCGA-EC-A24G-01 | Endometrium | uterine corpus endometrioid carcinoma | Female | <65 | I/II | Chemotherapy | doxorubicin | SD |
| Page: 1 2 |
Top |
Related drugs of malignant transformation related genes |
| Identification of chemicals and drugs interact with genes involved in malignant transfromation |
| (DGIdb 4.0) |
| Entrez ID | Symbol | Category | Interaction Types | Drug Claim Name | Drug Name | PMIDs |
| 5695 | PSMB7 | DRUGGABLE GENOME, PROTEASE | inhibitor | CARFILZOMIB | CARFILZOMIB | |
| 5695 | PSMB7 | DRUGGABLE GENOME, PROTEASE | inhibitor | CHEMBL3545432 | IXAZOMIB CITRATE | |
| 5695 | PSMB7 | DRUGGABLE GENOME, PROTEASE | inhibitor | CHEMBL371405 | MARIZOMIB | |
| 5695 | PSMB7 | DRUGGABLE GENOME, PROTEASE | BORTEZOMIB | BORTEZOMIB | 24524217 | |
| 5695 | PSMB7 | DRUGGABLE GENOME, PROTEASE | inhibitor | CHEMBL2103884 | OPROZOMIB | |
| 5695 | PSMB7 | DRUGGABLE GENOME, PROTEASE | inhibitor | CHEMBL325041 | BORTEZOMIB | |
| 5695 | PSMB7 | DRUGGABLE GENOME, PROTEASE | inhibitor | BORTEZOMIB | BORTEZOMIB | |
| 5695 | PSMB7 | DRUGGABLE GENOME, PROTEASE | CARFILZOMIB | CARFILZOMIB | 24524217 | |
| 5695 | PSMB7 | DRUGGABLE GENOME, PROTEASE | inhibitor | CHEMBL451887 | CARFILZOMIB |
| Page: 1 |

Copyright 2023-Present -The University of Texas Health Science Center at Houston |