
|
|||||
|
 | |
| |
| |
| |
| |
| |
|
Gene: PSMB10 |
Gene summary for PSMB10 |
| Gene information | Species | Human | Gene symbol | PSMB10 | Gene ID | 5699 |
| Gene name | proteasome 20S subunit beta 10 | |
| Gene Alias | LMP10 | |
| Cytomap | 16q22.1 | |
| Gene Type | protein-coding | GO ID | GO:0000902 | UniProtAcc | P40306 |
Top |
Malignant transformation analysis |
| Identification of the aberrant gene expression in precancerous and cancerous lesions by comparing the gene expression of stem-like cells in diseased tissues with normal stem cells |
| Entrez ID | Symbol | Replicates | Species | Organ | Tissue | Adj P-value | Log2FC | Malignancy |
| 5699 | PSMB10 | sample1 | Human | Cervix | CC | 7.00e-16 | 7.06e-01 | 0.0959 |
| 5699 | PSMB10 | sample3 | Human | Cervix | CC | 2.61e-06 | 3.35e-01 | 0.1387 |
| 5699 | PSMB10 | T1 | Human | Cervix | CC | 1.46e-25 | 6.80e-01 | 0.0918 |
| 5699 | PSMB10 | T3 | Human | Cervix | CC | 1.48e-09 | 3.37e-01 | 0.1389 |
| 5699 | PSMB10 | LZE2T | Human | Esophagus | ESCC | 5.44e-10 | 7.35e-01 | 0.082 |
| 5699 | PSMB10 | LZE4T | Human | Esophagus | ESCC | 9.53e-29 | 6.57e-01 | 0.0811 |
| 5699 | PSMB10 | LZE5T | Human | Esophagus | ESCC | 6.95e-12 | 6.28e-01 | 0.0514 |
| 5699 | PSMB10 | LZE7T | Human | Esophagus | ESCC | 2.68e-16 | 5.76e-01 | 0.0667 |
| 5699 | PSMB10 | LZE8T | Human | Esophagus | ESCC | 2.32e-33 | 9.47e-01 | 0.067 |
| 5699 | PSMB10 | LZE20T | Human | Esophagus | ESCC | 1.35e-22 | 8.48e-01 | 0.0662 |
| 5699 | PSMB10 | LZE21D1 | Human | Esophagus | HGIN | 1.52e-08 | 7.02e-01 | 0.0632 |
| 5699 | PSMB10 | LZE22D1 | Human | Esophagus | HGIN | 1.32e-09 | 3.91e-01 | 0.0595 |
| 5699 | PSMB10 | LZE22T | Human | Esophagus | ESCC | 4.24e-14 | 7.35e-01 | 0.068 |
| 5699 | PSMB10 | LZE24D1 | Human | Esophagus | HGIN | 8.88e-07 | 1.58e+00 | 0.054 |
| 5699 | PSMB10 | LZE24T | Human | Esophagus | ESCC | 6.81e-53 | 1.74e+00 | 0.0596 |
| 5699 | PSMB10 | LZE22D3 | Human | Esophagus | HGIN | 1.28e-05 | 8.35e-01 | 0.0653 |
| 5699 | PSMB10 | LZE21T | Human | Esophagus | ESCC | 2.26e-15 | 7.90e-01 | 0.0655 |
| 5699 | PSMB10 | LZE6T | Human | Esophagus | ESCC | 4.61e-14 | 5.27e-01 | 0.0845 |
| 5699 | PSMB10 | P1T-E | Human | Esophagus | ESCC | 1.94e-26 | 9.65e-01 | 0.0875 |
| 5699 | PSMB10 | P2T-E | Human | Esophagus | ESCC | 6.31e-48 | 7.59e-01 | 0.1177 |
| Page: 1 2 3 4 5 6 7 8 |
| Tissue | Expression Dynamics | Abbreviation |
| Cervix |  | CC: Cervix cancer |
| HSIL_HPV: HPV-infected high-grade squamous intraepithelial lesions | ||
| N_HPV: HPV-infected normal cervix | ||
| Esophagus | 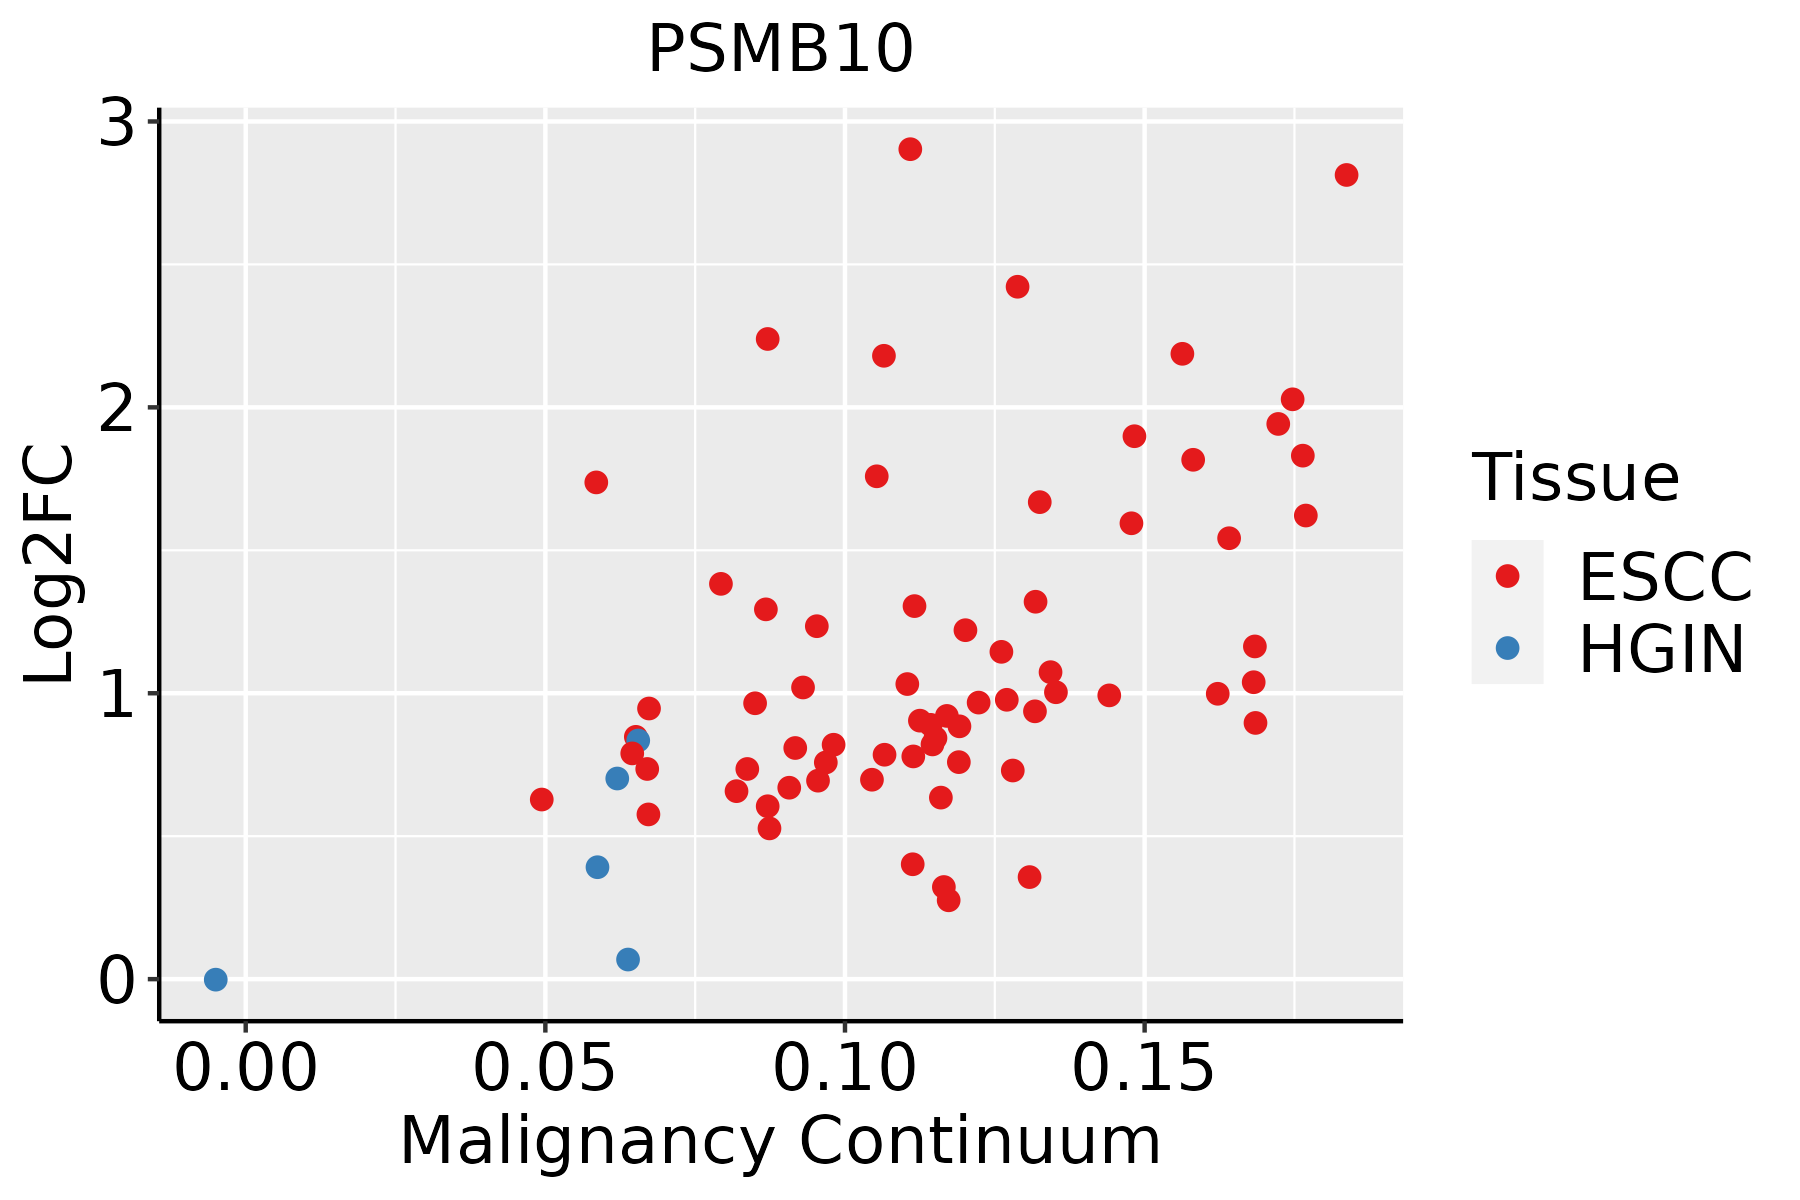 | ESCC: Esophageal squamous cell carcinoma |
| HGIN: High-grade intraepithelial neoplasias | ||
| LGIN: Low-grade intraepithelial neoplasias | ||
| GC | 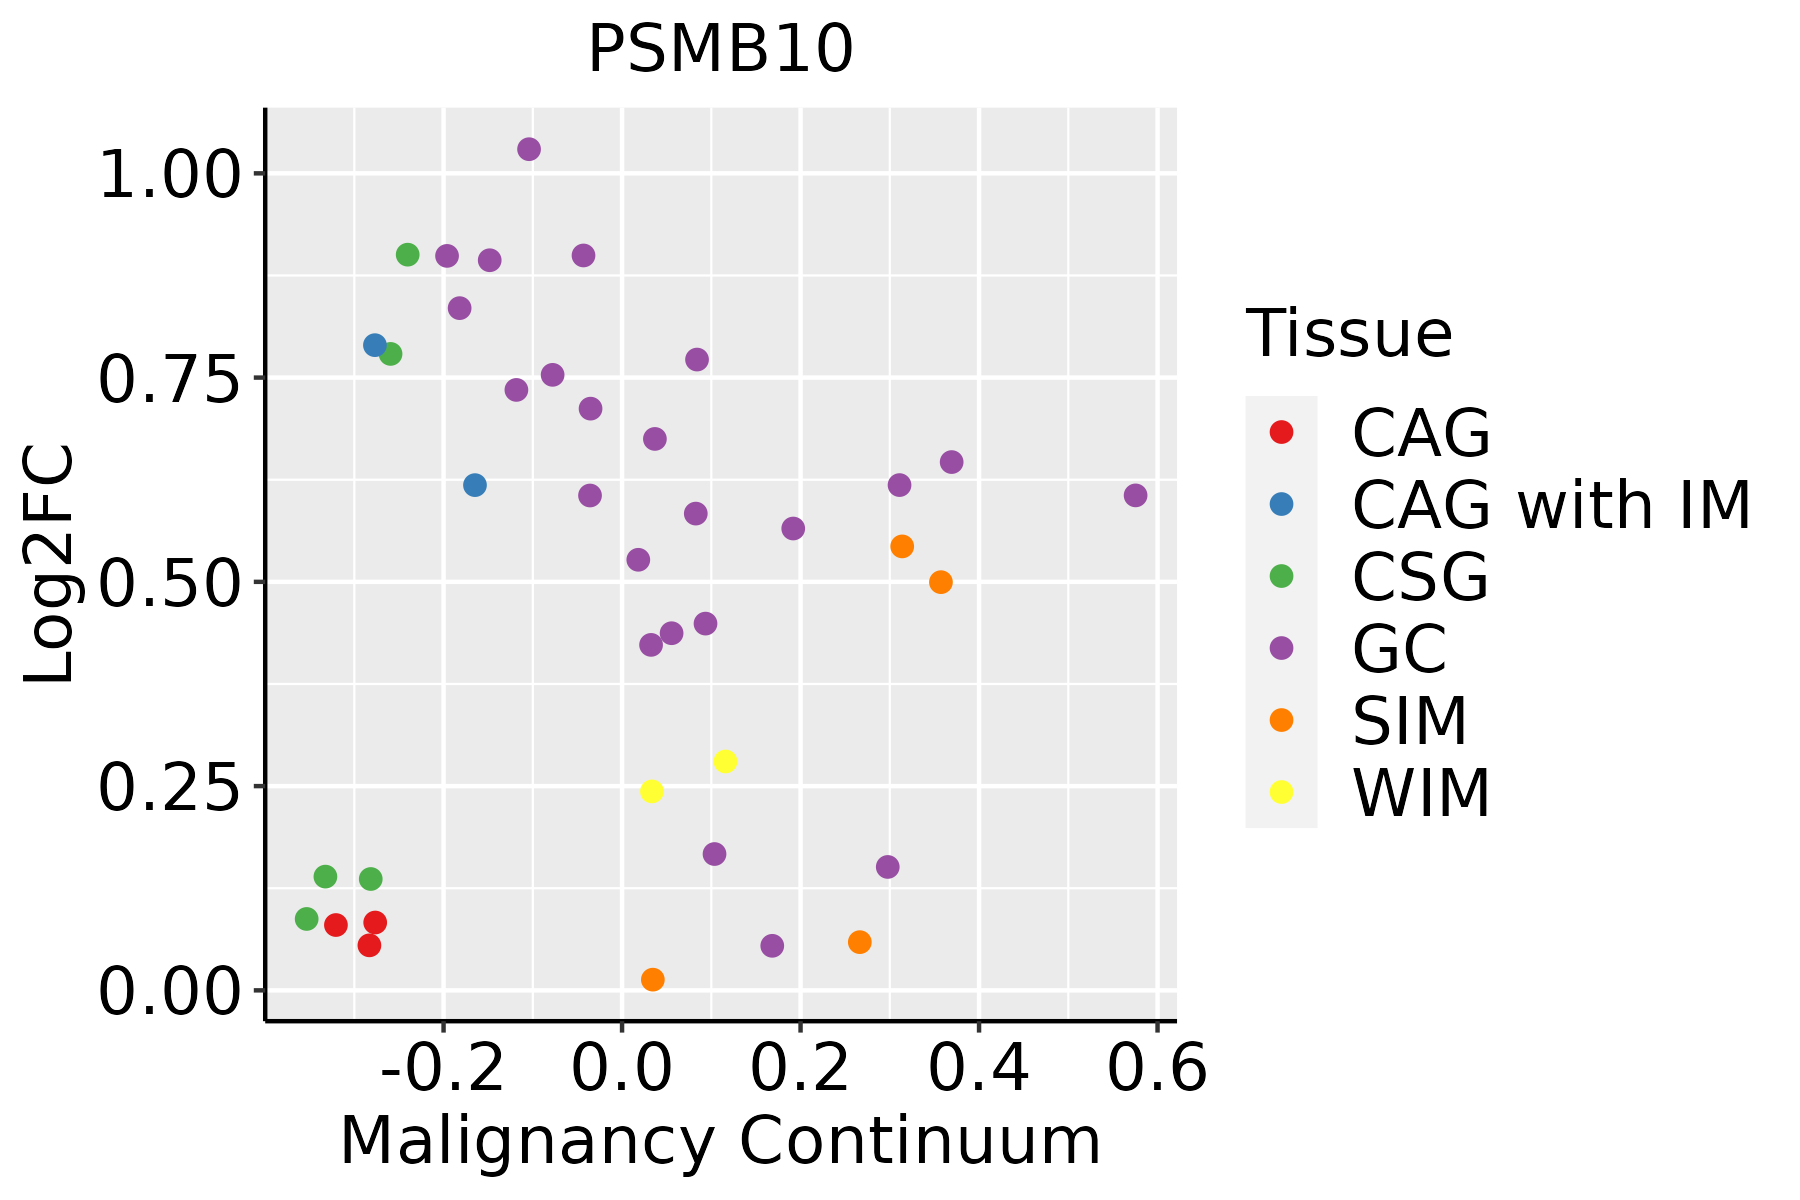 | CAG: Chronic atrophic gastritis |
| CAG with IM: Chronic atrophic gastritis with intestinal metaplasia | ||
| CSG: Chronic superficial gastritis | ||
| GC: Gastric cancer | ||
| SIM: Severe intestinal metaplasia | ||
| WIM: Wild intestinal metaplasia | ||
| Liver | 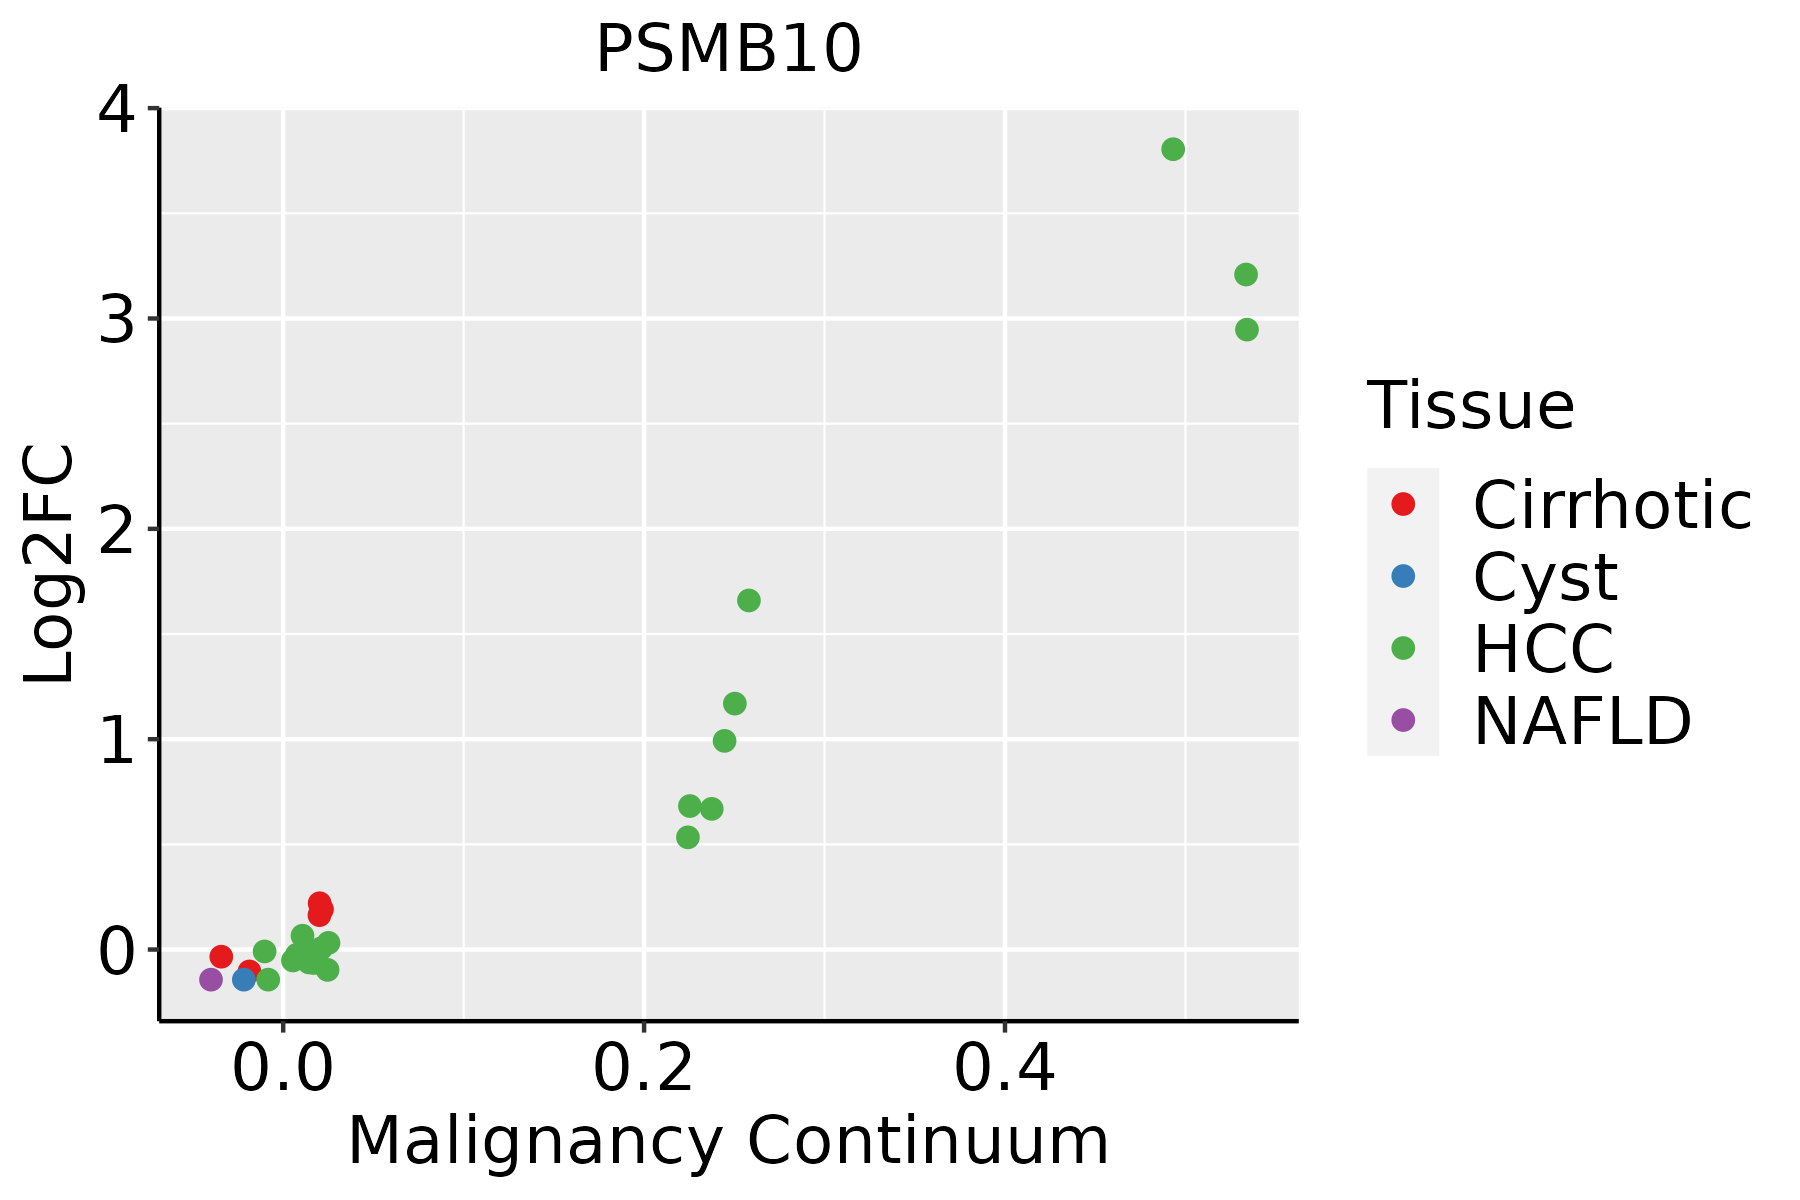 | HCC: Hepatocellular carcinoma |
| NAFLD: Non-alcoholic fatty liver disease | ||
| Oral Cavity | 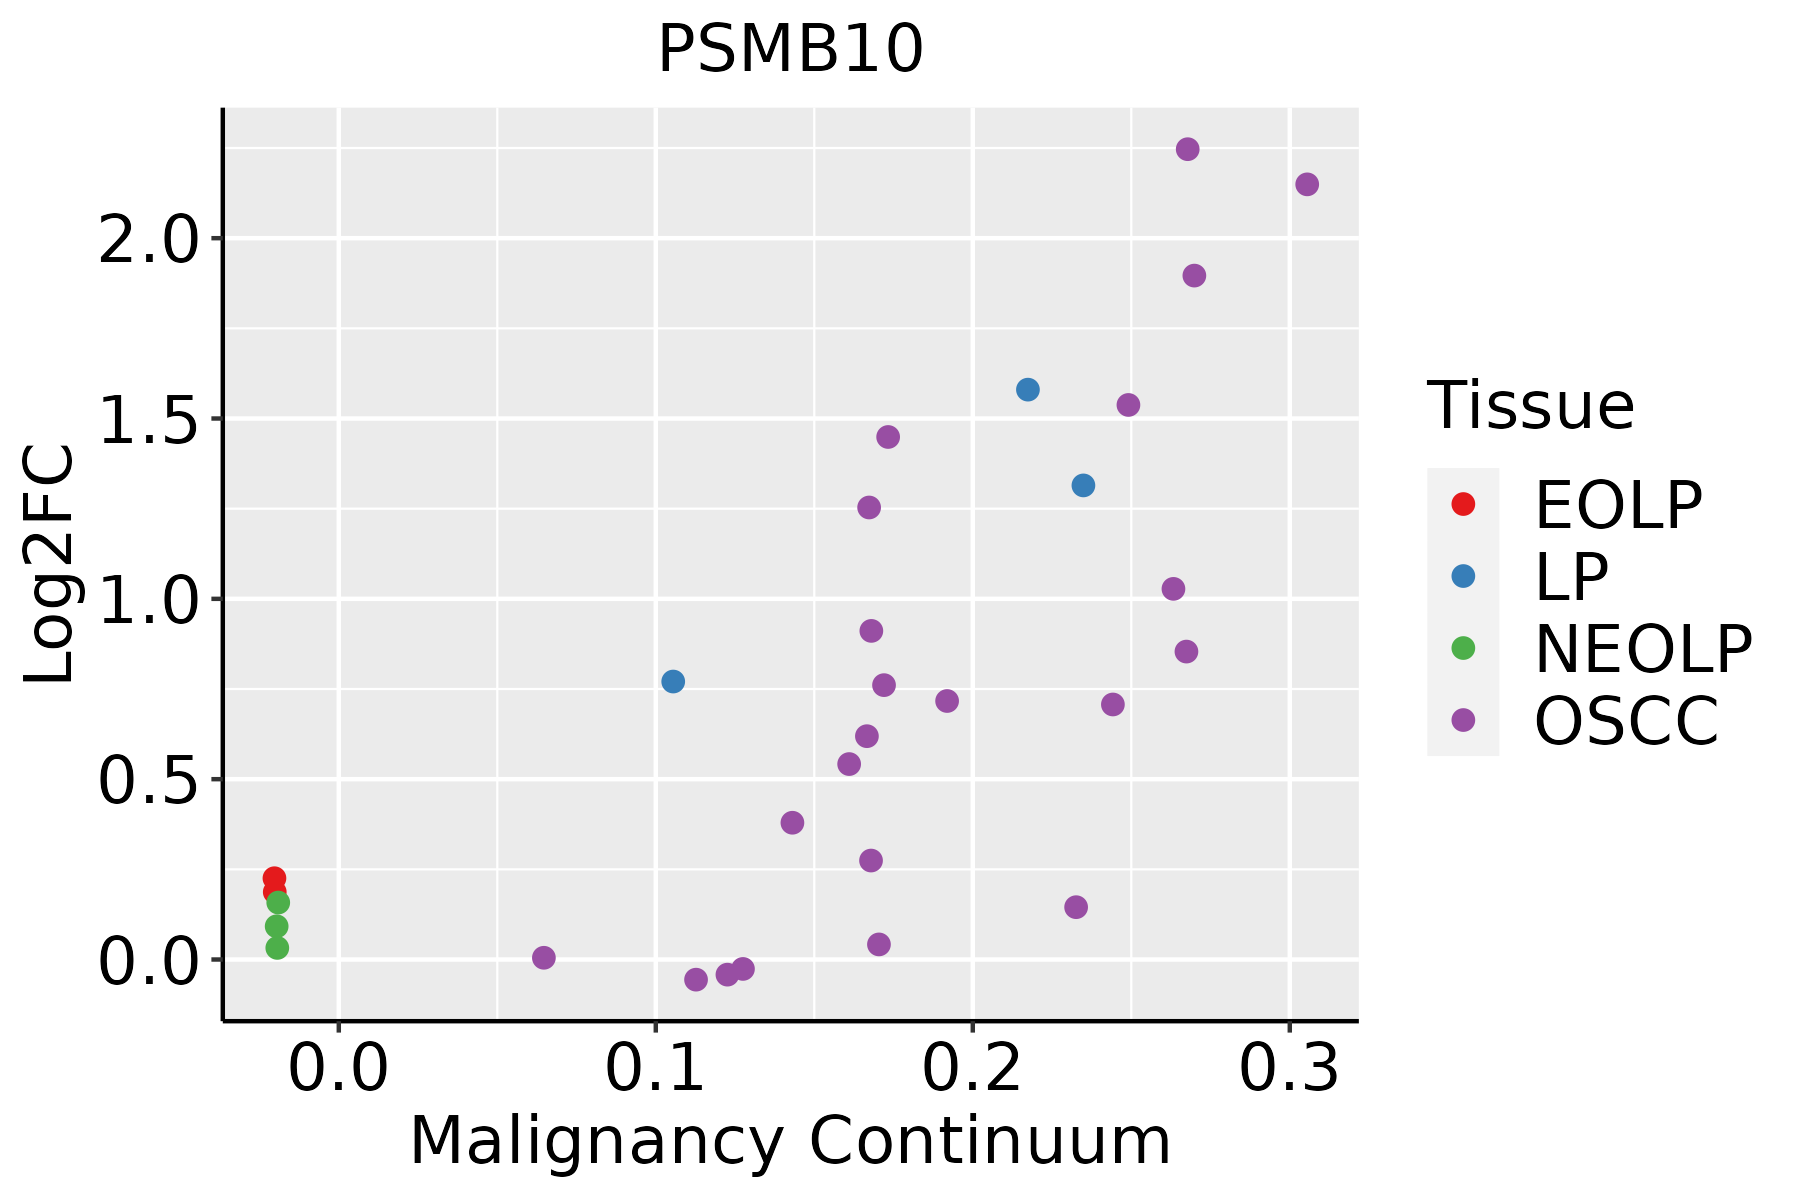 | EOLP: Erosive Oral lichen planus |
| LP: leukoplakia | ||
| NEOLP: Non-erosive oral lichen planus | ||
| OSCC: Oral squamous cell carcinoma | ||
| Skin |  | AK: Actinic keratosis |
| cSCC: Cutaneous squamous cell carcinoma | ||
| SCCIS:squamous cell carcinoma in situ | ||
| Thyroid | 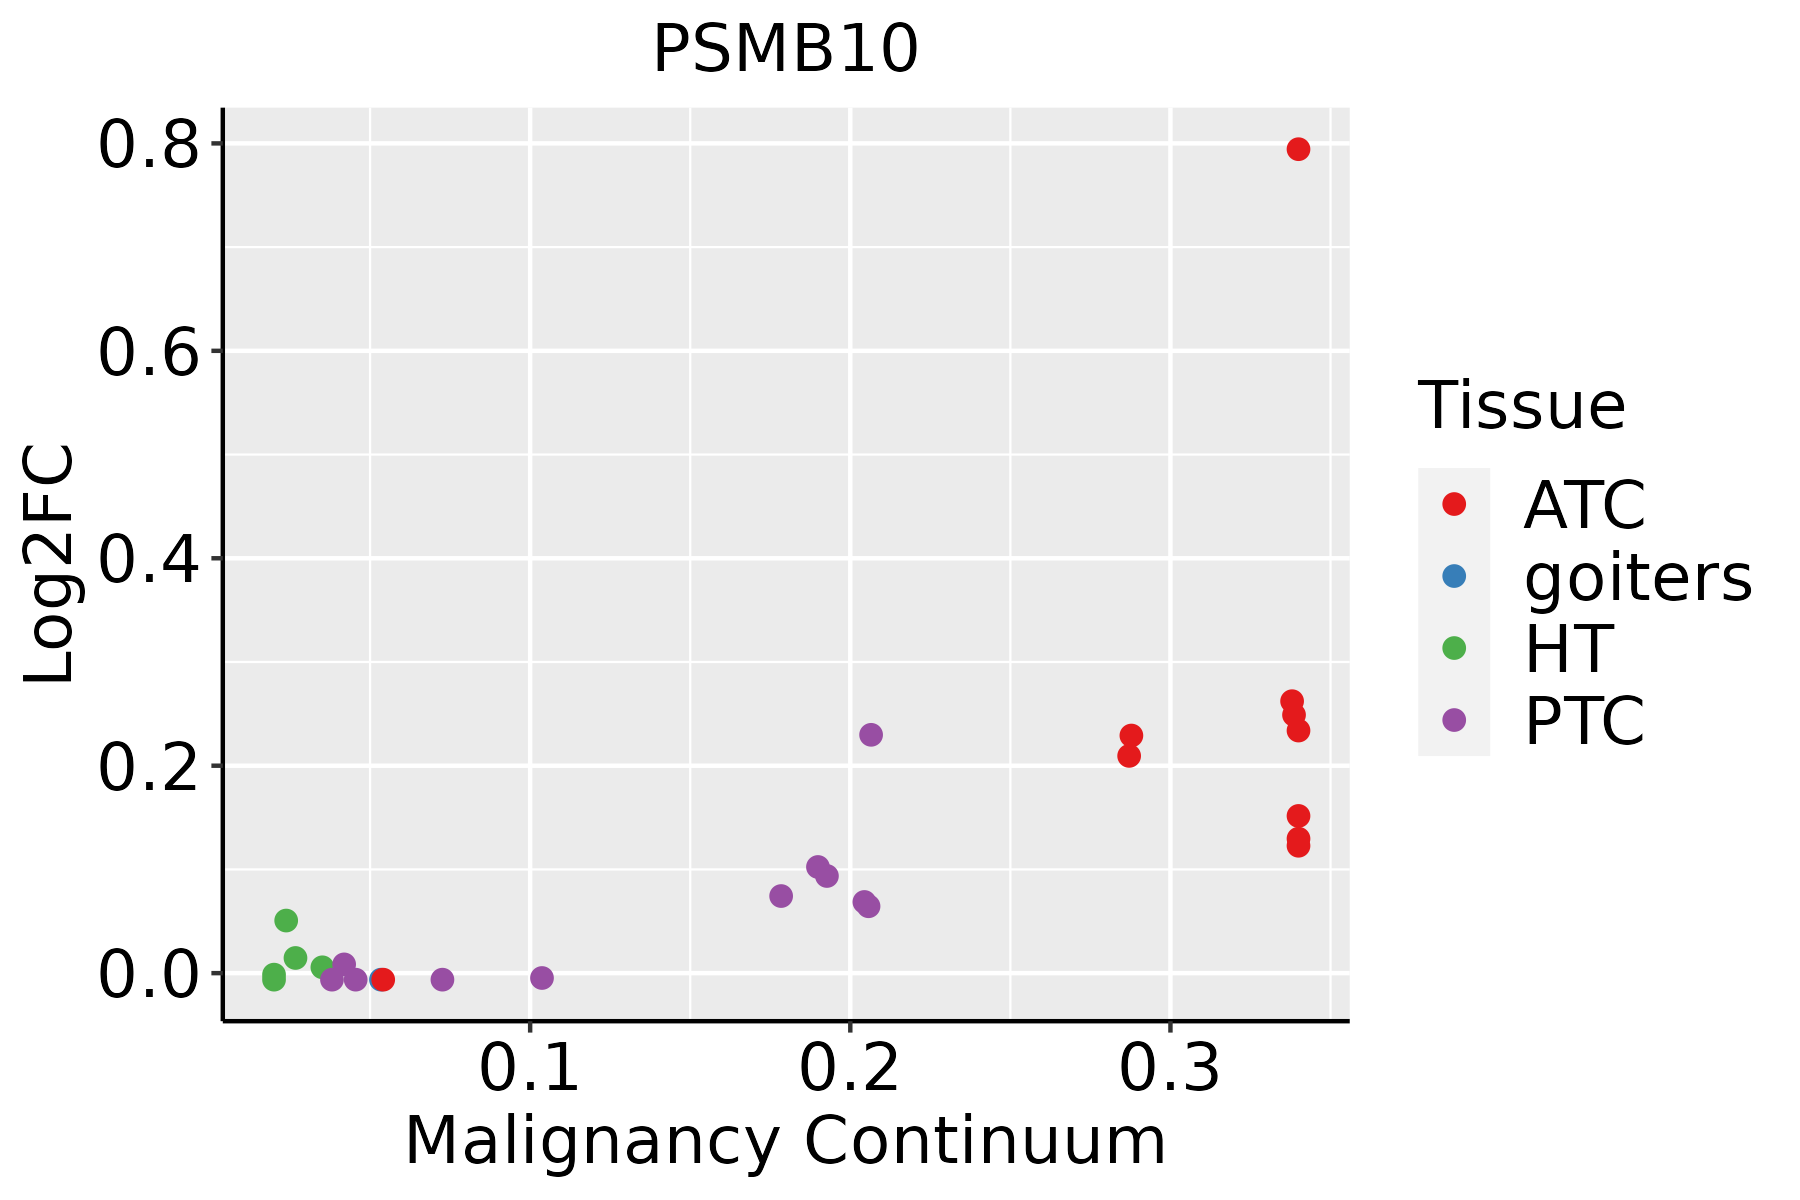 | ATC: Anaplastic thyroid cancer |
| HT: Hashimoto's thyroiditis | ||
| PTC: Papillary thyroid cancer |
| ∗log2FC in expression of this searched gene in stem-like cells from each diseased tissue sample relative to stem-like cells in normal samples in each tissue plotted against the malignancy continuum. Samples are colored based on if they are from different disease stage. |
Top |
Malignant transformation related pathway analysis |
| Find out the enriched GO biological processes and KEGG pathways involved in transition from healthy to precancer to cancer |
| Tissue | Disease Stage | Enriched GO biological Processes |
| Colorectum | AD |  |
| Colorectum | SER |  |
| Colorectum | MSS |  |
| Colorectum | MSI-H |  |
| Colorectum | FAP |  |
| ∗Top 15 enriched GO BP terms are showed in the bar plot of each disease state in each tissue. Each row represents a significant GO biological process which is colored according to the -log10(p.adjust). |
| Page: 1 2 3 4 5 6 7 8 9 |
| GO ID | Tissue | Disease Stage | Description | Gene Ratio | Bg Ratio | pvalue | p.adjust | Count |
| GO:001049810 | Cervix | CC | proteasomal protein catabolic process | 111/2311 | 490/18723 | 8.98e-11 | 1.58e-08 | 111 |
| GO:00421108 | Cervix | CC | T cell activation | 107/2311 | 487/18723 | 1.24e-09 | 1.46e-07 | 107 |
| GO:00420988 | Cervix | CC | T cell proliferation | 49/2311 | 199/18723 | 1.32e-06 | 4.49e-05 | 49 |
| GO:00706617 | Cervix | CC | leukocyte proliferation | 65/2311 | 318/18723 | 2.56e-05 | 4.32e-04 | 65 |
| GO:00466516 | Cervix | CC | lymphocyte proliferation | 59/2311 | 288/18723 | 5.53e-05 | 8.10e-04 | 59 |
| GO:00329435 | Cervix | CC | mononuclear cell proliferation | 59/2311 | 291/18723 | 7.51e-05 | 1.03e-03 | 59 |
| GO:00069597 | Cervix | CC | humoral immune response | 54/2311 | 317/18723 | 8.57e-03 | 4.42e-02 | 54 |
| GO:001049826 | Esophagus | HGIN | proteasomal protein catabolic process | 139/2587 | 490/18723 | 1.20e-17 | 3.41e-15 | 139 |
| GO:0010498111 | Esophagus | ESCC | proteasomal protein catabolic process | 369/8552 | 490/18723 | 1.13e-41 | 1.80e-38 | 369 |
| GO:004211018 | Esophagus | ESCC | T cell activation | 256/8552 | 487/18723 | 1.18e-03 | 5.87e-03 | 256 |
| GO:001049812 | Liver | Cirrhotic | proteasomal protein catabolic process | 216/4634 | 490/18723 | 2.52e-21 | 9.29e-19 | 216 |
| GO:001049822 | Liver | HCC | proteasomal protein catabolic process | 351/7958 | 490/18723 | 6.92e-40 | 1.46e-36 | 351 |
| GO:001049820 | Oral cavity | OSCC | proteasomal protein catabolic process | 336/7305 | 490/18723 | 5.45e-41 | 8.63e-38 | 336 |
| GO:004211016 | Oral cavity | OSCC | T cell activation | 245/7305 | 487/18723 | 2.00e-07 | 3.22e-06 | 245 |
| GO:004209816 | Oral cavity | OSCC | T cell proliferation | 100/7305 | 199/18723 | 7.93e-04 | 4.27e-03 | 100 |
| GO:00706618 | Oral cavity | OSCC | leukocyte proliferation | 145/7305 | 318/18723 | 9.31e-03 | 3.33e-02 | 145 |
| GO:00466517 | Oral cavity | OSCC | lymphocyte proliferation | 131/7305 | 288/18723 | 1.41e-02 | 4.67e-02 | 131 |
| GO:0010498110 | Oral cavity | LP | proteasomal protein catabolic process | 224/4623 | 490/18723 | 9.57e-25 | 4.00e-22 | 224 |
| GO:004211017 | Oral cavity | LP | T cell activation | 146/4623 | 487/18723 | 4.13e-03 | 2.66e-02 | 146 |
| GO:004211023 | Oral cavity | EOLP | T cell activation | 111/2218 | 487/18723 | 4.67e-12 | 8.17e-10 | 111 |
| Page: 1 2 3 |
| Pathway ID | Tissue | Disease Stage | Description | Gene Ratio | Bg Ratio | pvalue | p.adjust | qvalue | Count |
| hsa0305027 | Esophagus | HGIN | Proteasome | 34/1383 | 46/8465 | 6.45e-18 | 1.91e-16 | 1.52e-16 | 34 |
| hsa03050111 | Esophagus | HGIN | Proteasome | 34/1383 | 46/8465 | 6.45e-18 | 1.91e-16 | 1.52e-16 | 34 |
| hsa0305028 | Esophagus | ESCC | Proteasome | 44/4205 | 46/8465 | 1.05e-11 | 1.60e-10 | 8.21e-11 | 44 |
| hsa0305037 | Esophagus | ESCC | Proteasome | 44/4205 | 46/8465 | 1.05e-11 | 1.60e-10 | 8.21e-11 | 44 |
| hsa030509 | Liver | Cirrhotic | Proteasome | 41/2530 | 46/8465 | 6.22e-17 | 2.30e-15 | 1.42e-15 | 41 |
| hsa0305012 | Liver | Cirrhotic | Proteasome | 41/2530 | 46/8465 | 6.22e-17 | 2.30e-15 | 1.42e-15 | 41 |
| hsa0305022 | Liver | HCC | Proteasome | 43/4020 | 46/8465 | 2.62e-11 | 4.61e-10 | 2.56e-10 | 43 |
| hsa0305032 | Liver | HCC | Proteasome | 43/4020 | 46/8465 | 2.62e-11 | 4.61e-10 | 2.56e-10 | 43 |
| hsa0305020 | Oral cavity | OSCC | Proteasome | 42/3704 | 46/8465 | 1.32e-11 | 2.01e-10 | 1.02e-10 | 42 |
| hsa03050110 | Oral cavity | OSCC | Proteasome | 42/3704 | 46/8465 | 1.32e-11 | 2.01e-10 | 1.02e-10 | 42 |
| hsa0305026 | Oral cavity | LP | Proteasome | 41/2418 | 46/8465 | 1.05e-17 | 3.17e-16 | 2.05e-16 | 41 |
| hsa0305036 | Oral cavity | LP | Proteasome | 41/2418 | 46/8465 | 1.05e-17 | 3.17e-16 | 2.05e-16 | 41 |
| hsa0305043 | Oral cavity | NEOLP | Proteasome | 12/1112 | 46/8465 | 1.35e-02 | 4.32e-02 | 2.72e-02 | 12 |
| hsa0305053 | Oral cavity | NEOLP | Proteasome | 12/1112 | 46/8465 | 1.35e-02 | 4.32e-02 | 2.72e-02 | 12 |
| hsa030508 | Stomach | GC | Proteasome | 11/708 | 46/8465 | 1.14e-03 | 7.72e-03 | 5.43e-03 | 11 |
| hsa0305011 | Stomach | GC | Proteasome | 11/708 | 46/8465 | 1.14e-03 | 7.72e-03 | 5.43e-03 | 11 |
| hsa0305021 | Stomach | CAG with IM | Proteasome | 11/640 | 46/8465 | 4.89e-04 | 4.21e-03 | 2.95e-03 | 11 |
| hsa0305031 | Stomach | CAG with IM | Proteasome | 11/640 | 46/8465 | 4.89e-04 | 4.21e-03 | 2.95e-03 | 11 |
| hsa0305041 | Stomach | CSG | Proteasome | 11/633 | 46/8465 | 4.45e-04 | 3.70e-03 | 2.67e-03 | 11 |
| hsa0305051 | Stomach | CSG | Proteasome | 11/633 | 46/8465 | 4.45e-04 | 3.70e-03 | 2.67e-03 | 11 |
| Page: 1 |
Top |
Cell-cell communication analysis |
| Identification of potential cell-cell interactions between two cell types and their ligand-receptor pairs for different disease states |
| Ligand | Receptor | LRpair | Pathway | Tissue | Disease Stage |
| Page: 1 |
Top |
Single-cell gene regulatory network inference analysis |
| Find out the significant the regulons (TFs) and the target genes of each regulon across cell types for different disease states |
| TF | Cell Type | Tissue | Disease Stage | Target Gene | RSS | Regulon Activity |
| ∗The dot plots of a searched regulon are shown for all cell subpopulations in each disease state of each tissue based on the regulon specific score inferred using pySCENIC and by calculating the average expression. |
| Page: 1 |
Top |
Somatic mutation of malignant transformation related genes |
| Annotation of somatic variants for genes involved in malignant transformation |
| Hugo Symbol | Variant Class | Variant Classification | dbSNP RS | HGVSc | HGVSp | HGVSp Short | SWISSPROT | BIOTYPE | SIFT | PolyPhen | Tumor Sample Barcode | Tissue | Histology | Sex | Age | Stage | Therapy Types | Drugs | Outcome |
| PSMB10 | insertion | Nonsense_Mutation | novel | c.745_746insTATGACCGATCATCAAACGCAGAGCCCTTGCAGGTTCTGTCCGT | p.Ala249ValfsTer2 | p.A249Vfs*2 | P40306 | protein_coding | TCGA-A8-A09C-01 | Breast | breast invasive carcinoma | Female | >=65 | I/II | Unknown | Unknown | SD | ||
| PSMB10 | SNV | Missense_Mutation | rs202238433 | c.334G>A | p.Glu112Lys | p.E112K | P40306 | protein_coding | tolerated(0.85) | benign(0.03) | TCGA-Q1-A73O-01 | Cervix | cervical & endocervical cancer | Female | <65 | I/II | Chemotherapy | cisplatin | CR |
| PSMB10 | SNV | Missense_Mutation | c.45G>C | p.Glu15Asp | p.E15D | P40306 | protein_coding | tolerated(0.94) | benign(0.003) | TCGA-Q1-A73O-01 | Cervix | cervical & endocervical cancer | Female | <65 | I/II | Chemotherapy | cisplatin | CR | |
| PSMB10 | SNV | Missense_Mutation | c.45N>T | p.Glu15Asp | p.E15D | P40306 | protein_coding | tolerated(0.94) | benign(0.003) | TCGA-F5-6814-01 | Colorectum | rectum adenocarcinoma | Male | <65 | I/II | Unknown | Unknown | SD | |
| PSMB10 | SNV | Missense_Mutation | novel | c.362N>G | p.Ile121Ser | p.I121S | P40306 | protein_coding | deleterious(0) | benign(0.08) | TCGA-A5-A1OF-01 | Endometrium | uterine corpus endometrioid carcinoma | Female | <65 | I/II | Unknown | Unknown | SD |
| PSMB10 | SNV | Missense_Mutation | rs372222842 | c.719G>A | p.Arg240His | p.R240H | P40306 | protein_coding | tolerated(0.17) | benign(0.003) | TCGA-AP-A051-01 | Endometrium | uterine corpus endometrioid carcinoma | Female | >=65 | I/II | Unknown | Unknown | SD |
| PSMB10 | SNV | Missense_Mutation | novel | c.233C>T | p.Pro78Leu | p.P78L | P40306 | protein_coding | deleterious(0) | probably_damaging(0.99) | TCGA-AP-A1DK-01 | Endometrium | uterine corpus endometrioid carcinoma | Female | <65 | I/II | Unknown | Unknown | SD |
| PSMB10 | SNV | Missense_Mutation | rs372222842 | c.719N>A | p.Arg240His | p.R240H | P40306 | protein_coding | tolerated(0.17) | benign(0.003) | TCGA-AP-A1DP-01 | Endometrium | uterine corpus endometrioid carcinoma | Female | >=65 | I/II | Chemotherapy | paclitaxel | PD |
| PSMB10 | SNV | Missense_Mutation | c.157C>A | p.Leu53Met | p.L53M | P40306 | protein_coding | deleterious(0.01) | probably_damaging(0.995) | TCGA-BS-A0UV-01 | Endometrium | uterine corpus endometrioid carcinoma | Female | <65 | III/IV | Unknown | Unknown | SD | |
| PSMB10 | SNV | Missense_Mutation | c.45N>T | p.Glu15Asp | p.E15D | P40306 | protein_coding | tolerated(0.94) | benign(0.003) | TCGA-E6-A1LX-01 | Endometrium | uterine corpus endometrioid carcinoma | Female | <65 | I/II | Unknown | Unknown | SD |
| Page: 1 2 |
Top |
Related drugs of malignant transformation related genes |
| Identification of chemicals and drugs interact with genes involved in malignant transfromation |
| (DGIdb 4.0) |
| Entrez ID | Symbol | Category | Interaction Types | Drug Claim Name | Drug Name | PMIDs |
| 5699 | PSMB10 | PROTEASE, DRUGGABLE GENOME | inhibitor | BORTEZOMIB | BORTEZOMIB | |
| 5699 | PSMB10 | PROTEASE, DRUGGABLE GENOME | inhibitor | CHEMBL2103884 | OPROZOMIB | |
| 5699 | PSMB10 | PROTEASE, DRUGGABLE GENOME | inhibitor | CHEMBL3545432 | IXAZOMIB CITRATE | |
| 5699 | PSMB10 | PROTEASE, DRUGGABLE GENOME | inhibitor | CARFILZOMIB | CARFILZOMIB | |
| 5699 | PSMB10 | PROTEASE, DRUGGABLE GENOME | BORTEZOMIB | BORTEZOMIB | 24524217 | |
| 5699 | PSMB10 | PROTEASE, DRUGGABLE GENOME | inhibitor | CHEMBL325041 | BORTEZOMIB | |
| 5699 | PSMB10 | PROTEASE, DRUGGABLE GENOME | inhibitor | CHEMBL371405 | MARIZOMIB | |
| 5699 | PSMB10 | PROTEASE, DRUGGABLE GENOME | inhibitor | CHEMBL451887 | CARFILZOMIB | |
| 5699 | PSMB10 | PROTEASE, DRUGGABLE GENOME | CARFILZOMIB | CARFILZOMIB | 24524217 |
| Page: 1 |

Copyright 2023-Present -The University of Texas Health Science Center at Houston |