
|
|||||
|
 | |
| |
| |
| |
| |
| |
|
Gene: PSMA6 |
Gene summary for PSMA6 |
| Gene information | Species | Human | Gene symbol | PSMA6 | Gene ID | 5687 |
| Gene name | proteasome 20S subunit alpha 6 | |
| Gene Alias | IOTA | |
| Cytomap | 14q13.2 | |
| Gene Type | protein-coding | GO ID | GO:0006139 | UniProtAcc | P60900 |
Top |
Malignant transformation analysis |
| Identification of the aberrant gene expression in precancerous and cancerous lesions by comparing the gene expression of stem-like cells in diseased tissues with normal stem cells |
| Entrez ID | Symbol | Replicates | Species | Organ | Tissue | Adj P-value | Log2FC | Malignancy |
| 5687 | PSMA6 | sample1 | Human | Cervix | CC | 2.89e-10 | 5.91e-01 | 0.0959 |
| 5687 | PSMA6 | sample3 | Human | Cervix | CC | 1.40e-82 | 1.03e+00 | 0.1387 |
| 5687 | PSMA6 | H2 | Human | Cervix | HSIL_HPV | 3.68e-13 | 4.52e-01 | 0.0632 |
| 5687 | PSMA6 | T1 | Human | Cervix | CC | 4.16e-17 | 5.04e-01 | 0.0918 |
| 5687 | PSMA6 | T3 | Human | Cervix | CC | 2.20e-75 | 1.04e+00 | 0.1389 |
| 5687 | PSMA6 | LZE2D | Human | Esophagus | HGIN | 2.90e-10 | 8.43e-01 | 0.0642 |
| 5687 | PSMA6 | LZE2T | Human | Esophagus | ESCC | 3.55e-16 | 1.73e+00 | 0.082 |
| 5687 | PSMA6 | LZE3D | Human | Esophagus | HGIN | 6.21e-05 | 1.07e+00 | 0.0668 |
| 5687 | PSMA6 | LZE4T | Human | Esophagus | ESCC | 4.00e-56 | 1.85e+00 | 0.0811 |
| 5687 | PSMA6 | LZE5T | Human | Esophagus | ESCC | 3.00e-33 | 2.09e+00 | 0.0514 |
| 5687 | PSMA6 | LZE7T | Human | Esophagus | ESCC | 3.06e-37 | 1.47e+00 | 0.0667 |
| 5687 | PSMA6 | LZE8T | Human | Esophagus | ESCC | 3.39e-38 | 1.29e+00 | 0.067 |
| 5687 | PSMA6 | LZE20T | Human | Esophagus | ESCC | 2.58e-39 | 1.31e+00 | 0.0662 |
| 5687 | PSMA6 | LZE21D1 | Human | Esophagus | HGIN | 3.53e-05 | 7.97e-01 | 0.0632 |
| 5687 | PSMA6 | LZE22D1 | Human | Esophagus | HGIN | 3.37e-23 | 7.49e-01 | 0.0595 |
| 5687 | PSMA6 | LZE22T | Human | Esophagus | ESCC | 2.40e-30 | 2.05e+00 | 0.068 |
| 5687 | PSMA6 | LZE24D1 | Human | Esophagus | HGIN | 3.66e-03 | 1.13e+00 | 0.054 |
| 5687 | PSMA6 | LZE24T | Human | Esophagus | ESCC | 7.89e-71 | 1.95e+00 | 0.0596 |
| 5687 | PSMA6 | LZE22D3 | Human | Esophagus | HGIN | 3.01e-07 | 1.14e+00 | 0.0653 |
| 5687 | PSMA6 | LZE21T | Human | Esophagus | ESCC | 4.10e-31 | 2.06e+00 | 0.0655 |
| Page: 1 2 3 4 5 6 7 8 9 |
| Tissue | Expression Dynamics | Abbreviation |
| Cervix | 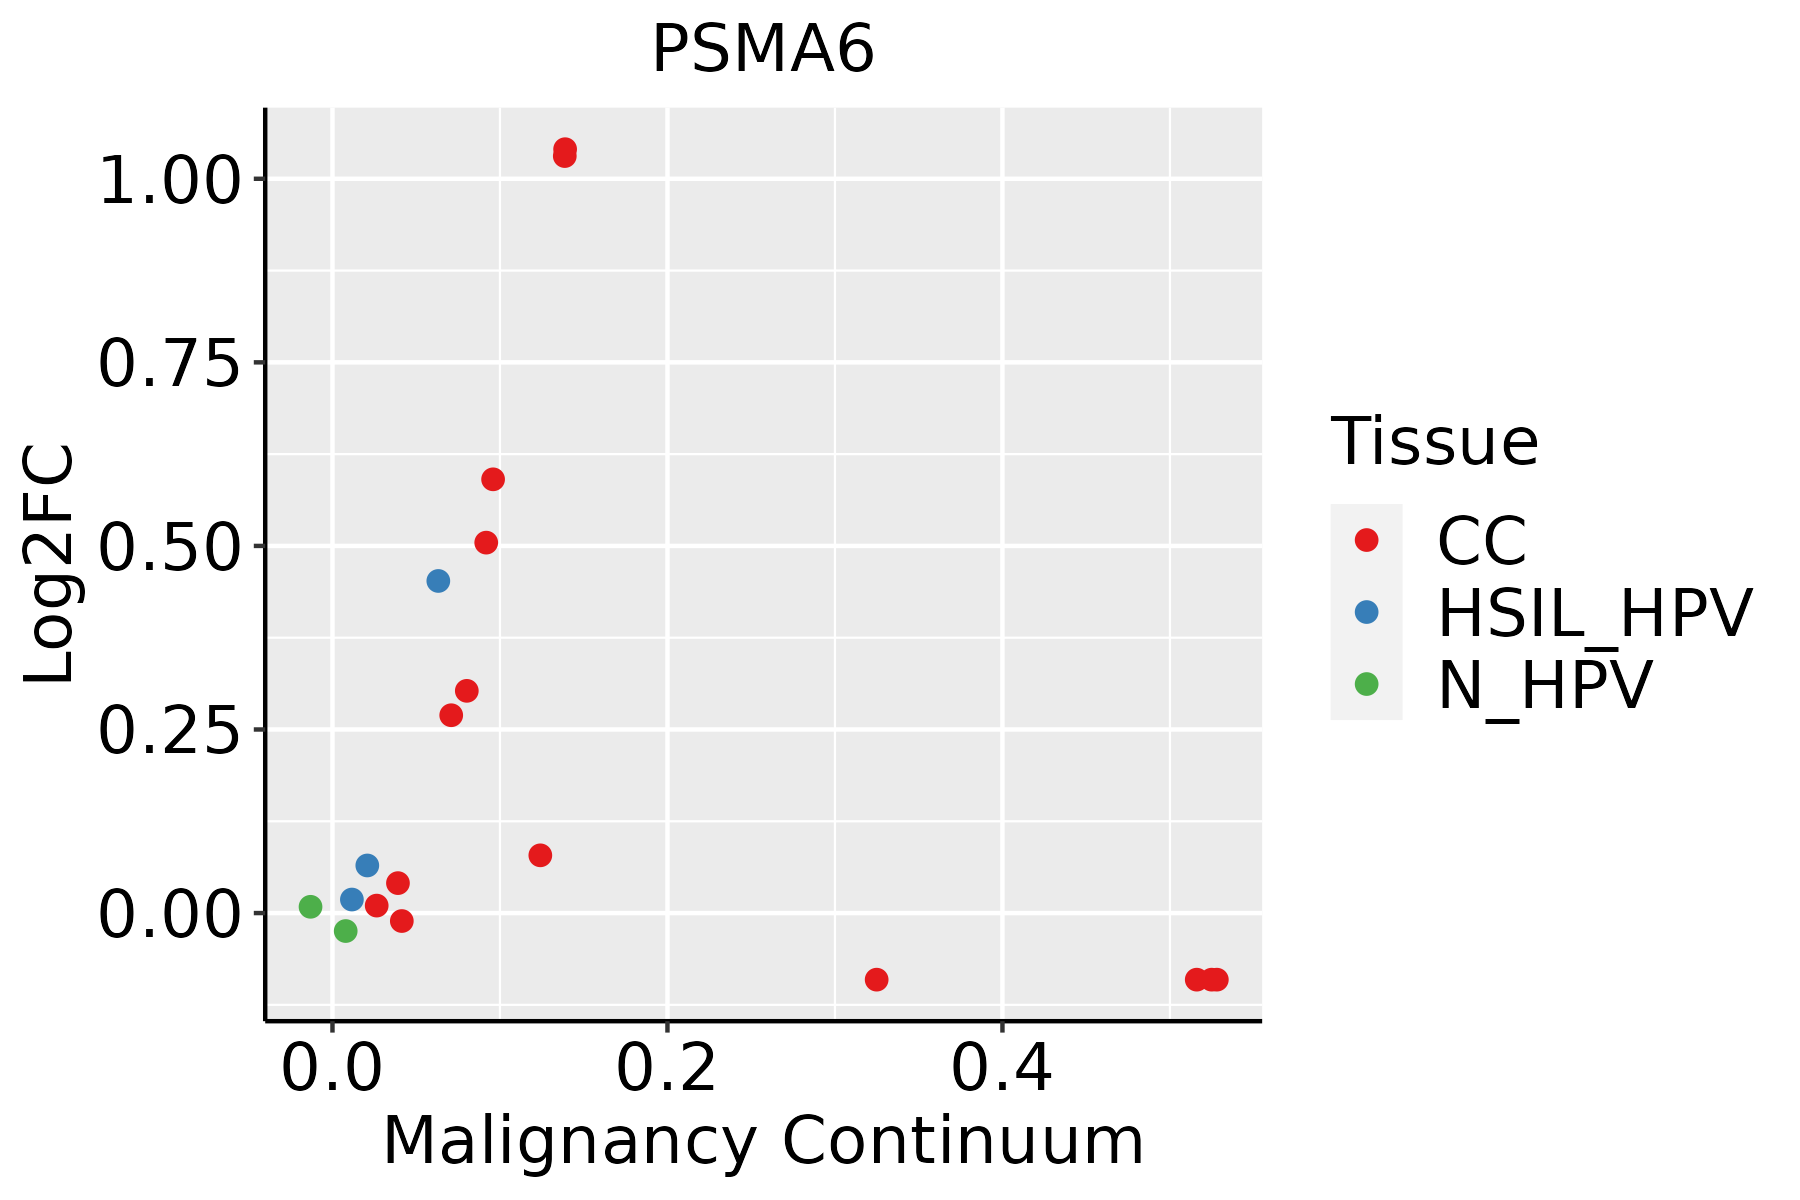 | CC: Cervix cancer |
| HSIL_HPV: HPV-infected high-grade squamous intraepithelial lesions | ||
| N_HPV: HPV-infected normal cervix | ||
| Esophagus | 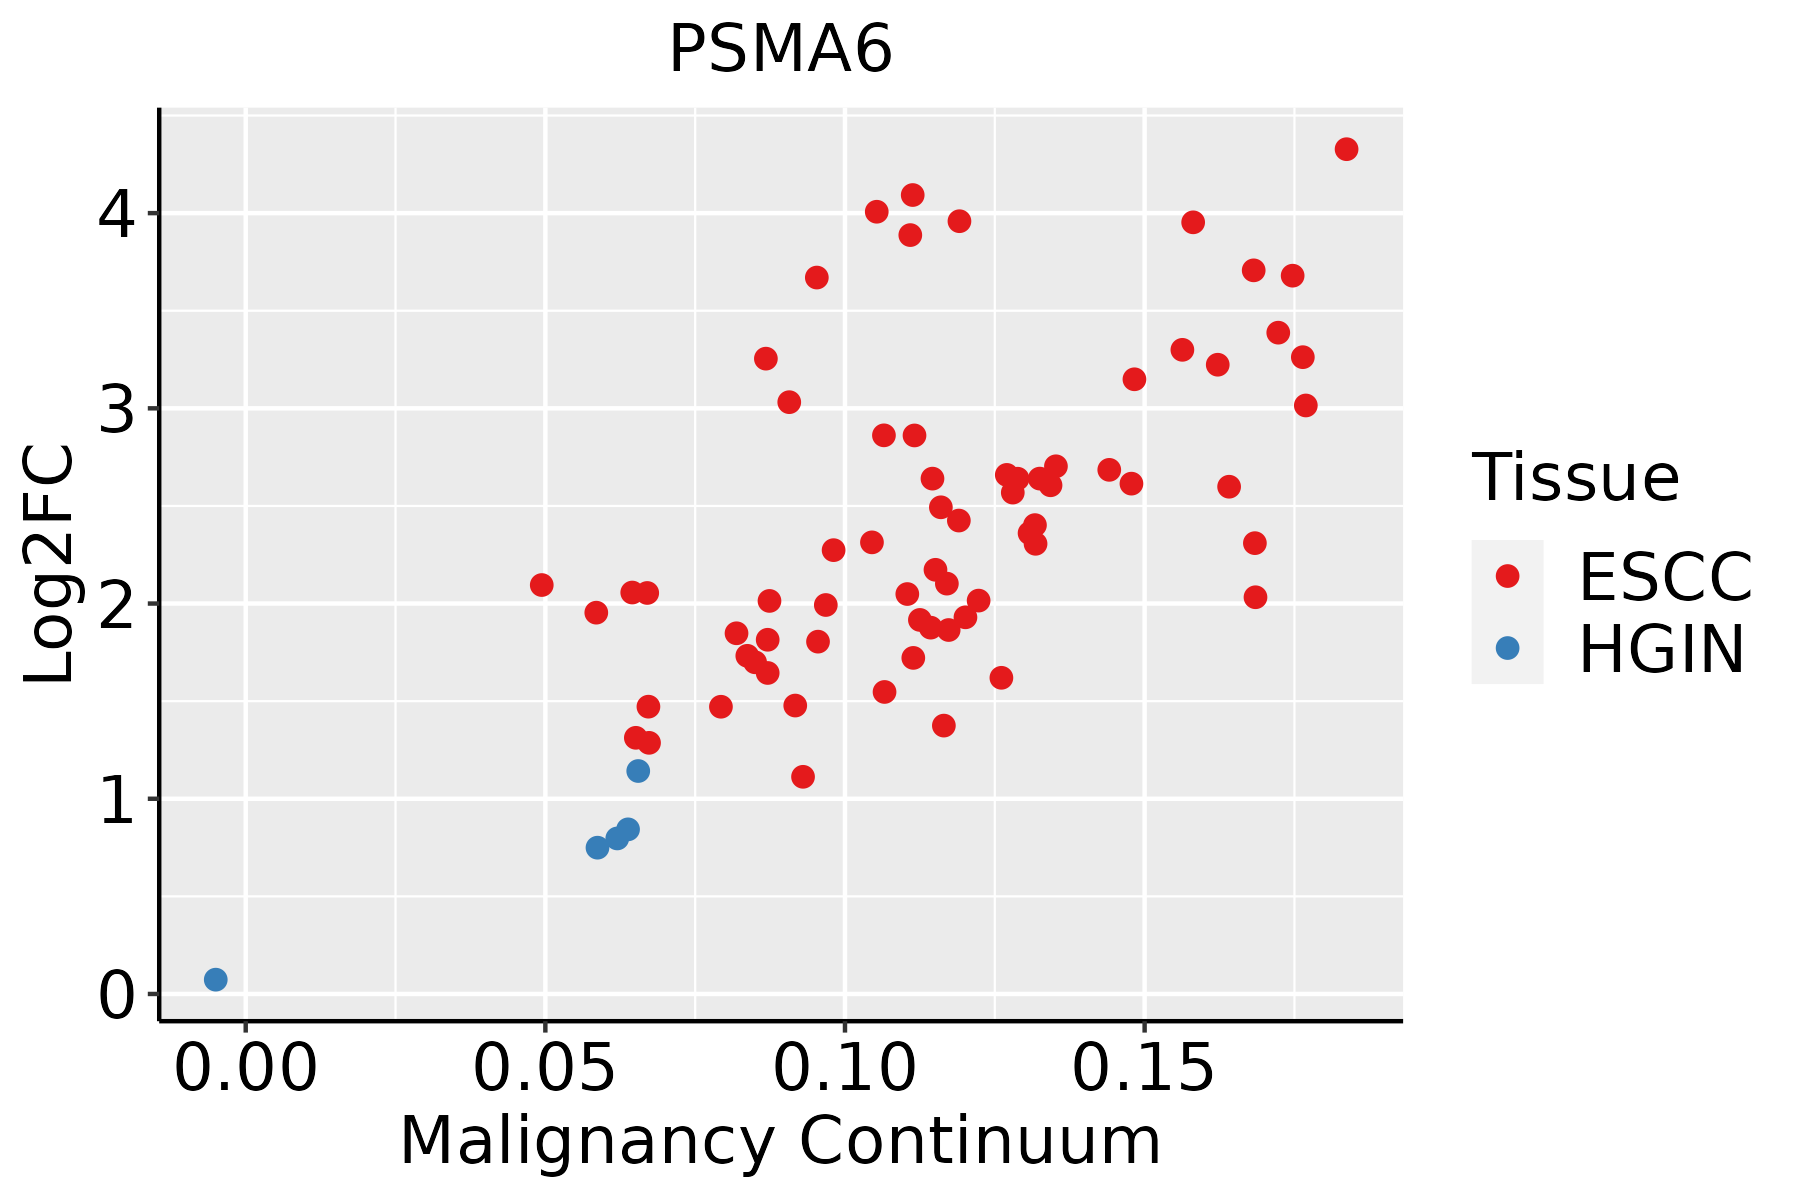 | ESCC: Esophageal squamous cell carcinoma |
| HGIN: High-grade intraepithelial neoplasias | ||
| LGIN: Low-grade intraepithelial neoplasias | ||
| GC |  | CAG: Chronic atrophic gastritis |
| CAG with IM: Chronic atrophic gastritis with intestinal metaplasia | ||
| CSG: Chronic superficial gastritis | ||
| GC: Gastric cancer | ||
| SIM: Severe intestinal metaplasia | ||
| WIM: Wild intestinal metaplasia | ||
| Liver | 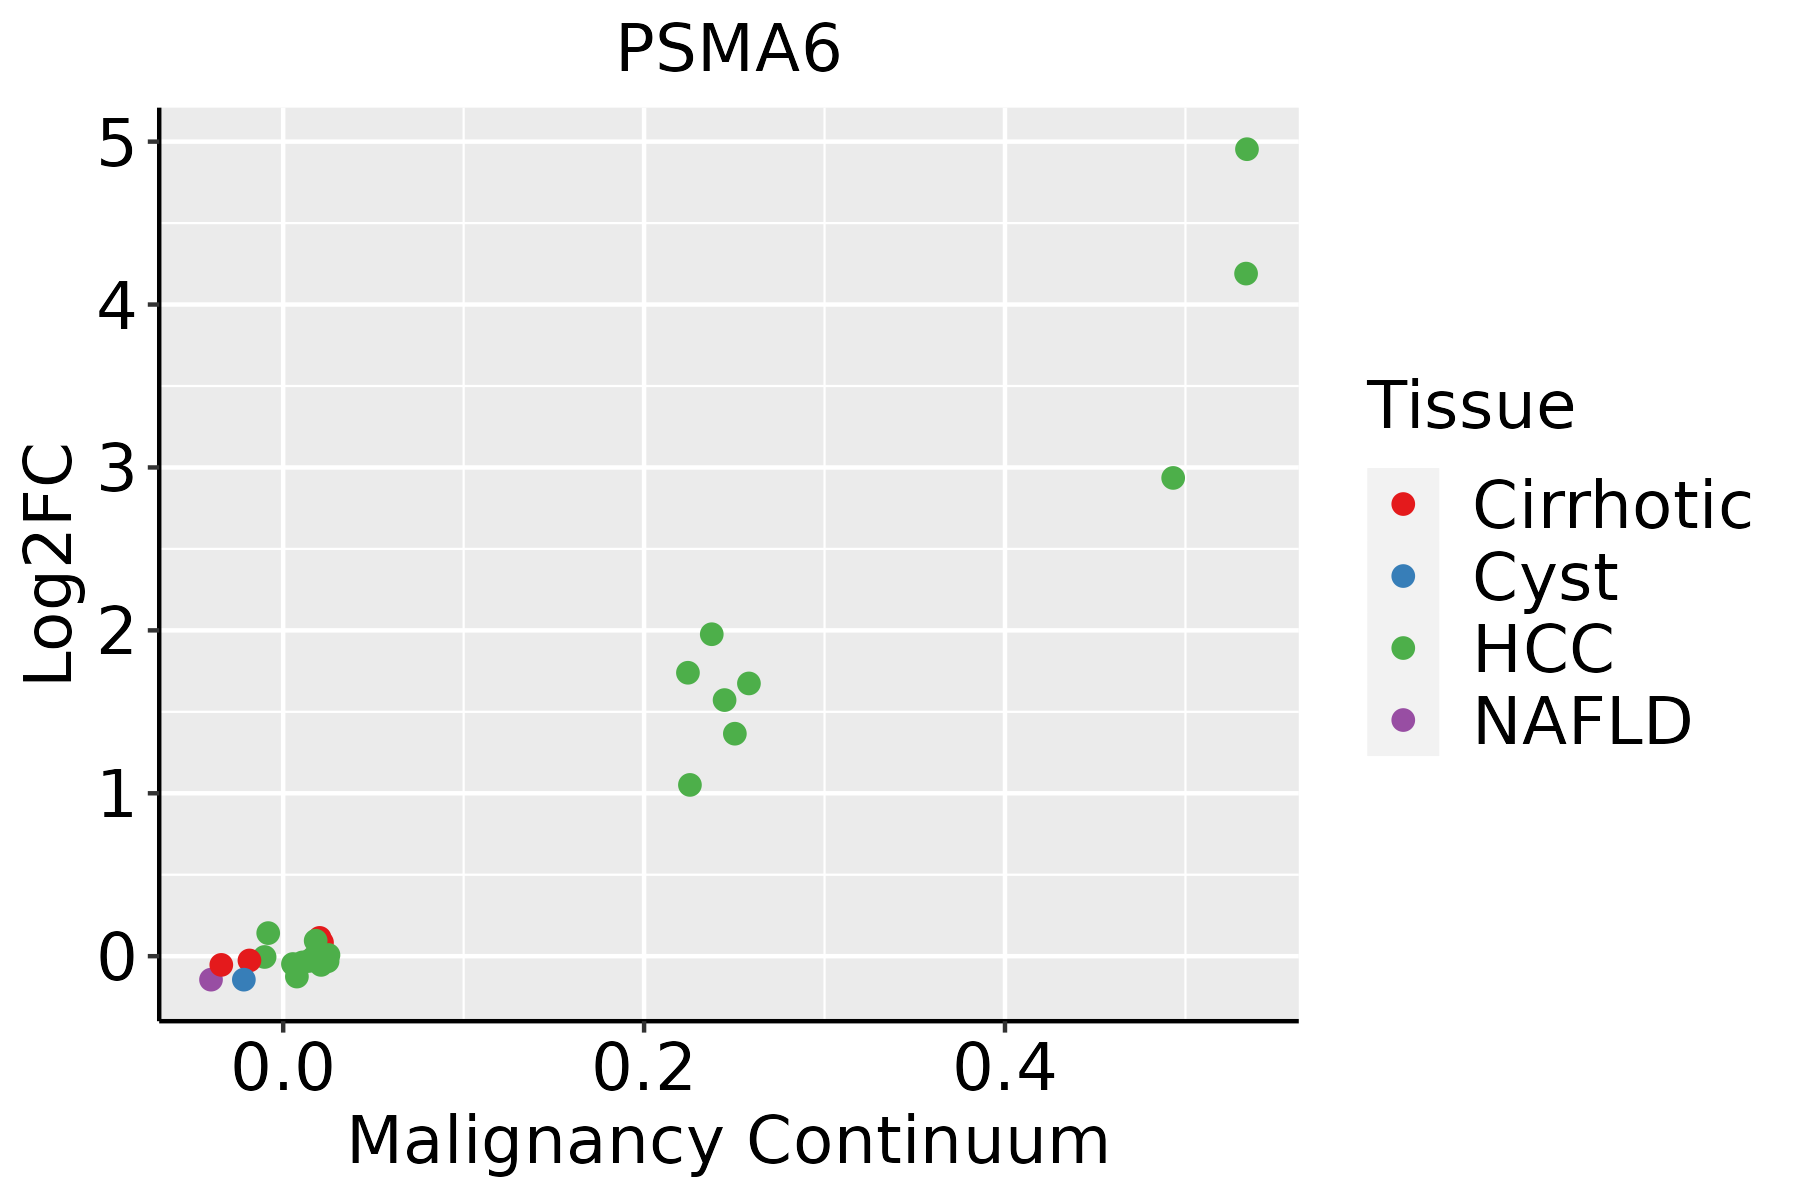 | HCC: Hepatocellular carcinoma |
| NAFLD: Non-alcoholic fatty liver disease | ||
| Lung | 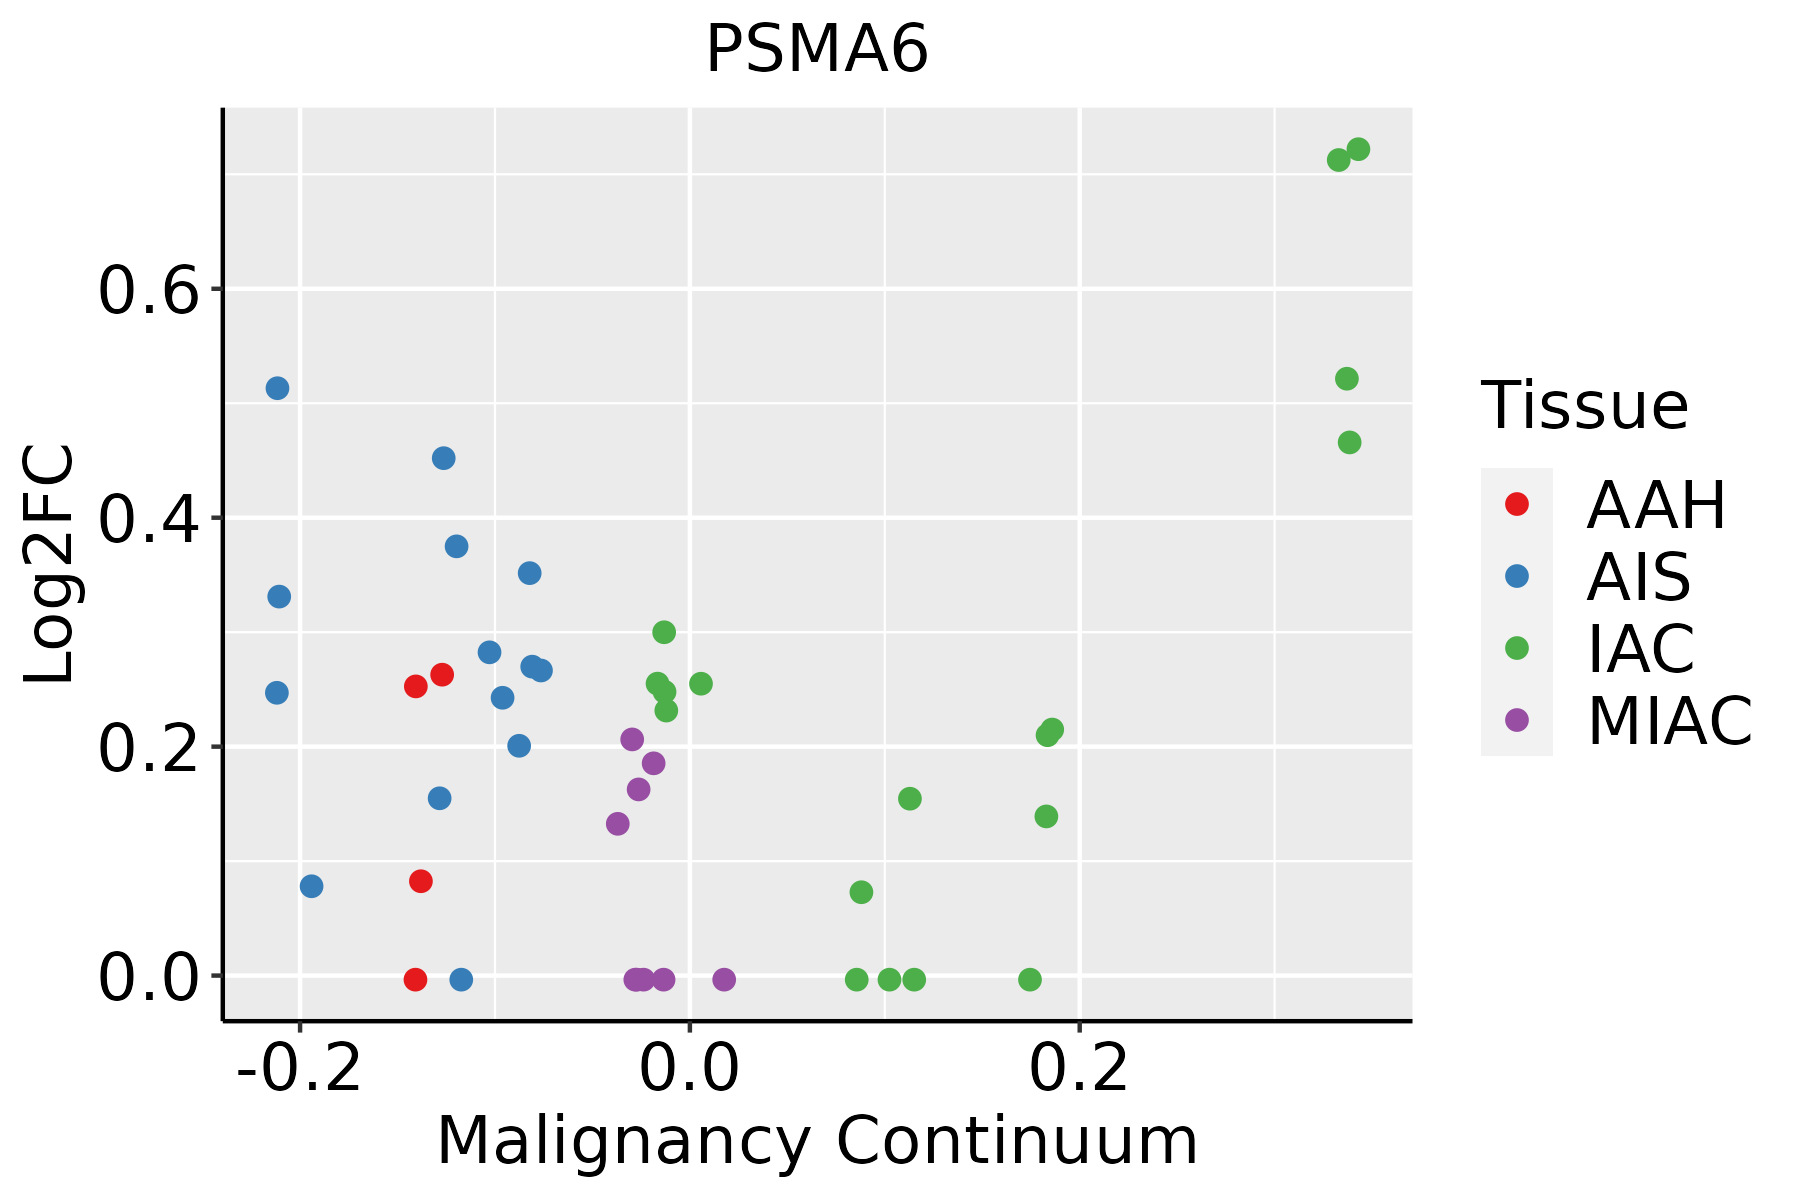 | AAH: Atypical adenomatous hyperplasia |
| AIS: Adenocarcinoma in situ | ||
| IAC: Invasive lung adenocarcinoma | ||
| MIA: Minimally invasive adenocarcinoma | ||
| Oral Cavity | 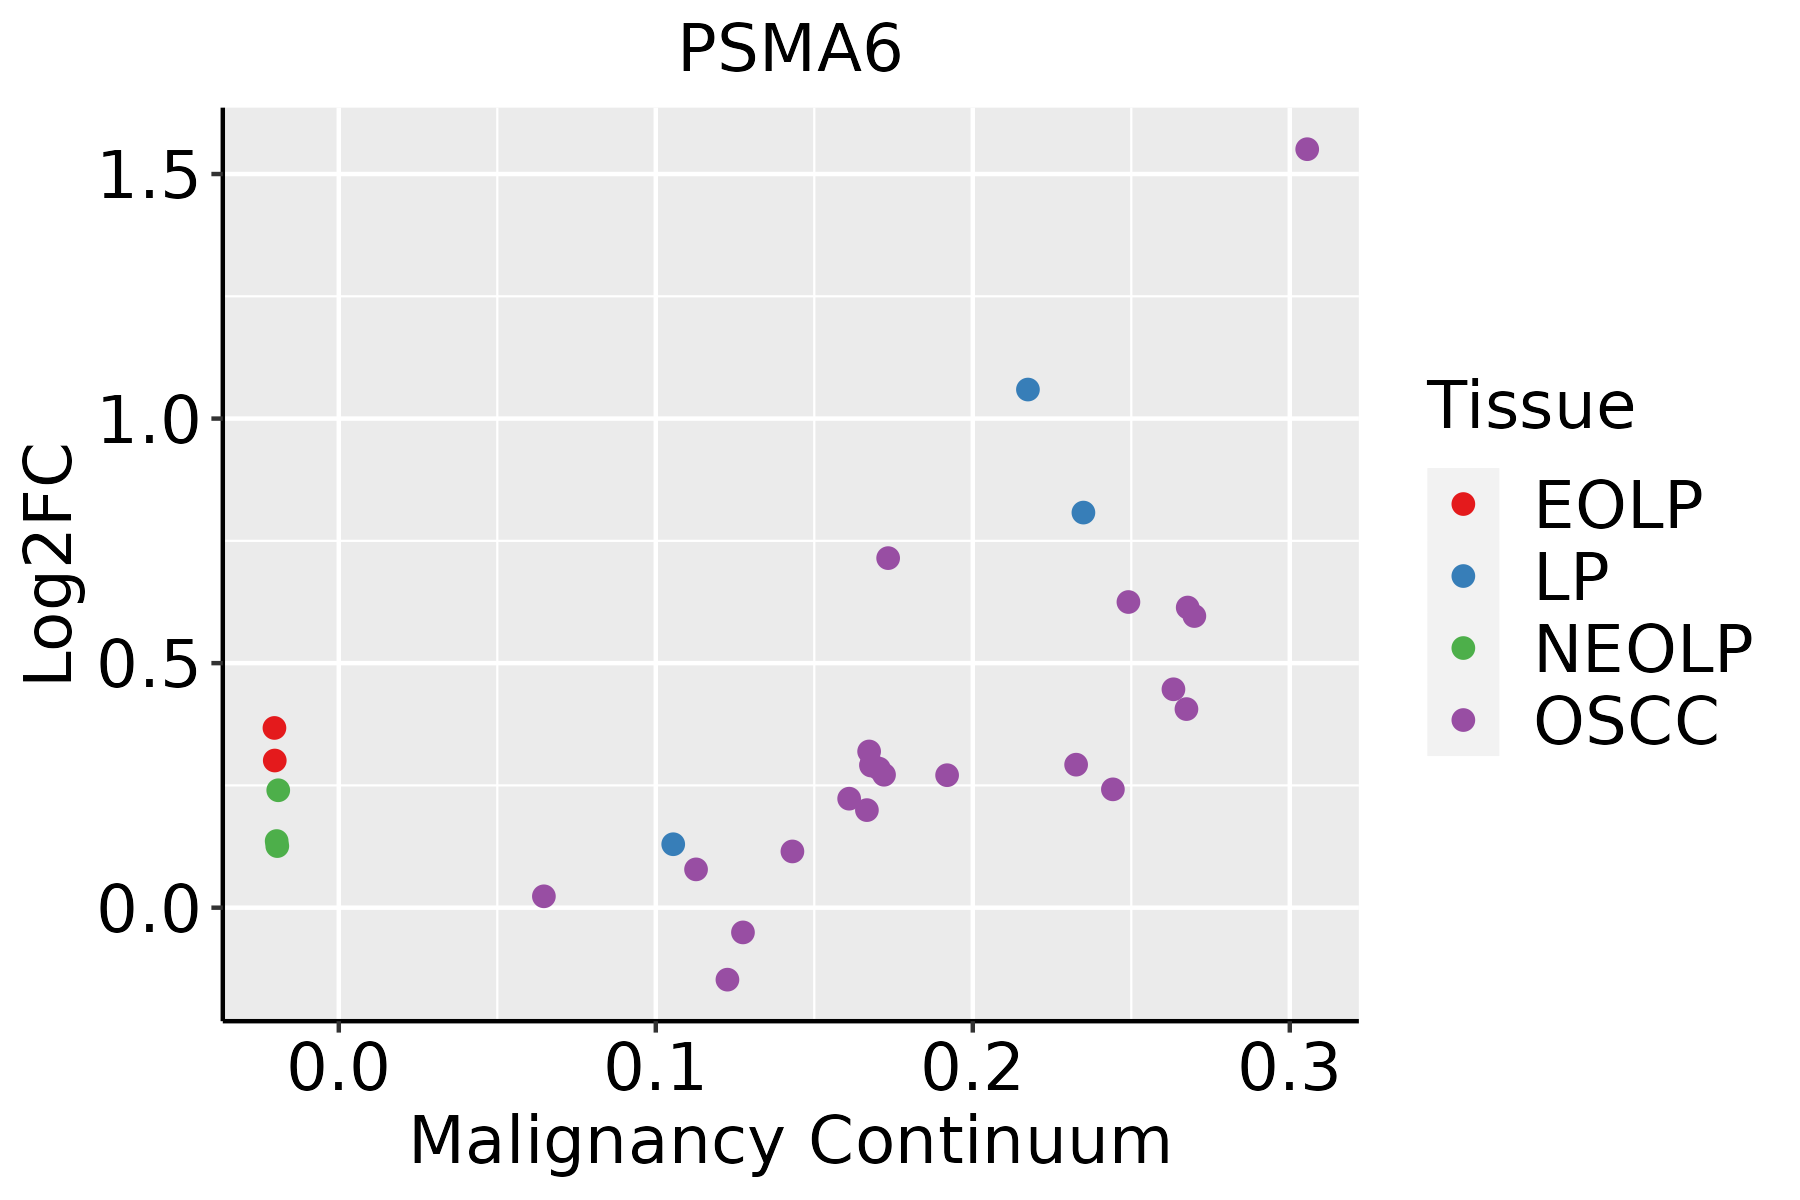 | EOLP: Erosive Oral lichen planus |
| LP: leukoplakia | ||
| NEOLP: Non-erosive oral lichen planus | ||
| OSCC: Oral squamous cell carcinoma | ||
| Prostate |  | BPH: Benign Prostatic Hyperplasia |
| Skin |  | AK: Actinic keratosis |
| cSCC: Cutaneous squamous cell carcinoma | ||
| SCCIS:squamous cell carcinoma in situ |
| ∗log2FC in expression of this searched gene in stem-like cells from each diseased tissue sample relative to stem-like cells in normal samples in each tissue plotted against the malignancy continuum. Samples are colored based on if they are from different disease stage. |
Top |
Malignant transformation related pathway analysis |
| Find out the enriched GO biological processes and KEGG pathways involved in transition from healthy to precancer to cancer |
| Tissue | Disease Stage | Enriched GO biological Processes |
| Colorectum | AD |  |
| Colorectum | SER |  |
| Colorectum | MSS |  |
| Colorectum | MSI-H |  |
| Colorectum | FAP |  |
| ∗Top 15 enriched GO BP terms are showed in the bar plot of each disease state in each tissue. Each row represents a significant GO biological process which is colored according to the -log10(p.adjust). |
| Page: 1 2 3 4 5 6 7 8 9 |
| GO ID | Tissue | Disease Stage | Description | Gene Ratio | Bg Ratio | pvalue | p.adjust | Count |
| GO:001049810 | Cervix | CC | proteasomal protein catabolic process | 111/2311 | 490/18723 | 8.98e-11 | 1.58e-08 | 111 |
| GO:00510904 | Cervix | CC | regulation of DNA-binding transcription factor activity | 87/2311 | 440/18723 | 4.85e-06 | 1.22e-04 | 87 |
| GO:00507273 | Cervix | CC | regulation of inflammatory response | 75/2311 | 386/18723 | 3.95e-05 | 6.18e-04 | 75 |
| GO:00510915 | Cervix | CC | positive regulation of DNA-binding transcription factor activity | 51/2311 | 260/18723 | 5.05e-04 | 4.92e-03 | 51 |
| GO:00510923 | Cervix | CC | positive regulation of NF-kappaB transcription factor activity | 32/2311 | 152/18723 | 1.62e-03 | 1.25e-02 | 32 |
| GO:005072711 | Cervix | HSIL_HPV | regulation of inflammatory response | 41/737 | 386/18723 | 8.30e-09 | 1.03e-06 | 41 |
| GO:005109211 | Cervix | HSIL_HPV | positive regulation of NF-kappaB transcription factor activity | 20/737 | 152/18723 | 2.25e-06 | 9.41e-05 | 20 |
| GO:005109012 | Cervix | HSIL_HPV | regulation of DNA-binding transcription factor activity | 35/737 | 440/18723 | 6.77e-05 | 1.58e-03 | 35 |
| GO:005109112 | Cervix | HSIL_HPV | positive regulation of DNA-binding transcription factor activity | 24/737 | 260/18723 | 1.01e-04 | 2.16e-03 | 24 |
| GO:001049826 | Esophagus | HGIN | proteasomal protein catabolic process | 139/2587 | 490/18723 | 1.20e-17 | 3.41e-15 | 139 |
| GO:0010498111 | Esophagus | ESCC | proteasomal protein catabolic process | 369/8552 | 490/18723 | 1.13e-41 | 1.80e-38 | 369 |
| GO:00510908 | Esophagus | ESCC | regulation of DNA-binding transcription factor activity | 252/8552 | 440/18723 | 5.22e-07 | 6.97e-06 | 252 |
| GO:00510918 | Esophagus | ESCC | positive regulation of DNA-binding transcription factor activity | 155/8552 | 260/18723 | 3.83e-06 | 4.14e-05 | 155 |
| GO:00510926 | Esophagus | ESCC | positive regulation of NF-kappaB transcription factor activity | 91/8552 | 152/18723 | 2.91e-04 | 1.75e-03 | 91 |
| GO:001049812 | Liver | Cirrhotic | proteasomal protein catabolic process | 216/4634 | 490/18723 | 2.52e-21 | 9.29e-19 | 216 |
| GO:001049822 | Liver | HCC | proteasomal protein catabolic process | 351/7958 | 490/18723 | 6.92e-40 | 1.46e-36 | 351 |
| GO:00510902 | Liver | HCC | regulation of DNA-binding transcription factor activity | 220/7958 | 440/18723 | 8.04e-04 | 4.82e-03 | 220 |
| GO:00510913 | Liver | HCC | positive regulation of DNA-binding transcription factor activity | 131/7958 | 260/18723 | 5.98e-03 | 2.45e-02 | 131 |
| GO:00104988 | Lung | IAC | proteasomal protein catabolic process | 90/2061 | 490/18723 | 6.69e-07 | 3.89e-05 | 90 |
| GO:00510903 | Lung | IAC | regulation of DNA-binding transcription factor activity | 76/2061 | 440/18723 | 4.44e-05 | 1.05e-03 | 76 |
| Page: 1 2 3 4 |
| Pathway ID | Tissue | Disease Stage | Description | Gene Ratio | Bg Ratio | pvalue | p.adjust | qvalue | Count |
| hsa0501220 | Cervix | CC | Parkinson disease | 102/1267 | 266/8465 | 1.81e-21 | 1.47e-19 | 8.66e-20 | 102 |
| hsa0501018 | Cervix | CC | Alzheimer disease | 113/1267 | 384/8465 | 9.67e-14 | 3.92e-12 | 2.32e-12 | 113 |
| hsa0502218 | Cervix | CC | Pathways of neurodegeneration - multiple diseases | 128/1267 | 476/8465 | 2.87e-12 | 9.29e-11 | 5.50e-11 | 128 |
| hsa0305014 | Cervix | CC | Proteasome | 16/1267 | 46/8465 | 6.69e-04 | 3.09e-03 | 1.83e-03 | 16 |
| hsa05012110 | Cervix | CC | Parkinson disease | 102/1267 | 266/8465 | 1.81e-21 | 1.47e-19 | 8.66e-20 | 102 |
| hsa0501019 | Cervix | CC | Alzheimer disease | 113/1267 | 384/8465 | 9.67e-14 | 3.92e-12 | 2.32e-12 | 113 |
| hsa0502219 | Cervix | CC | Pathways of neurodegeneration - multiple diseases | 128/1267 | 476/8465 | 2.87e-12 | 9.29e-11 | 5.50e-11 | 128 |
| hsa0305015 | Cervix | CC | Proteasome | 16/1267 | 46/8465 | 6.69e-04 | 3.09e-03 | 1.83e-03 | 16 |
| hsa0501225 | Cervix | HSIL_HPV | Parkinson disease | 43/459 | 266/8465 | 6.69e-11 | 6.53e-09 | 5.28e-09 | 43 |
| hsa0502024 | Cervix | HSIL_HPV | Prion disease | 40/459 | 273/8465 | 6.26e-09 | 3.67e-07 | 2.97e-07 | 40 |
| hsa0501624 | Cervix | HSIL_HPV | Huntington disease | 38/459 | 306/8465 | 1.21e-06 | 2.54e-05 | 2.05e-05 | 38 |
| hsa0502224 | Cervix | HSIL_HPV | Pathways of neurodegeneration - multiple diseases | 46/459 | 476/8465 | 8.10e-05 | 1.08e-03 | 8.72e-04 | 46 |
| hsa0501024 | Cervix | HSIL_HPV | Alzheimer disease | 38/459 | 384/8465 | 2.13e-04 | 2.31e-03 | 1.86e-03 | 38 |
| hsa0501424 | Cervix | HSIL_HPV | Amyotrophic lateral sclerosis | 35/459 | 364/8465 | 6.43e-04 | 5.23e-03 | 4.23e-03 | 35 |
| hsa0501235 | Cervix | HSIL_HPV | Parkinson disease | 43/459 | 266/8465 | 6.69e-11 | 6.53e-09 | 5.28e-09 | 43 |
| hsa0502034 | Cervix | HSIL_HPV | Prion disease | 40/459 | 273/8465 | 6.26e-09 | 3.67e-07 | 2.97e-07 | 40 |
| hsa0501634 | Cervix | HSIL_HPV | Huntington disease | 38/459 | 306/8465 | 1.21e-06 | 2.54e-05 | 2.05e-05 | 38 |
| hsa0502234 | Cervix | HSIL_HPV | Pathways of neurodegeneration - multiple diseases | 46/459 | 476/8465 | 8.10e-05 | 1.08e-03 | 8.72e-04 | 46 |
| hsa0501034 | Cervix | HSIL_HPV | Alzheimer disease | 38/459 | 384/8465 | 2.13e-04 | 2.31e-03 | 1.86e-03 | 38 |
| hsa0501434 | Cervix | HSIL_HPV | Amyotrophic lateral sclerosis | 35/459 | 364/8465 | 6.43e-04 | 5.23e-03 | 4.23e-03 | 35 |
| Page: 1 2 3 4 5 6 7 8 9 10 11 12 |
Top |
Cell-cell communication analysis |
| Identification of potential cell-cell interactions between two cell types and their ligand-receptor pairs for different disease states |
| Ligand | Receptor | LRpair | Pathway | Tissue | Disease Stage |
| Page: 1 |
Top |
Single-cell gene regulatory network inference analysis |
| Find out the significant the regulons (TFs) and the target genes of each regulon across cell types for different disease states |
| TF | Cell Type | Tissue | Disease Stage | Target Gene | RSS | Regulon Activity |
| PSMA6 | iATC | Thyroid | ATC | CXCL6,IDO1,CCL20, etc. | 1.76e-01 |  |
| PSMA6 | TFC | Thyroid | goiters | CXCL6,IDO1,CCL20, etc. | 1.54e-01 |  |
| ∗The dot plots of a searched regulon are shown for all cell subpopulations in each disease state of each tissue based on the regulon specific score inferred using pySCENIC and by calculating the average expression. |
| Page: 1 |
Top |
Somatic mutation of malignant transformation related genes |
| Annotation of somatic variants for genes involved in malignant transformation |
| Hugo Symbol | Variant Class | Variant Classification | dbSNP RS | HGVSc | HGVSp | HGVSp Short | SWISSPROT | BIOTYPE | SIFT | PolyPhen | Tumor Sample Barcode | Tissue | Histology | Sex | Age | Stage | Therapy Types | Drugs | Outcome |
| PSMA6 | SNV | Missense_Mutation | c.253G>T | p.Ala85Ser | p.A85S | P60900 | protein_coding | deleterious(0.04) | possibly_damaging(0.506) | TCGA-A8-A07R-01 | Breast | breast invasive carcinoma | Female | >=65 | III/IV | Ancillary | zoledronic | SD | |
| PSMA6 | SNV | Missense_Mutation | rs267603983 | c.506G>A | p.Gly169Glu | p.G169E | P60900 | protein_coding | deleterious(0) | probably_damaging(1) | TCGA-D8-A27G-01 | Breast | breast invasive carcinoma | Female | >=65 | I/II | Unknown | Unknown | SD |
| PSMA6 | SNV | Missense_Mutation | novel | c.355N>T | p.Ala119Ser | p.A119S | P60900 | protein_coding | deleterious(0.02) | benign(0.432) | TCGA-C5-A8ZZ-01 | Cervix | cervical & endocervical cancer | Female | <65 | I/II | Unspecific | Cisplatin | SD |
| PSMA6 | deletion | Frame_Shift_Del | c.539delN | p.Val183Ter | p.V183* | P60900 | protein_coding | TCGA-EA-A410-01 | Cervix | cervical & endocervical cancer | Female | <65 | I/II | Unknown | Unknown | SD | |||
| PSMA6 | SNV | Missense_Mutation | rs760361768 | c.386N>T | p.Ala129Val | p.A129V | P60900 | protein_coding | deleterious(0.02) | probably_damaging(0.938) | TCGA-AD-6964-01 | Colorectum | colon adenocarcinoma | Male | <65 | III/IV | Chemotherapy | folfox | PD |
| PSMA6 | SNV | Missense_Mutation | rs752794747 | c.503C>T | p.Ala168Val | p.A168V | P60900 | protein_coding | tolerated(0.4) | benign(0.006) | TCGA-A5-A0G2-01 | Endometrium | uterine corpus endometrioid carcinoma | Female | <65 | III/IV | Unknown | Unknown | SD |
| PSMA6 | SNV | Missense_Mutation | novel | c.4T>C | p.Ser2Pro | p.S2P | P60900 | protein_coding | deleterious(0) | probably_damaging(0.939) | TCGA-AP-A051-01 | Endometrium | uterine corpus endometrioid carcinoma | Female | >=65 | I/II | Unknown | Unknown | SD |
| PSMA6 | SNV | Missense_Mutation | novel | c.400N>A | p.Leu134Ile | p.L134I | P60900 | protein_coding | deleterious(0.01) | possibly_damaging(0.908) | TCGA-FI-A2D5-01 | Endometrium | uterine corpus endometrioid carcinoma | Female | <65 | III/IV | Chemotherapy | carboplatinum | PD |
| PSMA6 | deletion | Frame_Shift_Del | c.546delA | p.Val183Ter | p.V183* | P60900 | protein_coding | TCGA-B5-A0JZ-01 | Endometrium | uterine corpus endometrioid carcinoma | Female | <65 | III/IV | Chemotherapy | carboplatin | PD | |||
| PSMA6 | deletion | Frame_Shift_Del | c.539delN | p.Val183Ter | p.V183* | P60900 | protein_coding | TCGA-D1-A0ZS-01 | Endometrium | uterine corpus endometrioid carcinoma | Female | <65 | I/II | Unknown | Unknown | SD |
| Page: 1 2 3 |
Top |
Related drugs of malignant transformation related genes |
| Identification of chemicals and drugs interact with genes involved in malignant transfromation |
| (DGIdb 4.0) |
| Entrez ID | Symbol | Category | Interaction Types | Drug Claim Name | Drug Name | PMIDs |
| 5687 | PSMA6 | PROTEASE, DRUGGABLE GENOME | inhibitor | CHEMBL451887 | CARFILZOMIB | |
| 5687 | PSMA6 | PROTEASE, DRUGGABLE GENOME | inhibitor | CARFILZOMIB | CARFILZOMIB | |
| 5687 | PSMA6 | PROTEASE, DRUGGABLE GENOME | inhibitor | CHEMBL2103884 | OPROZOMIB | |
| 5687 | PSMA6 | PROTEASE, DRUGGABLE GENOME | inhibitor | CHEMBL325041 | BORTEZOMIB | |
| 5687 | PSMA6 | PROTEASE, DRUGGABLE GENOME | inhibitor | CHEMBL371405 | MARIZOMIB | |
| 5687 | PSMA6 | PROTEASE, DRUGGABLE GENOME | CARFILZOMIB | CARFILZOMIB | 24524217 | |
| 5687 | PSMA6 | PROTEASE, DRUGGABLE GENOME | inhibitor | CHEMBL3545432 | IXAZOMIB CITRATE | |
| 5687 | PSMA6 | PROTEASE, DRUGGABLE GENOME | BORTEZOMIB | BORTEZOMIB | 24524217 | |
| 5687 | PSMA6 | PROTEASE, DRUGGABLE GENOME | inhibitor | BORTEZOMIB | BORTEZOMIB |
| Page: 1 |

Copyright 2023-Present -The University of Texas Health Science Center at Houston |