| Tissue | Expression Dynamics | Abbreviation |
| Cervix | 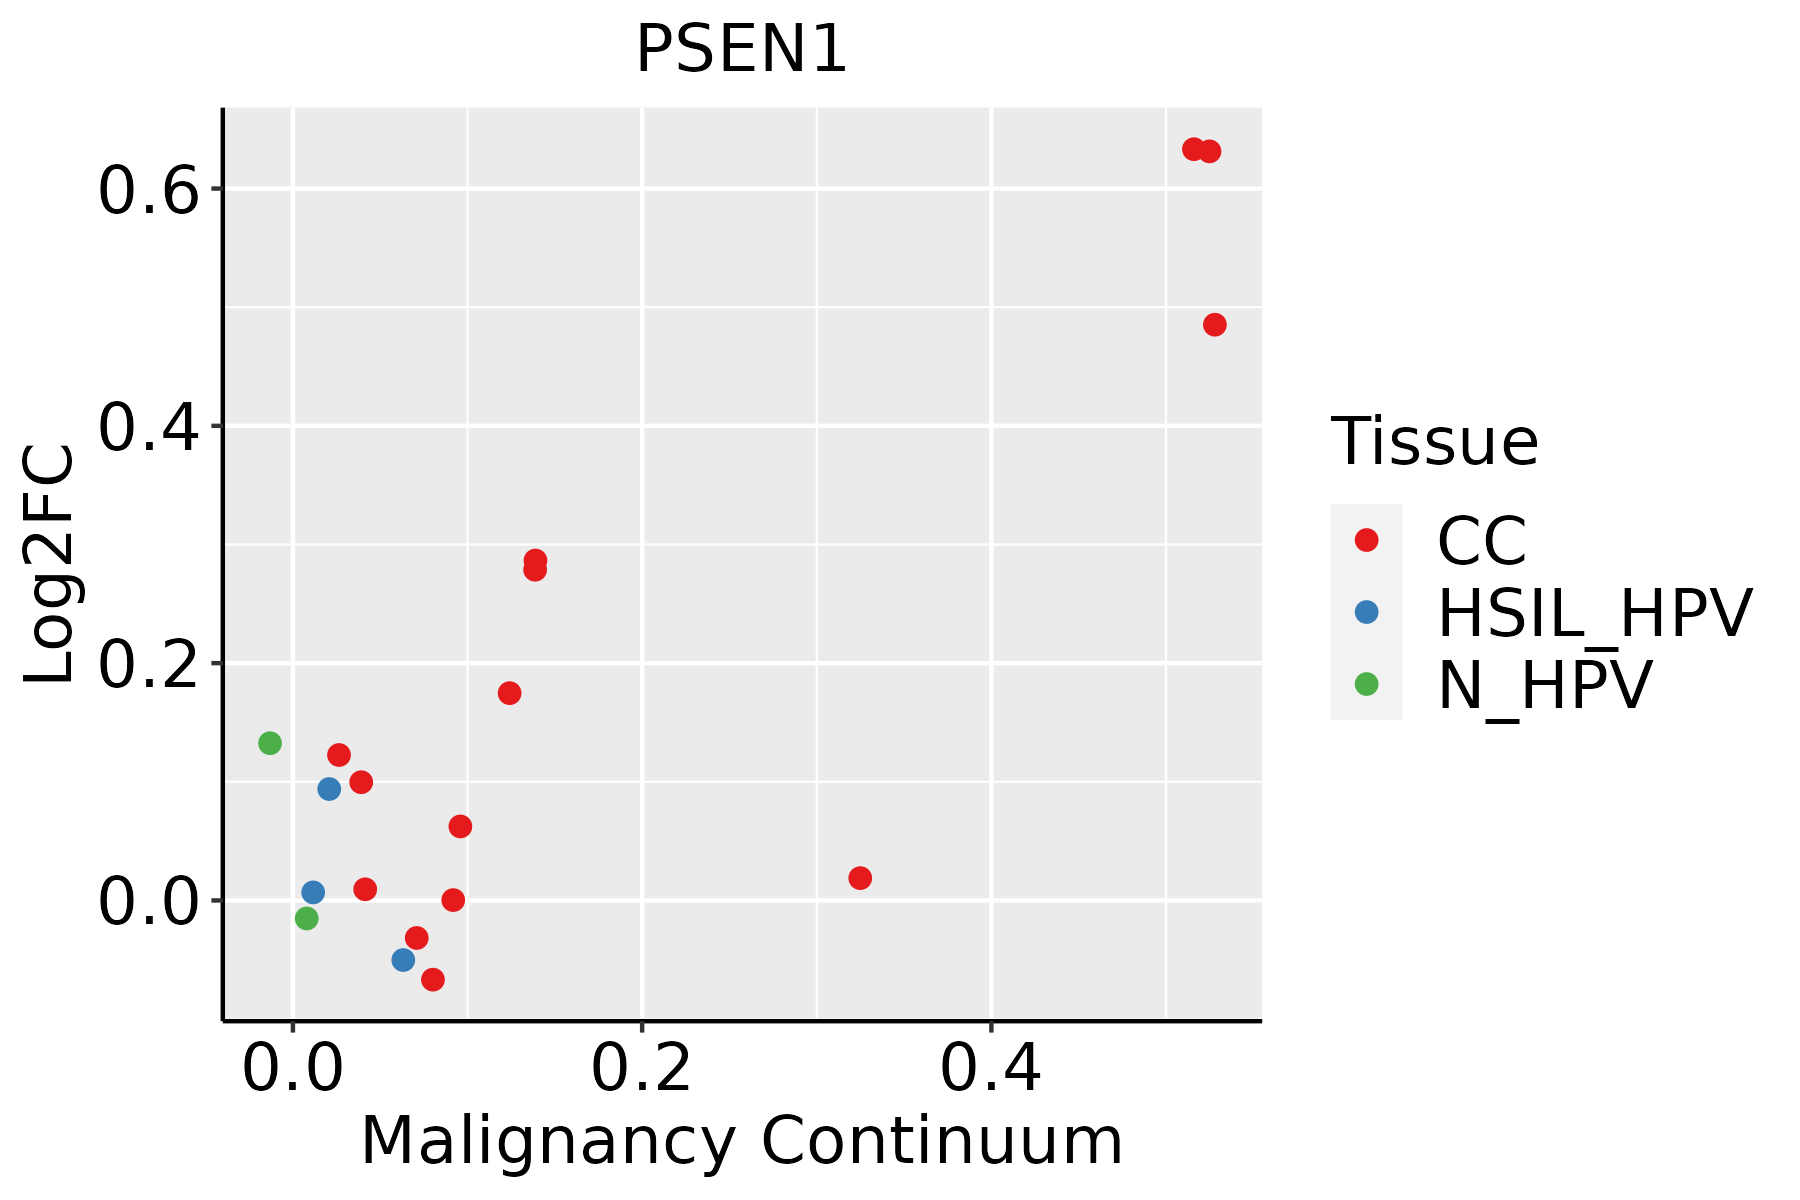 | CC: Cervix cancer |
| HSIL_HPV: HPV-infected high-grade squamous intraepithelial lesions |
| N_HPV: HPV-infected normal cervix |
| Colorectum (GSE201348) |  | FAP: Familial adenomatous polyposis |
| CRC: Colorectal cancer |
| Colorectum (HTA11) |  | AD: Adenomas |
| SER: Sessile serrated lesions |
| MSI-H: Microsatellite-high colorectal cancer |
| MSS: Microsatellite stable colorectal cancer |
| Esophagus | 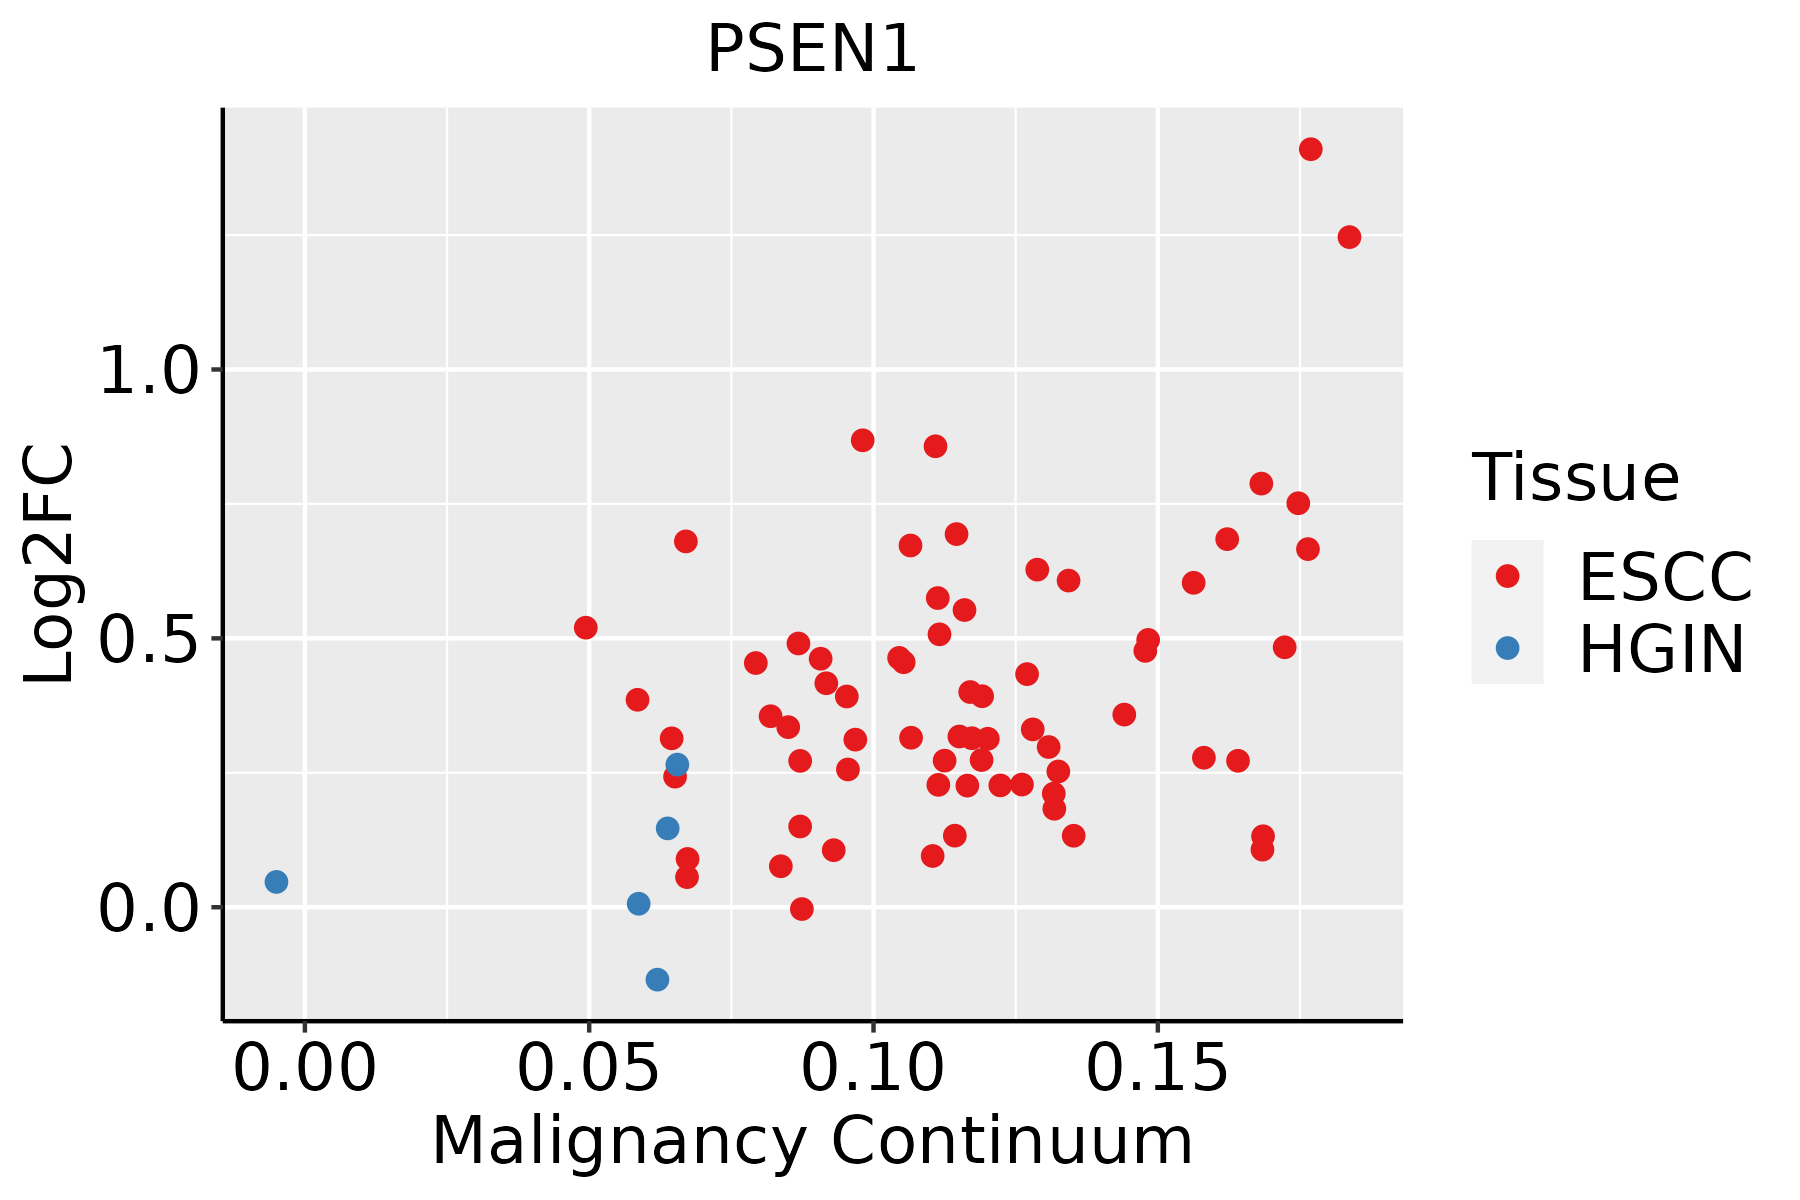 | ESCC: Esophageal squamous cell carcinoma |
| HGIN: High-grade intraepithelial neoplasias |
| LGIN: Low-grade intraepithelial neoplasias |
| Lung |  | AAH: Atypical adenomatous hyperplasia |
| AIS: Adenocarcinoma in situ |
| IAC: Invasive lung adenocarcinoma |
| MIA: Minimally invasive adenocarcinoma |
| Oral Cavity |  | EOLP: Erosive Oral lichen planus |
| LP: leukoplakia |
| NEOLP: Non-erosive oral lichen planus |
| OSCC: Oral squamous cell carcinoma |
| Prostate | 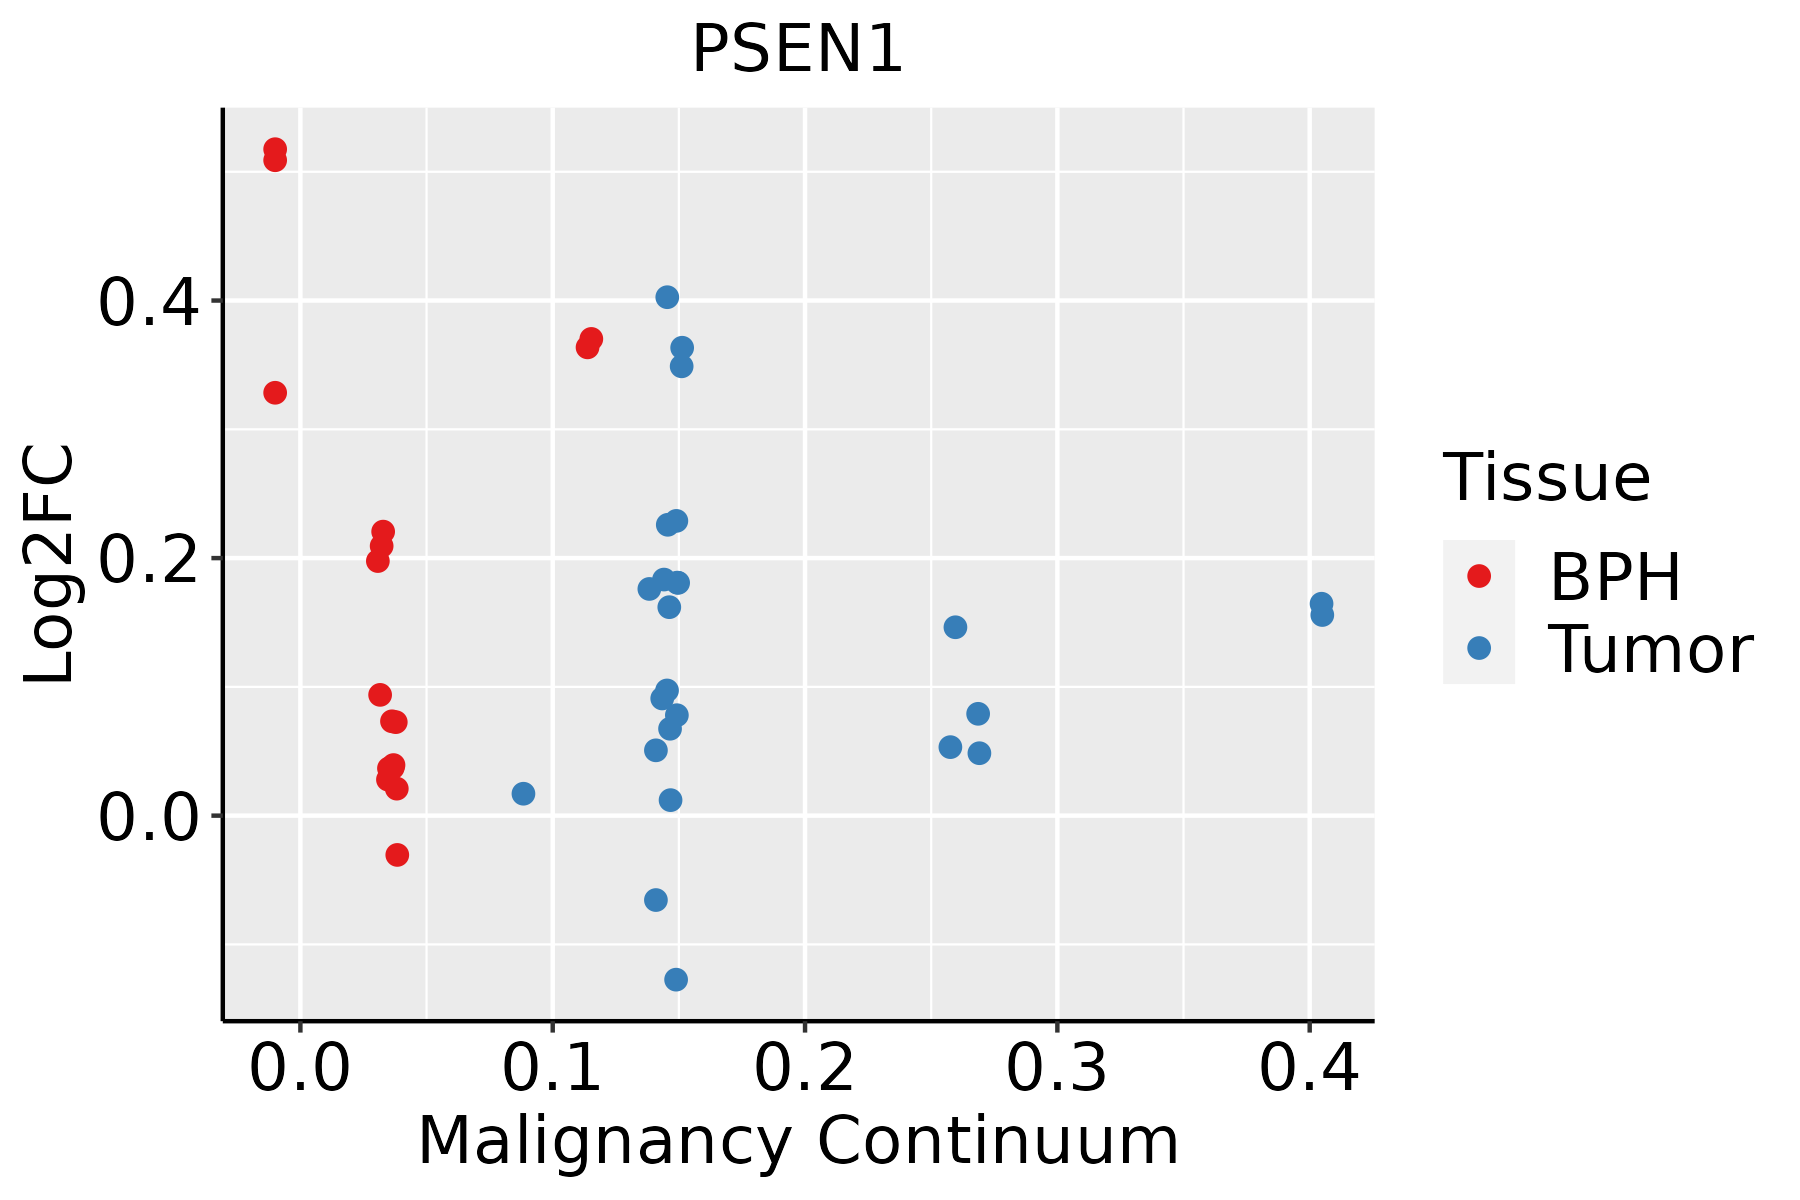 | BPH: Benign Prostatic Hyperplasia |
| Thyroid | 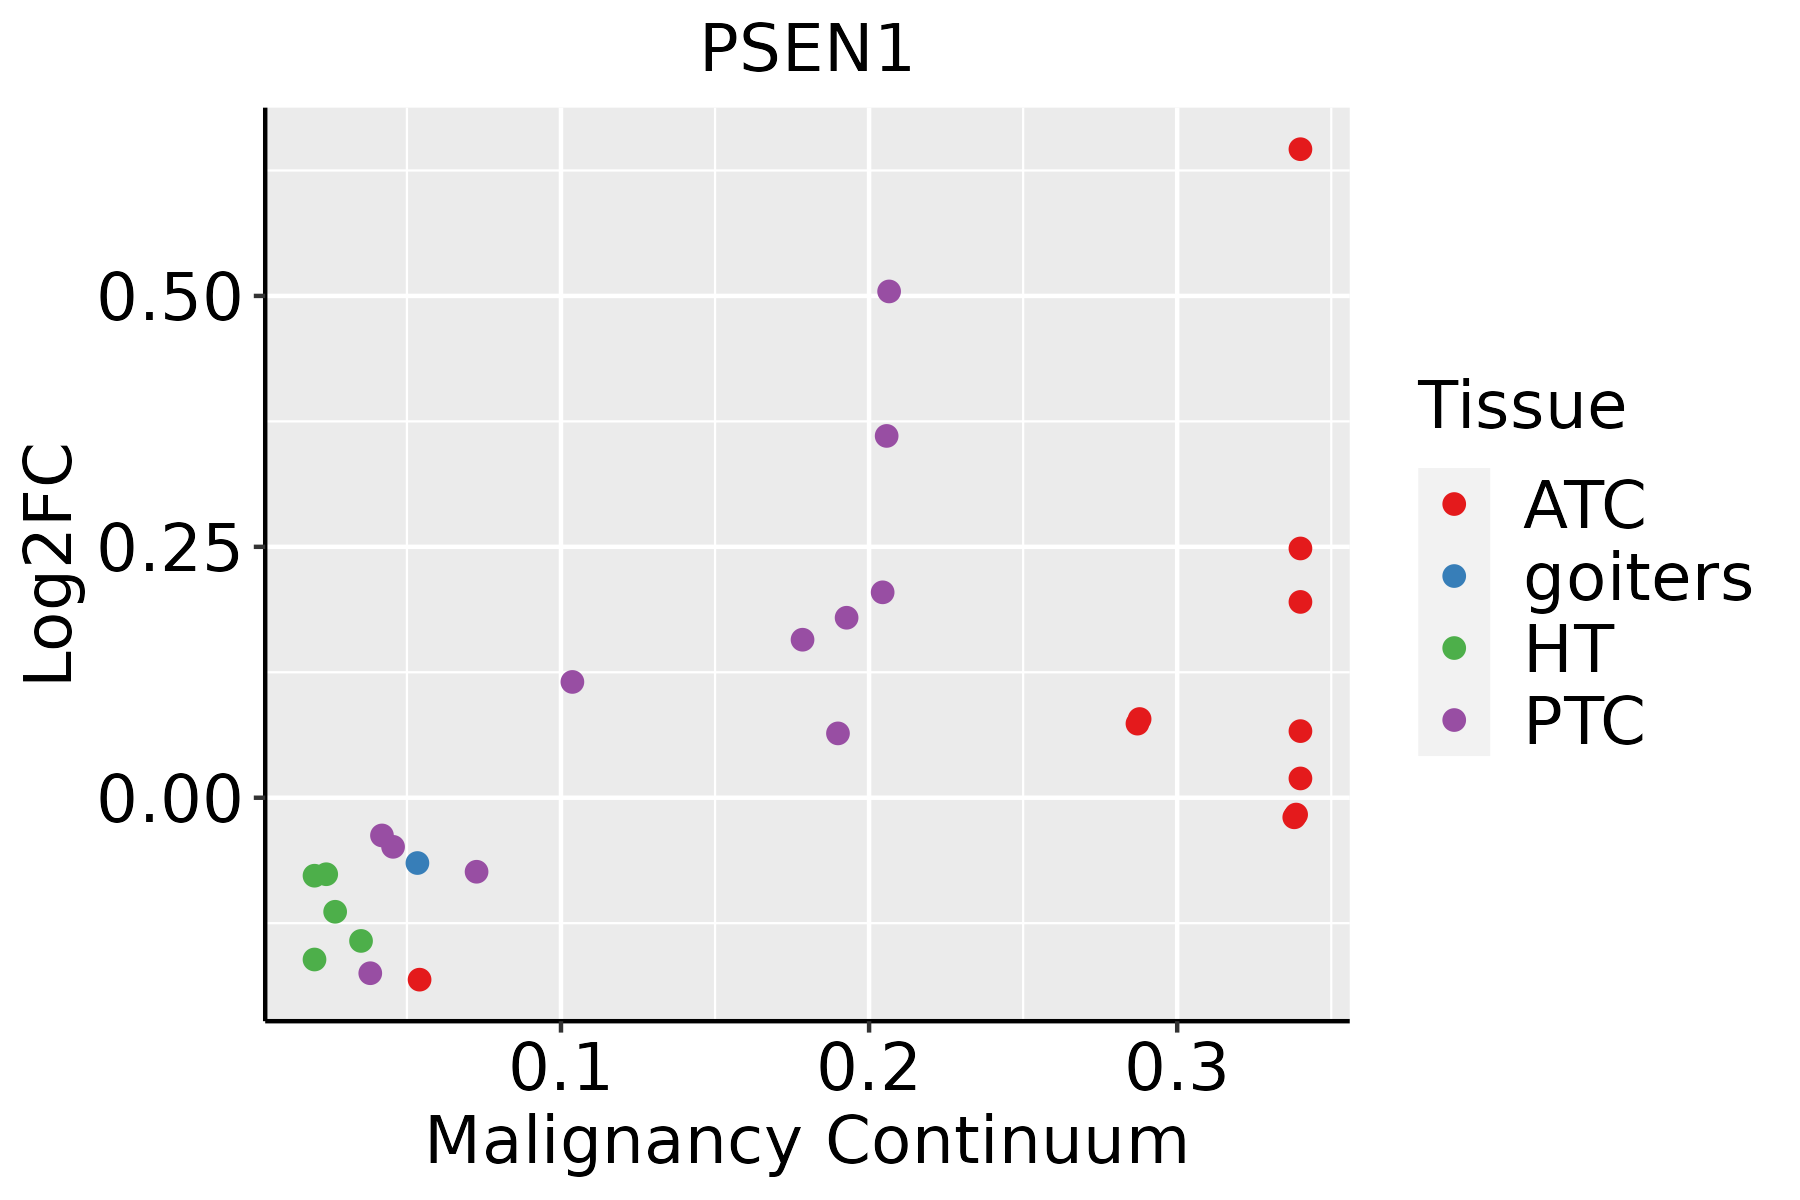 | ATC: Anaplastic thyroid cancer |
| HT: Hashimoto's thyroiditis |
| PTC: Papillary thyroid cancer |
| GO ID | Tissue | Disease Stage | Description | Gene Ratio | Bg Ratio | pvalue | p.adjust | Count |
| GO:004603410 | Cervix | CC | ATP metabolic process | 90/2311 | 277/18723 | 7.90e-19 | 2.36e-15 | 90 |
| GO:004217610 | Cervix | CC | regulation of protein catabolic process | 104/2311 | 391/18723 | 9.39e-15 | 9.36e-12 | 104 |
| GO:200123310 | Cervix | CC | regulation of apoptotic signaling pathway | 96/2311 | 356/18723 | 4.08e-14 | 3.05e-11 | 96 |
| GO:004586210 | Cervix | CC | positive regulation of proteolysis | 95/2311 | 372/18723 | 1.84e-12 | 6.86e-10 | 95 |
| GO:190336210 | Cervix | CC | regulation of cellular protein catabolic process | 72/2311 | 255/18723 | 5.98e-12 | 2.10e-09 | 72 |
| GO:004573210 | Cervix | CC | positive regulation of protein catabolic process | 65/2311 | 231/18723 | 7.44e-11 | 1.39e-08 | 65 |
| GO:00435884 | Cervix | CC | skin development | 71/2311 | 263/18723 | 8.04e-11 | 1.46e-08 | 71 |
| GO:001049810 | Cervix | CC | proteasomal protein catabolic process | 111/2311 | 490/18723 | 8.98e-11 | 1.58e-08 | 111 |
| GO:00725949 | Cervix | CC | establishment of protein localization to organelle | 99/2311 | 422/18723 | 1.23e-10 | 2.11e-08 | 99 |
| GO:190290310 | Cervix | CC | regulation of supramolecular fiber organization | 92/2311 | 383/18723 | 1.49e-10 | 2.48e-08 | 92 |
| GO:190332010 | Cervix | CC | regulation of protein modification by small protein conjugation or removal | 66/2311 | 242/18723 | 2.31e-10 | 3.46e-08 | 66 |
| GO:000697910 | Cervix | CC | response to oxidative stress | 102/2311 | 446/18723 | 2.99e-10 | 4.36e-08 | 102 |
| GO:190382910 | Cervix | CC | positive regulation of cellular protein localization | 72/2311 | 276/18723 | 3.20e-10 | 4.46e-08 | 72 |
| GO:000989610 | Cervix | CC | positive regulation of catabolic process | 109/2311 | 492/18723 | 5.26e-10 | 6.99e-08 | 109 |
| GO:003139610 | Cervix | CC | regulation of protein ubiquitination | 59/2311 | 210/18723 | 5.90e-10 | 7.51e-08 | 59 |
| GO:00421108 | Cervix | CC | T cell activation | 107/2311 | 487/18723 | 1.24e-09 | 1.46e-07 | 107 |
| GO:190305010 | Cervix | CC | regulation of proteolysis involved in cellular protein catabolic process | 60/2311 | 221/18723 | 1.82e-09 | 1.98e-07 | 60 |
| GO:00506737 | Cervix | CC | epithelial cell proliferation | 98/2311 | 437/18723 | 2.01e-09 | 2.15e-07 | 98 |
| GO:00160557 | Cervix | CC | Wnt signaling pathway | 98/2311 | 444/18723 | 4.82e-09 | 4.65e-07 | 98 |
| GO:00512359 | Cervix | CC | maintenance of location | 78/2311 | 327/18723 | 5.18e-09 | 4.92e-07 | 78 |
| Pathway ID | Tissue | Disease Stage | Description | Gene Ratio | Bg Ratio | pvalue | p.adjust | qvalue | Count |
| hsa0501018 | Cervix | CC | Alzheimer disease | 113/1267 | 384/8465 | 9.67e-14 | 3.92e-12 | 2.32e-12 | 113 |
| hsa0502218 | Cervix | CC | Pathways of neurodegeneration - multiple diseases | 128/1267 | 476/8465 | 2.87e-12 | 9.29e-11 | 5.50e-11 | 128 |
| hsa051657 | Cervix | CC | Human papillomavirus infection | 74/1267 | 331/8465 | 1.70e-04 | 1.02e-03 | 6.03e-04 | 74 |
| hsa043109 | Cervix | CC | Wnt signaling pathway | 43/1267 | 171/8465 | 3.03e-04 | 1.64e-03 | 9.68e-04 | 43 |
| hsa0472214 | Cervix | CC | Neurotrophin signaling pathway | 32/1267 | 119/8465 | 5.01e-04 | 2.42e-03 | 1.43e-03 | 32 |
| hsa04330 | Cervix | CC | Notch signaling pathway | 17/1267 | 62/8465 | 7.99e-03 | 2.56e-02 | 1.51e-02 | 17 |
| hsa0501019 | Cervix | CC | Alzheimer disease | 113/1267 | 384/8465 | 9.67e-14 | 3.92e-12 | 2.32e-12 | 113 |
| hsa0502219 | Cervix | CC | Pathways of neurodegeneration - multiple diseases | 128/1267 | 476/8465 | 2.87e-12 | 9.29e-11 | 5.50e-11 | 128 |
| hsa0516512 | Cervix | CC | Human papillomavirus infection | 74/1267 | 331/8465 | 1.70e-04 | 1.02e-03 | 6.03e-04 | 74 |
| hsa0431012 | Cervix | CC | Wnt signaling pathway | 43/1267 | 171/8465 | 3.03e-04 | 1.64e-03 | 9.68e-04 | 43 |
| hsa0472215 | Cervix | CC | Neurotrophin signaling pathway | 32/1267 | 119/8465 | 5.01e-04 | 2.42e-03 | 1.43e-03 | 32 |
| hsa043301 | Cervix | CC | Notch signaling pathway | 17/1267 | 62/8465 | 7.99e-03 | 2.56e-02 | 1.51e-02 | 17 |
| hsa0502244 | Cervix | N_HPV | Pathways of neurodegeneration - multiple diseases | 47/349 | 476/8465 | 1.48e-08 | 3.13e-07 | 2.45e-07 | 47 |
| hsa0501044 | Cervix | N_HPV | Alzheimer disease | 41/349 | 384/8465 | 1.50e-08 | 3.13e-07 | 2.45e-07 | 41 |
| hsa0502254 | Cervix | N_HPV | Pathways of neurodegeneration - multiple diseases | 47/349 | 476/8465 | 1.48e-08 | 3.13e-07 | 2.45e-07 | 47 |
| hsa0501054 | Cervix | N_HPV | Alzheimer disease | 41/349 | 384/8465 | 1.50e-08 | 3.13e-07 | 2.45e-07 | 41 |
| hsa05010 | Colorectum | AD | Alzheimer disease | 174/2092 | 384/8465 | 1.82e-19 | 9.26e-18 | 5.91e-18 | 174 |
| hsa05022 | Colorectum | AD | Pathways of neurodegeneration - multiple diseases | 201/2092 | 476/8465 | 4.54e-18 | 1.27e-16 | 8.09e-17 | 201 |
| hsa04722 | Colorectum | AD | Neurotrophin signaling pathway | 50/2092 | 119/8465 | 2.28e-05 | 2.24e-04 | 1.43e-04 | 50 |
| hsa04310 | Colorectum | AD | Wnt signaling pathway | 56/2092 | 171/8465 | 1.03e-02 | 3.93e-02 | 2.51e-02 | 56 |
| Hugo Symbol | Variant Class | Variant Classification | dbSNP RS | HGVSc | HGVSp | HGVSp Short | SWISSPROT | BIOTYPE | SIFT | PolyPhen | Tumor Sample Barcode | Tissue | Histology | Sex | Age | Stage | Therapy Types | Drugs | Outcome |
| PSEN1 | SNV | Missense_Mutation | | c.211G>A | p.Glu71Lys | p.E71K | P49768 | protein_coding | deleterious(0.01) | probably_damaging(0.996) | TCGA-BH-A18P-01 | Breast | breast invasive carcinoma | Female | <65 | I/II | Unknown | Unknown | PD |
| PSEN1 | insertion | Nonsense_Mutation | novel | c.254_255insTCATTTTCAGTGAACTACAAATCTCTGAAACCCAAAA | p.Phe86HisfsTer4 | p.F86Hfs*4 | P49768 | protein_coding | | | TCGA-AR-A0TY-01 | Breast | breast invasive carcinoma | Female | <65 | I/II | Unspecific | Paclitaxel | PD |
| PSEN1 | insertion | Frame_Shift_Ins | novel | c.277_278insTGGTGGTGGTCGTGGCATGG | p.Thr99TrpfsTer22 | p.T99Wfs*22 | P49768 | protein_coding | | | TCGA-AR-A2LK-01 | Breast | breast invasive carcinoma | Female | <65 | III/IV | Hormone Therapy | anastrozole | PD |
| PSEN1 | SNV | Missense_Mutation | rs756764981 | c.1037N>A | p.Ser346Asn | p.S346N | P49768 | protein_coding | tolerated(0.45) | benign(0) | TCGA-2W-A8YY-01 | Cervix | cervical & endocervical cancer | Female | <65 | I/II | Chemotherapy | cisplatin | CR |
| PSEN1 | SNV | Missense_Mutation | | c.151N>C | p.Ser51Pro | p.S51P | P49768 | protein_coding | tolerated(0.14) | benign(0) | TCGA-C5-A1M9-01 | Cervix | cervical & endocervical cancer | Female | <65 | I/II | Chemotherapy | cisplatin | PD |
| PSEN1 | SNV | Missense_Mutation | | c.961G>A | p.Glu321Lys | p.E321K | P49768 | protein_coding | tolerated(0.6) | benign(0.015) | TCGA-FU-A23L-01 | Cervix | cervical & endocervical cancer | Female | <65 | I/II | Chemotherapy | cisplatin | CR |
| PSEN1 | SNV | Missense_Mutation | | c.630G>T | p.Met210Ile | p.M210I | P49768 | protein_coding | deleterious(0.03) | probably_damaging(0.989) | TCGA-FU-A3HZ-01 | Cervix | cervical & endocervical cancer | Female | <65 | I/II | Chemotherapy | cisplatin | CR |
| PSEN1 | SNV | Missense_Mutation | | c.1321T>G | p.Phe441Val | p.F441V | P49768 | protein_coding | deleterious(0.01) | probably_damaging(0.998) | TCGA-FU-A3HZ-01 | Cervix | cervical & endocervical cancer | Female | <65 | I/II | Chemotherapy | cisplatin | CR |
| PSEN1 | SNV | Missense_Mutation | novel | c.908N>A | p.Pro303Gln | p.P303Q | P49768 | protein_coding | deleterious(0.03) | possibly_damaging(0.573) | TCGA-RA-A741-01 | Cervix | cervical & endocervical cancer | Female | <65 | I/II | Chemotherapy | cisplatin | SD |
| PSEN1 | SNV | Missense_Mutation | | c.407N>T | p.Ala136Val | p.A136V | P49768 | protein_coding | deleterious(0.04) | possibly_damaging(0.704) | TCGA-AA-3821-01 | Colorectum | colon adenocarcinoma | Female | >=65 | I/II | Unknown | Unknown | SD |
| Entrez ID | Symbol | Category | Interaction Types | Drug Claim Name | Drug Name | PMIDs |
| 5663 | PSEN1 | ENZYME, TRANSPORTER, PROTEASE, DRUGGABLE GENOME, CELL SURFACE | inhibitor | MK0752 | | |
| 5663 | PSEN1 | ENZYME, TRANSPORTER, PROTEASE, DRUGGABLE GENOME, CELL SURFACE | | BMS-708163 | AVAGACESTAT | |
| 5663 | PSEN1 | ENZYME, TRANSPORTER, PROTEASE, DRUGGABLE GENOME, CELL SURFACE | | E2012 | | |
| 5663 | PSEN1 | ENZYME, TRANSPORTER, PROTEASE, DRUGGABLE GENOME, CELL SURFACE | inhibitor | MK0752 | | |
| 5663 | PSEN1 | ENZYME, TRANSPORTER, PROTEASE, DRUGGABLE GENOME, CELL SURFACE | | R-flurbiprofen | | |
| 5663 | PSEN1 | ENZYME, TRANSPORTER, PROTEASE, DRUGGABLE GENOME, CELL SURFACE | inhibitor | CHEMBL1090771 | AVAGACESTAT | |
| 5663 | PSEN1 | ENZYME, TRANSPORTER, PROTEASE, DRUGGABLE GENOME, CELL SURFACE | | LY-411575 | CHEMBL392068 | 23181502,19443228 |
| 5663 | PSEN1 | ENZYME, TRANSPORTER, PROTEASE, DRUGGABLE GENOME, CELL SURFACE | | BMS-299897 | CHEMBL247471 | |
| 5663 | PSEN1 | ENZYME, TRANSPORTER, PROTEASE, DRUGGABLE GENOME, CELL SURFACE | inhibitor | 178103911 | | |
| 5663 | PSEN1 | ENZYME, TRANSPORTER, PROTEASE, DRUGGABLE GENOME, CELL SURFACE | inhibitor | 178103557 | SEMAGACESTAT | |


