
|
|||||
|
 | |
| |
| |
| |
| |
| |
|
Gene: PSD3 |
Gene summary for PSD3 |
| Gene information | Species | Human | Gene symbol | PSD3 | Gene ID | 23362 |
| Gene name | pleckstrin and Sec7 domain containing 3 | |
| Gene Alias | EFA6D | |
| Cytomap | 8p22 | |
| Gene Type | protein-coding | GO ID | GO:0007154 | UniProtAcc | B3KRC4 |
Top |
Malignant transformation analysis |
| Identification of the aberrant gene expression in precancerous and cancerous lesions by comparing the gene expression of stem-like cells in diseased tissues with normal stem cells |
| Entrez ID | Symbol | Replicates | Species | Organ | Tissue | Adj P-value | Log2FC | Malignancy |
| 23362 | PSD3 | CA_HPV_3 | Human | Cervix | CC | 1.25e-02 | 2.15e-02 | 0.0414 |
| 23362 | PSD3 | CCI_1 | Human | Cervix | CC | 9.83e-16 | 1.90e+00 | 0.528 |
| 23362 | PSD3 | CCI_2 | Human | Cervix | CC | 2.44e-07 | 1.01e+00 | 0.5249 |
| 23362 | PSD3 | CCI_3 | Human | Cervix | CC | 1.65e-21 | 1.32e+00 | 0.516 |
| 23362 | PSD3 | CCII_1 | Human | Cervix | CC | 9.28e-04 | 3.06e-01 | 0.3249 |
| 23362 | PSD3 | HTA11_3410_2000001011 | Human | Colorectum | AD | 3.71e-12 | -5.00e-01 | 0.0155 |
| 23362 | PSD3 | HTA11_2951_2000001011 | Human | Colorectum | AD | 2.55e-02 | -7.55e-01 | 0.0216 |
| 23362 | PSD3 | HTA11_347_2000001011 | Human | Colorectum | AD | 8.51e-05 | 4.76e-01 | -0.1954 |
| 23362 | PSD3 | HTA11_3361_2000001011 | Human | Colorectum | AD | 4.40e-08 | -4.66e-01 | -0.1207 |
| 23362 | PSD3 | HTA11_5216_2000001011 | Human | Colorectum | SER | 2.39e-03 | -3.25e-01 | -0.1462 |
| 23362 | PSD3 | HTA11_7862_2000001011 | Human | Colorectum | AD | 9.25e-03 | -4.64e-01 | -0.0179 |
| 23362 | PSD3 | HTA11_866_3004761011 | Human | Colorectum | AD | 5.57e-03 | -3.75e-01 | 0.096 |
| 23362 | PSD3 | HTA11_99999970781_79442 | Human | Colorectum | MSS | 2.23e-39 | -8.78e-01 | 0.294 |
| 23362 | PSD3 | HTA11_99999965104_69814 | Human | Colorectum | MSS | 6.39e-12 | -7.53e-01 | 0.281 |
| 23362 | PSD3 | HTA11_99999971662_82457 | Human | Colorectum | MSS | 3.65e-06 | -4.17e-01 | 0.3859 |
| 23362 | PSD3 | HTA11_99999974143_84620 | Human | Colorectum | MSS | 4.17e-04 | -3.42e-01 | 0.3005 |
| 23362 | PSD3 | A001-C-207 | Human | Colorectum | FAP | 5.13e-03 | -1.66e-01 | 0.1278 |
| 23362 | PSD3 | A015-C-203 | Human | Colorectum | FAP | 1.22e-23 | -2.80e-01 | -0.1294 |
| 23362 | PSD3 | A015-C-204 | Human | Colorectum | FAP | 5.53e-06 | -4.10e-02 | -0.0228 |
| 23362 | PSD3 | A014-C-040 | Human | Colorectum | FAP | 5.61e-05 | -2.77e-01 | -0.1184 |
| Page: 1 2 3 4 5 6 7 8 9 10 11 |
| Tissue | Expression Dynamics | Abbreviation |
| Cervix | 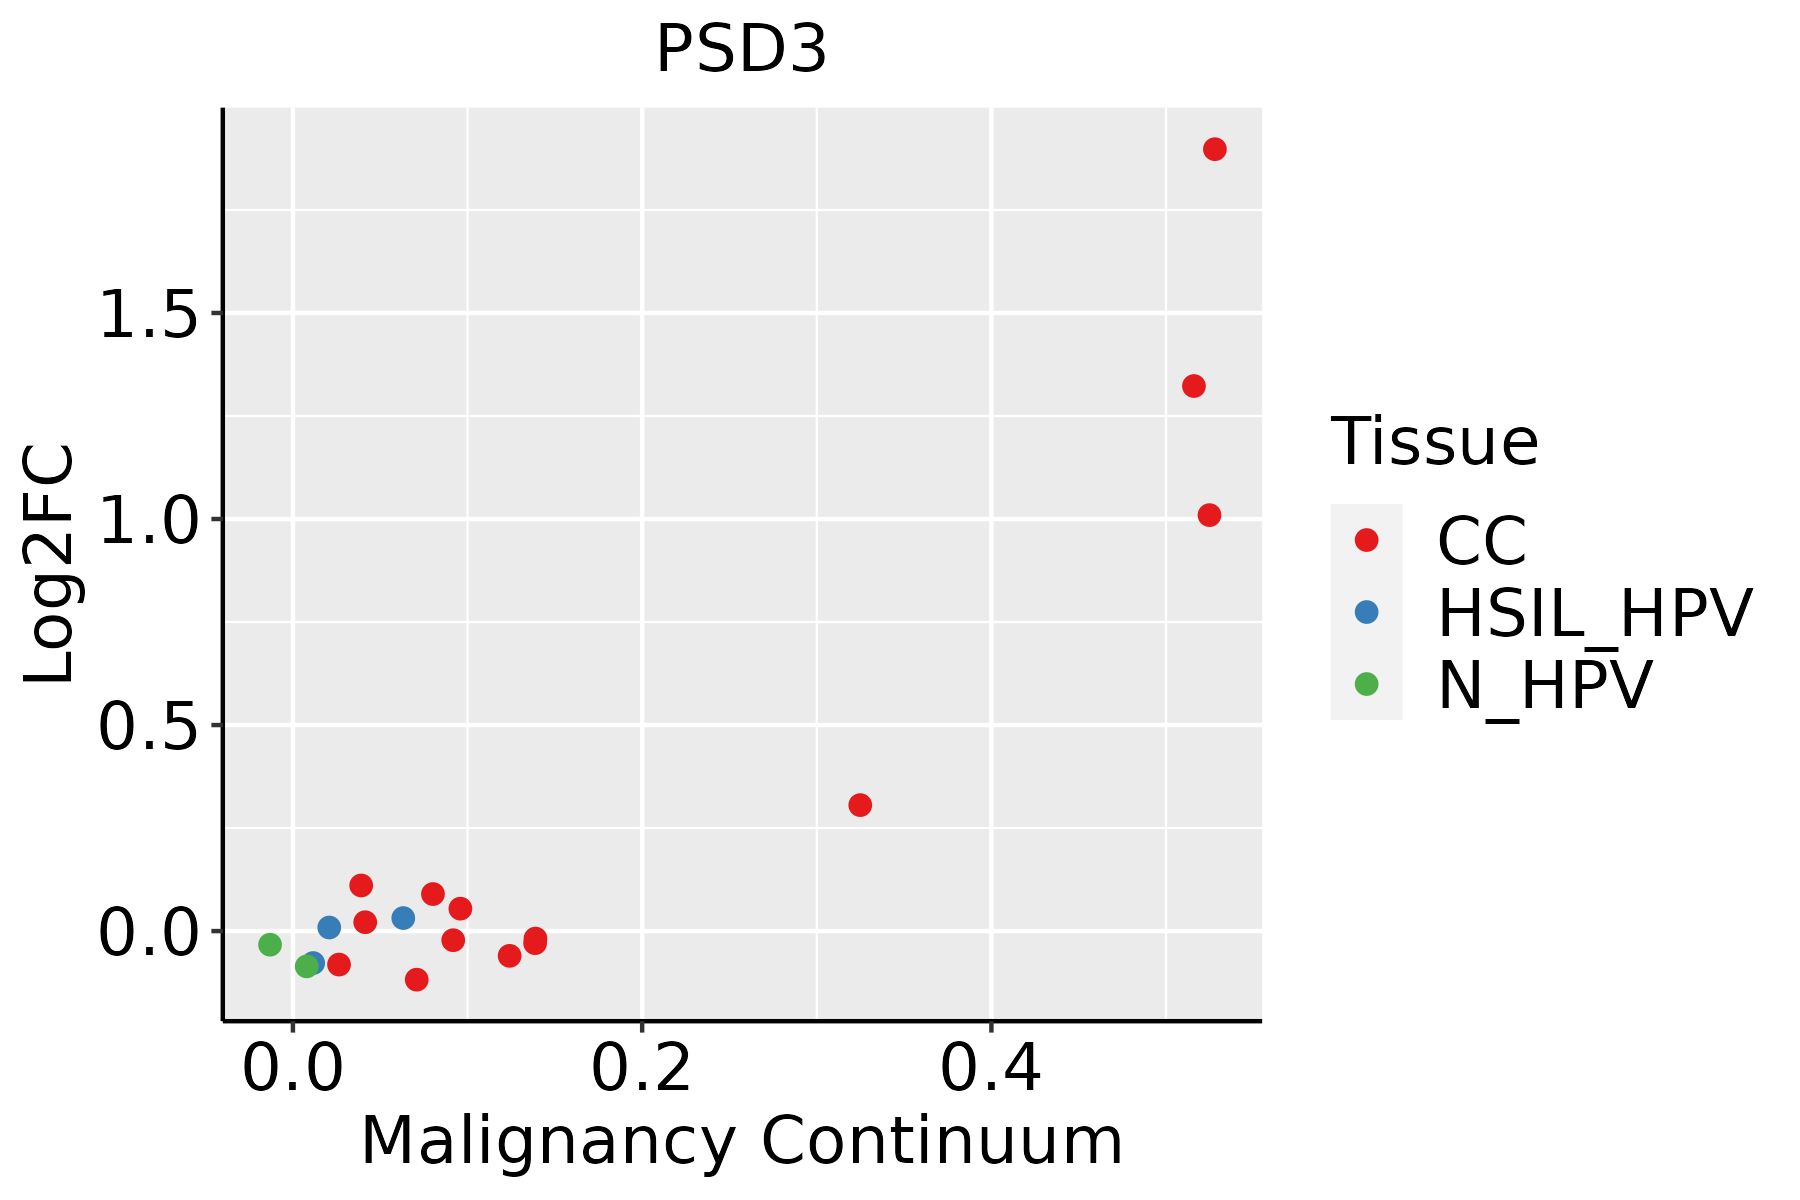 | CC: Cervix cancer |
| HSIL_HPV: HPV-infected high-grade squamous intraepithelial lesions | ||
| N_HPV: HPV-infected normal cervix | ||
| Colorectum (GSE201348) |  | FAP: Familial adenomatous polyposis |
| CRC: Colorectal cancer | ||
| Colorectum (HTA11) |  | AD: Adenomas |
| SER: Sessile serrated lesions | ||
| MSI-H: Microsatellite-high colorectal cancer | ||
| MSS: Microsatellite stable colorectal cancer | ||
| Endometrium |  | AEH: Atypical endometrial hyperplasia |
| EEC: Endometrioid Cancer | ||
| Esophagus | 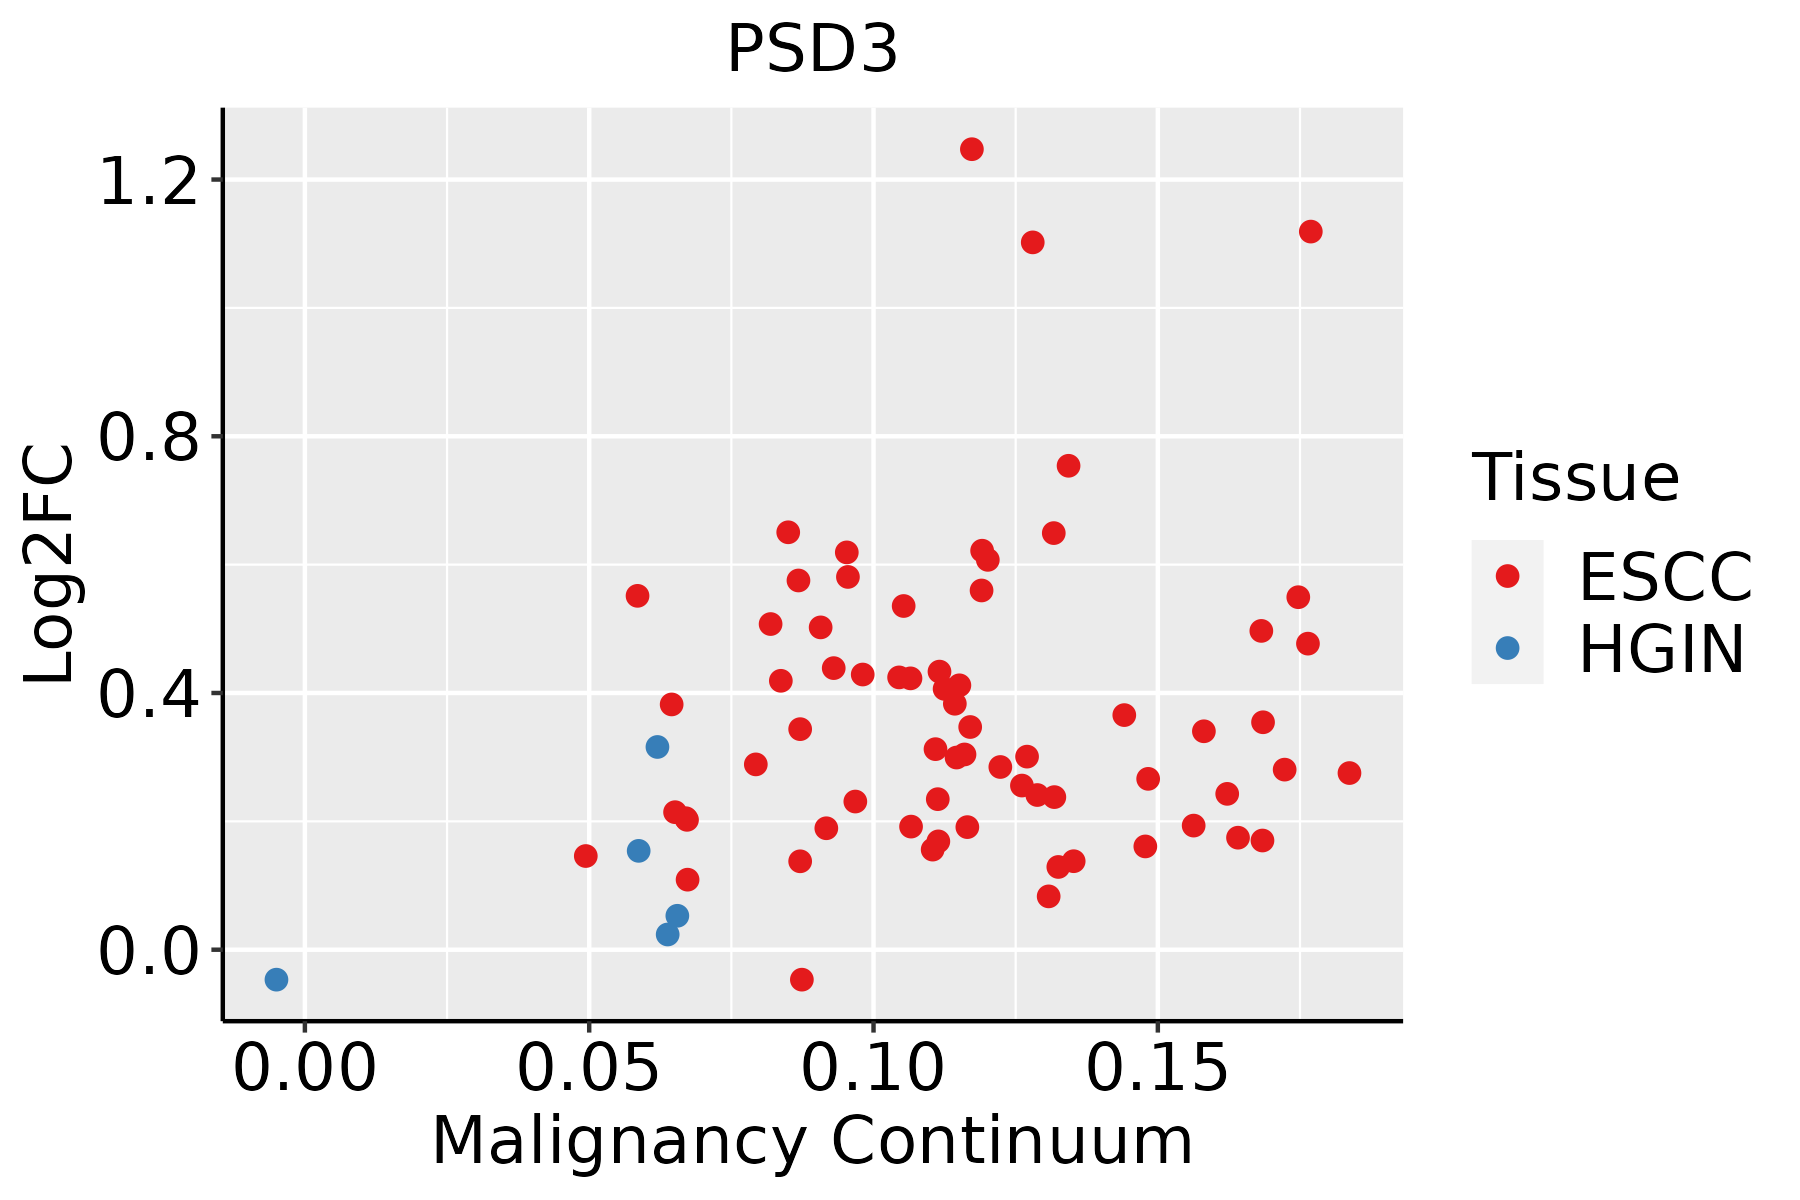 | ESCC: Esophageal squamous cell carcinoma |
| HGIN: High-grade intraepithelial neoplasias | ||
| LGIN: Low-grade intraepithelial neoplasias | ||
| GC | 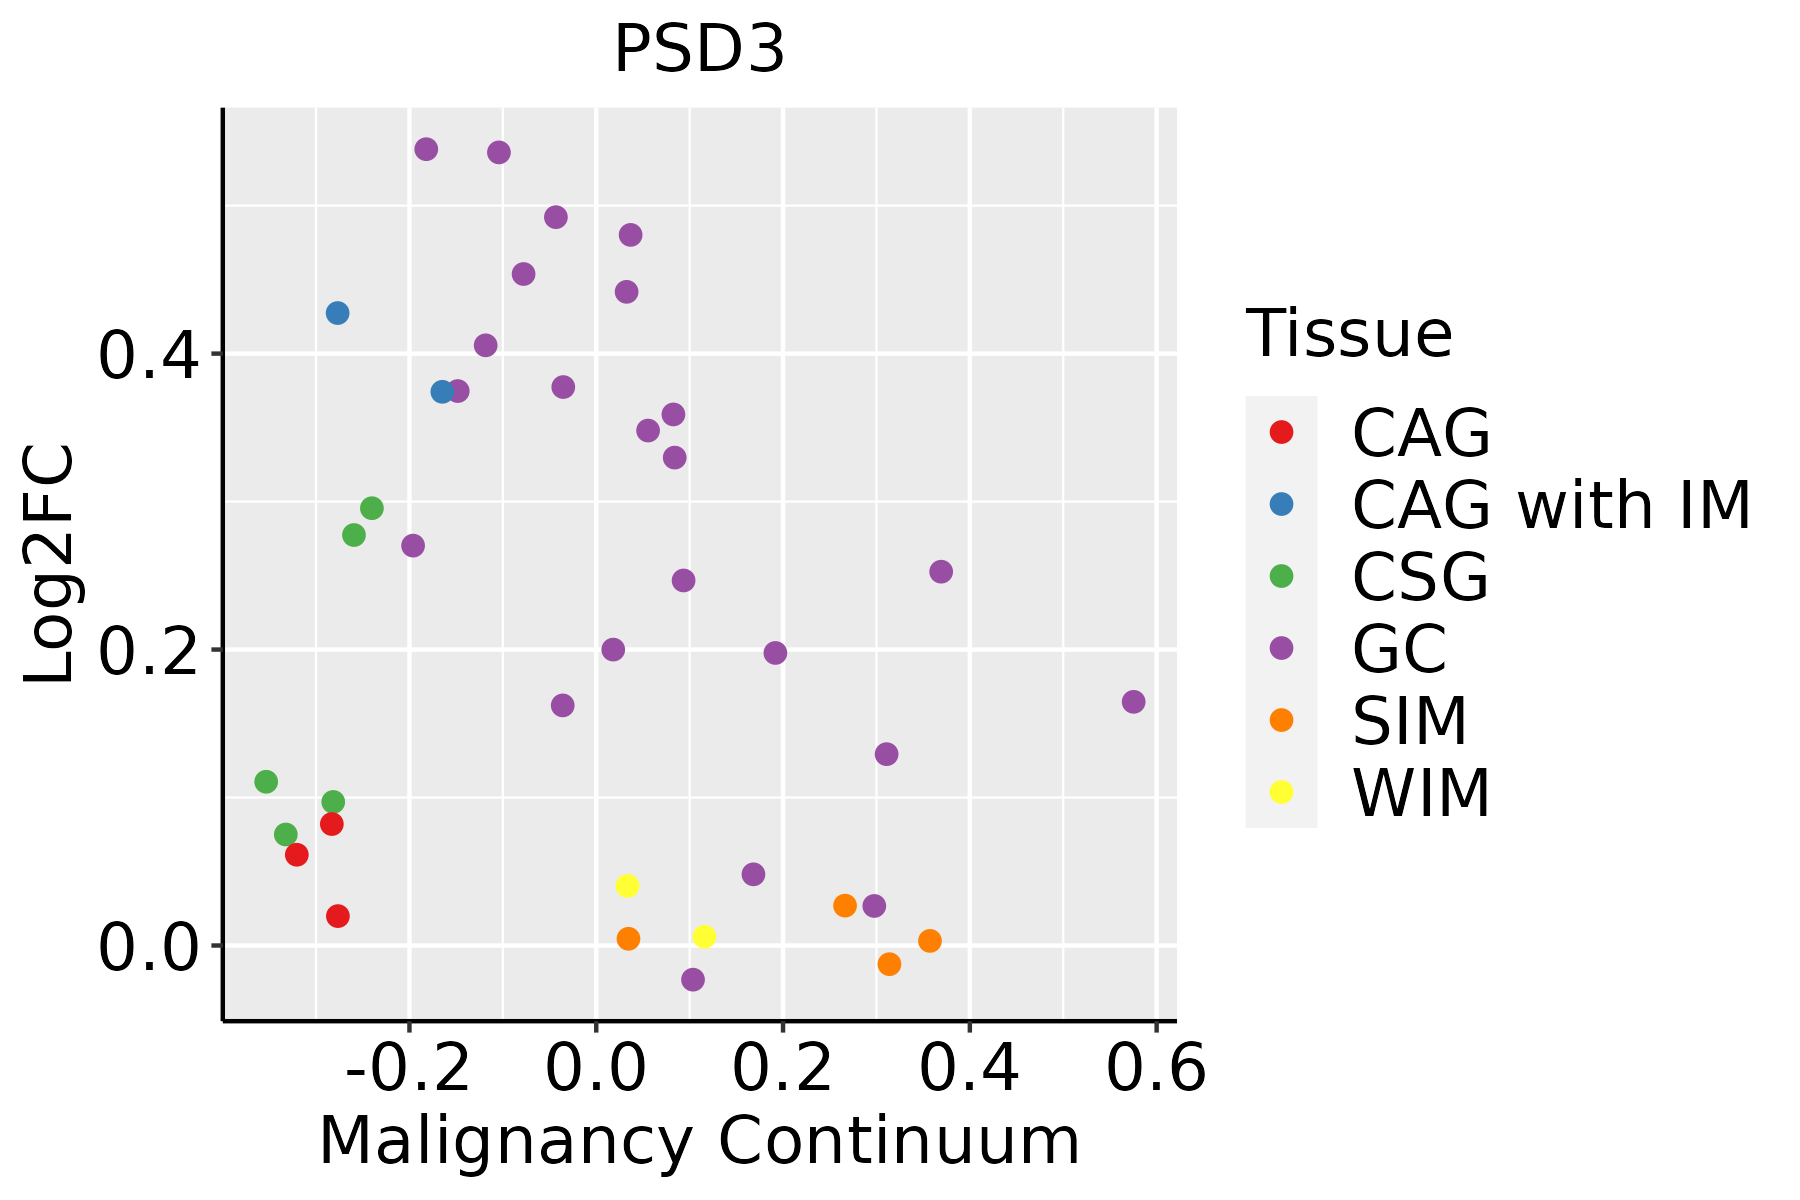 | CAG: Chronic atrophic gastritis |
| CAG with IM: Chronic atrophic gastritis with intestinal metaplasia | ||
| CSG: Chronic superficial gastritis | ||
| GC: Gastric cancer | ||
| SIM: Severe intestinal metaplasia | ||
| WIM: Wild intestinal metaplasia | ||
| Liver | 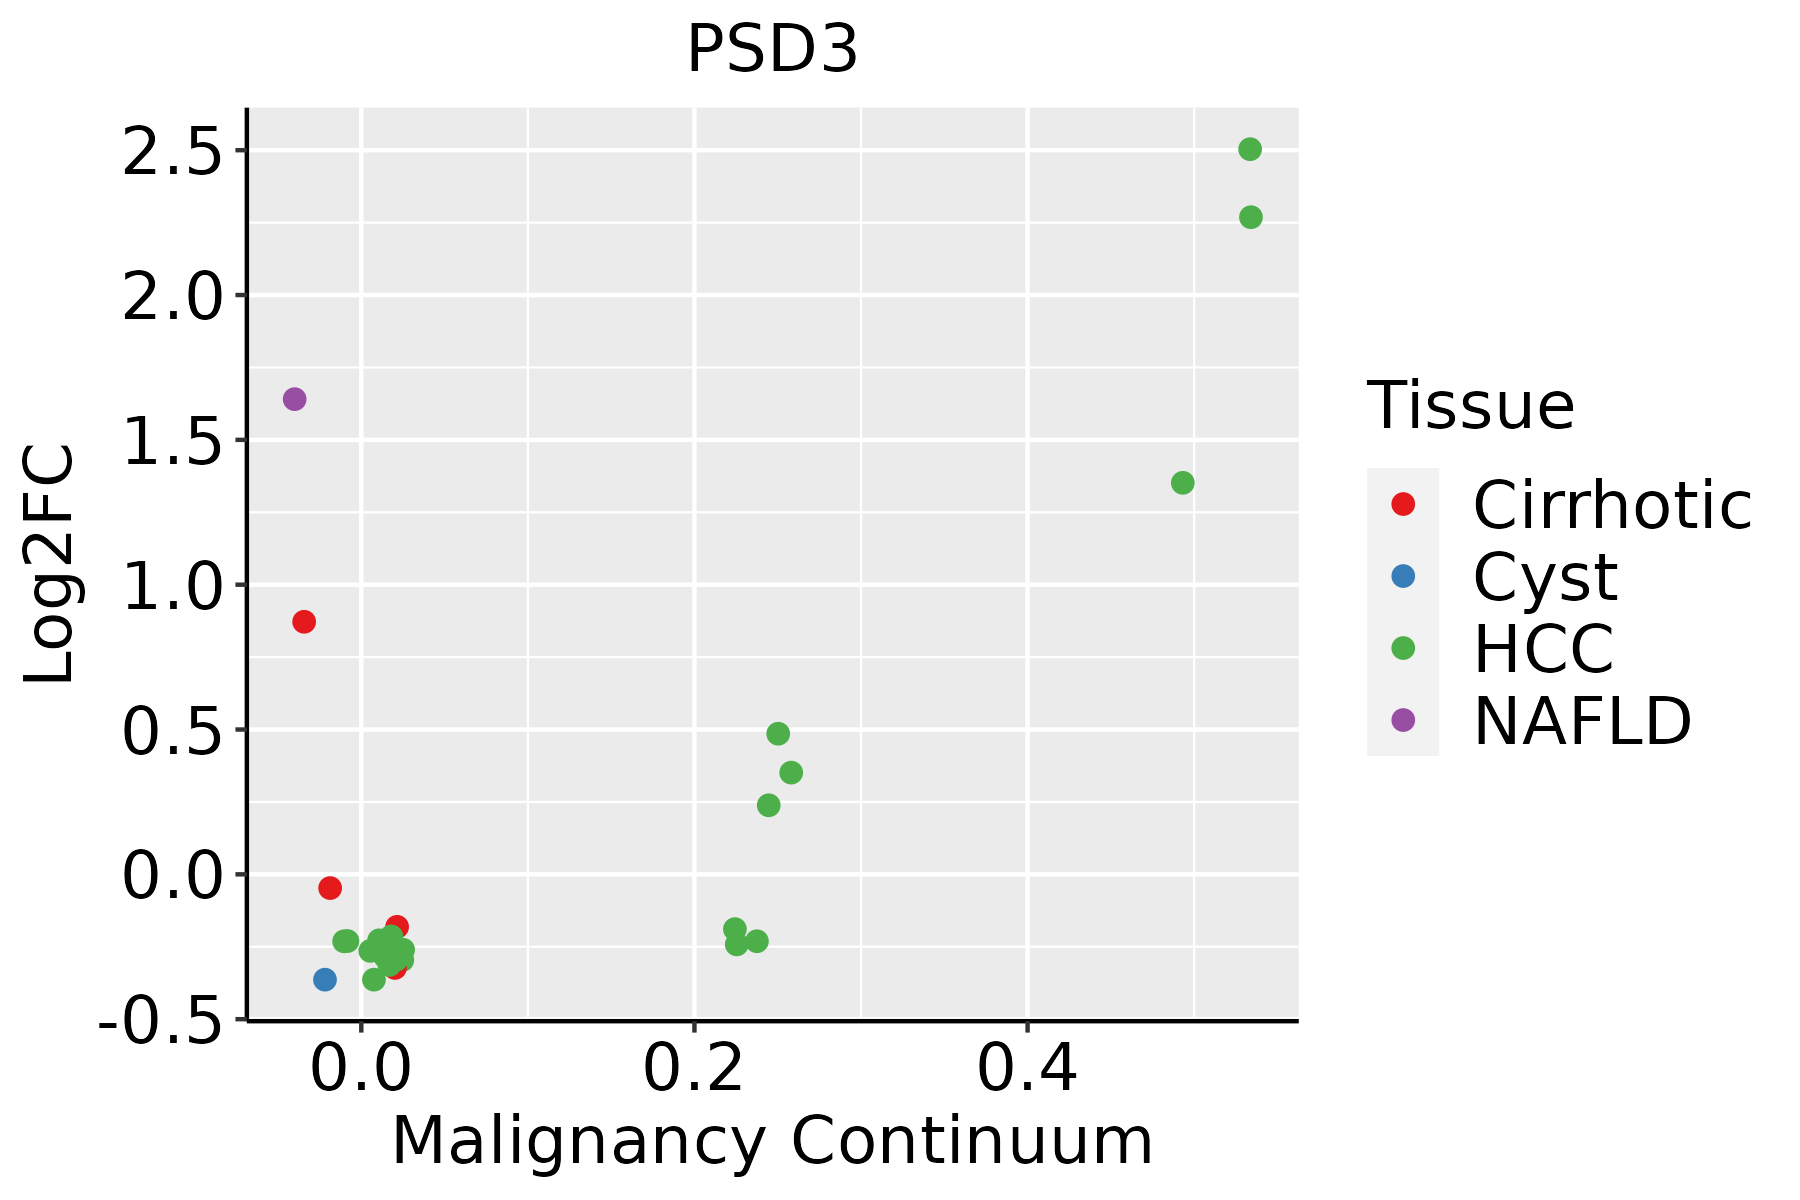 | HCC: Hepatocellular carcinoma |
| NAFLD: Non-alcoholic fatty liver disease | ||
| Lung | 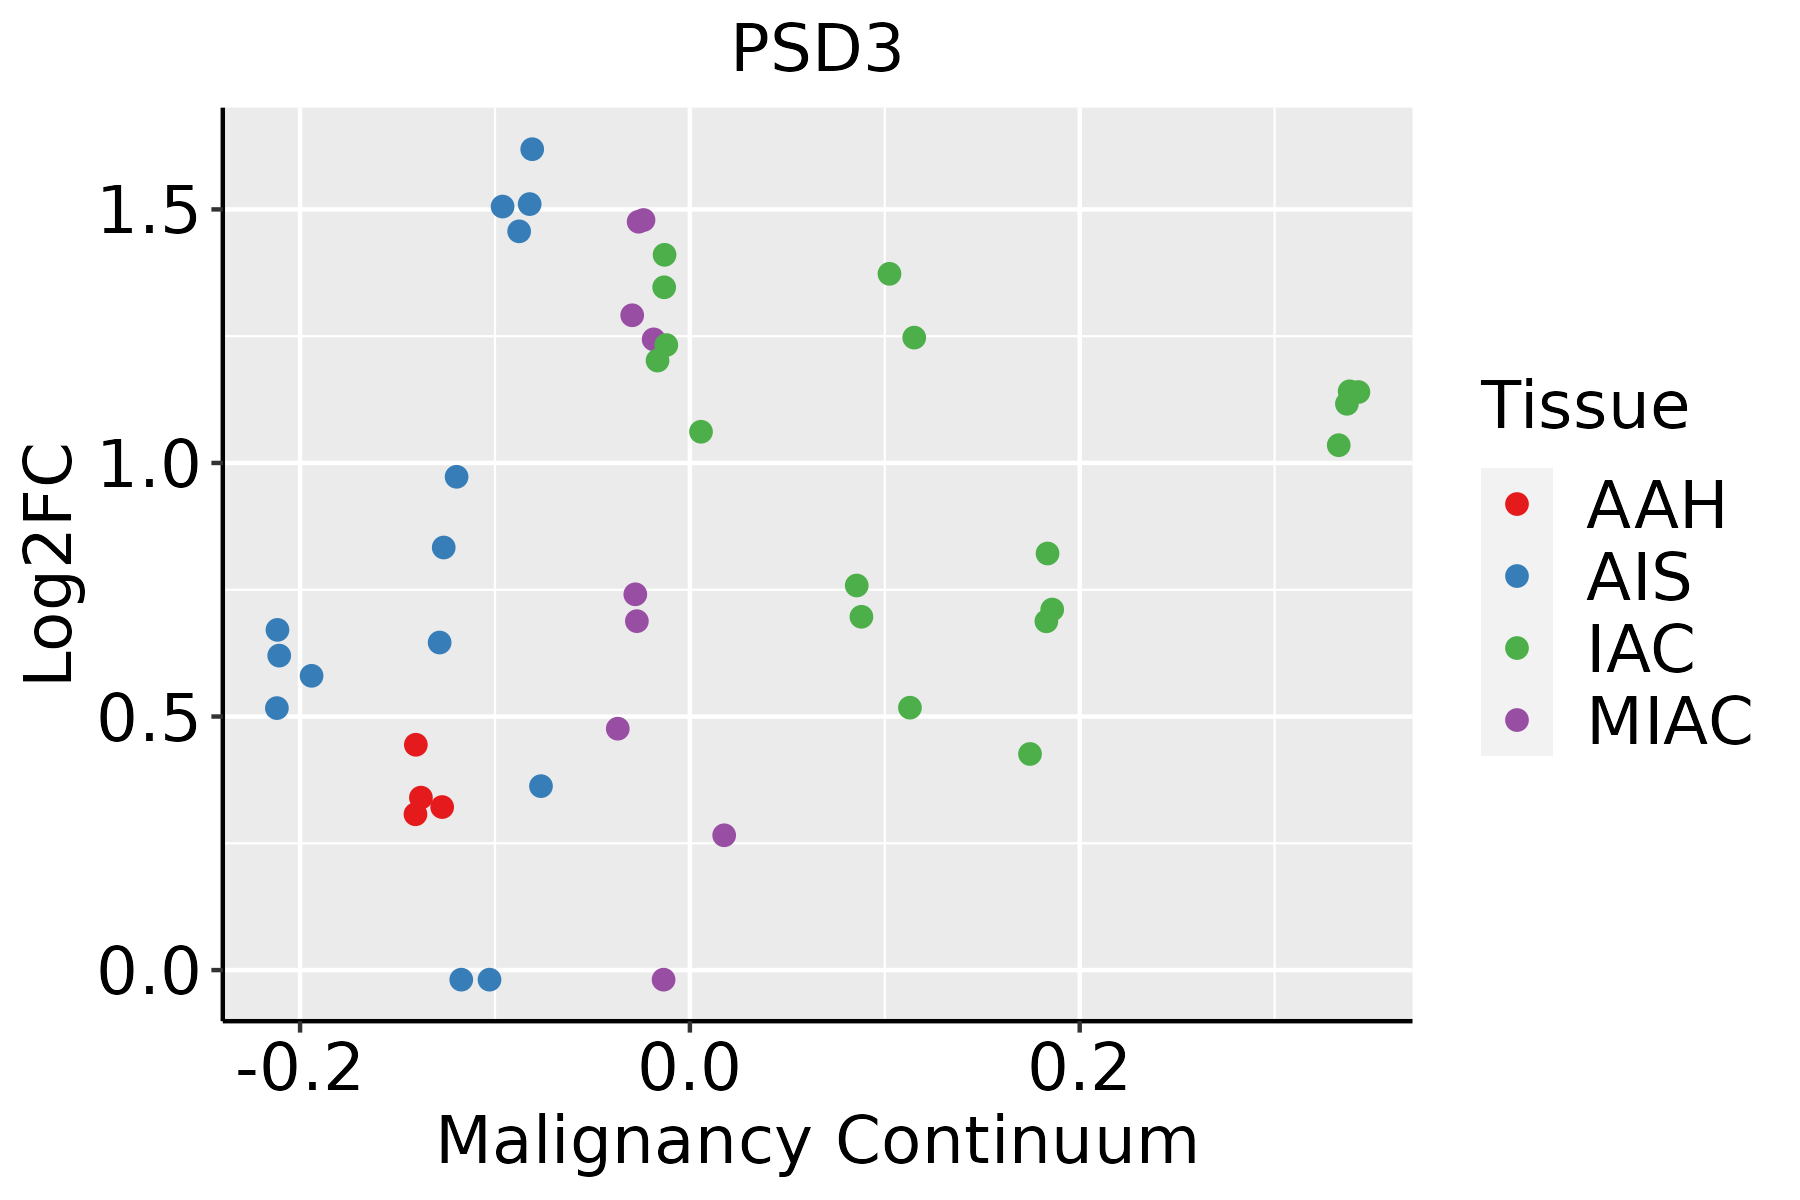 | AAH: Atypical adenomatous hyperplasia |
| AIS: Adenocarcinoma in situ | ||
| IAC: Invasive lung adenocarcinoma | ||
| MIA: Minimally invasive adenocarcinoma | ||
| Oral Cavity |  | EOLP: Erosive Oral lichen planus |
| LP: leukoplakia | ||
| NEOLP: Non-erosive oral lichen planus | ||
| OSCC: Oral squamous cell carcinoma | ||
| Prostate | 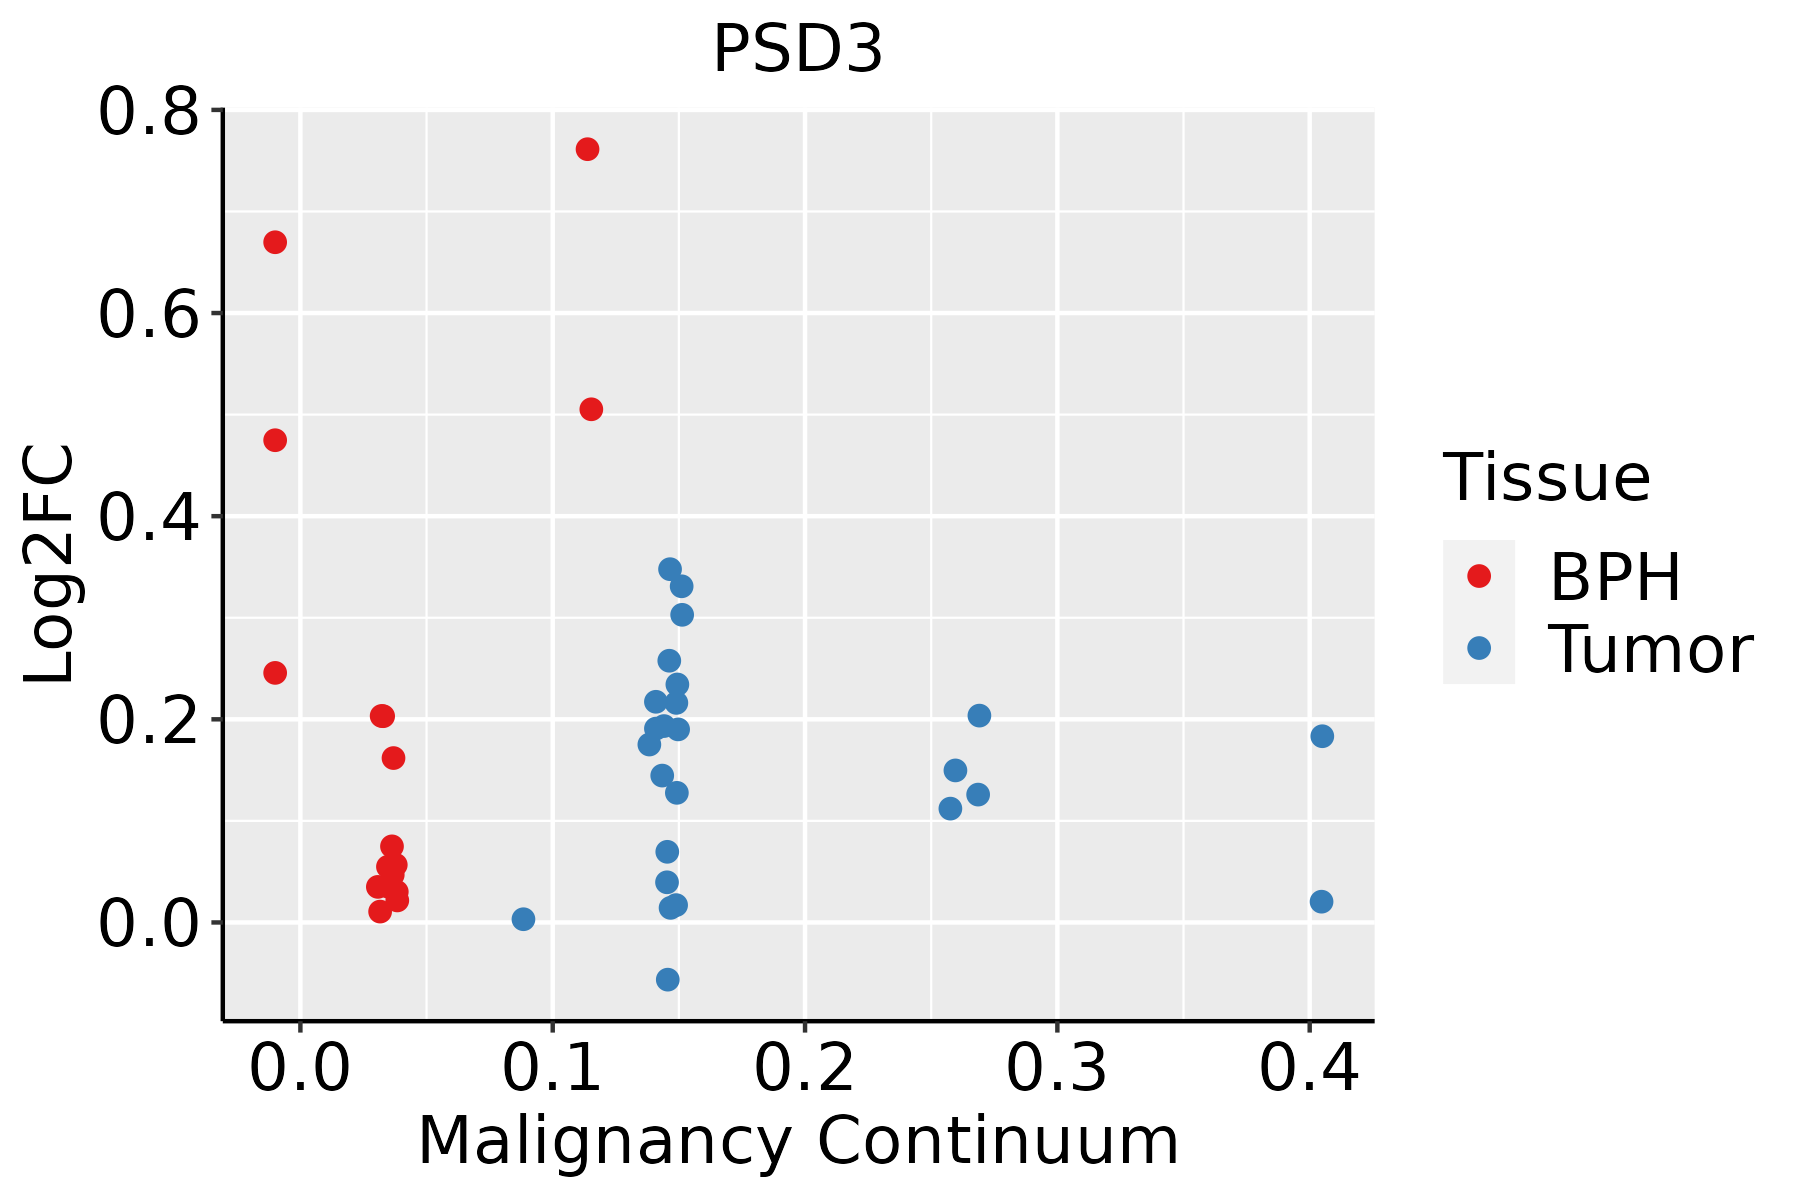 | BPH: Benign Prostatic Hyperplasia |
| Skin | 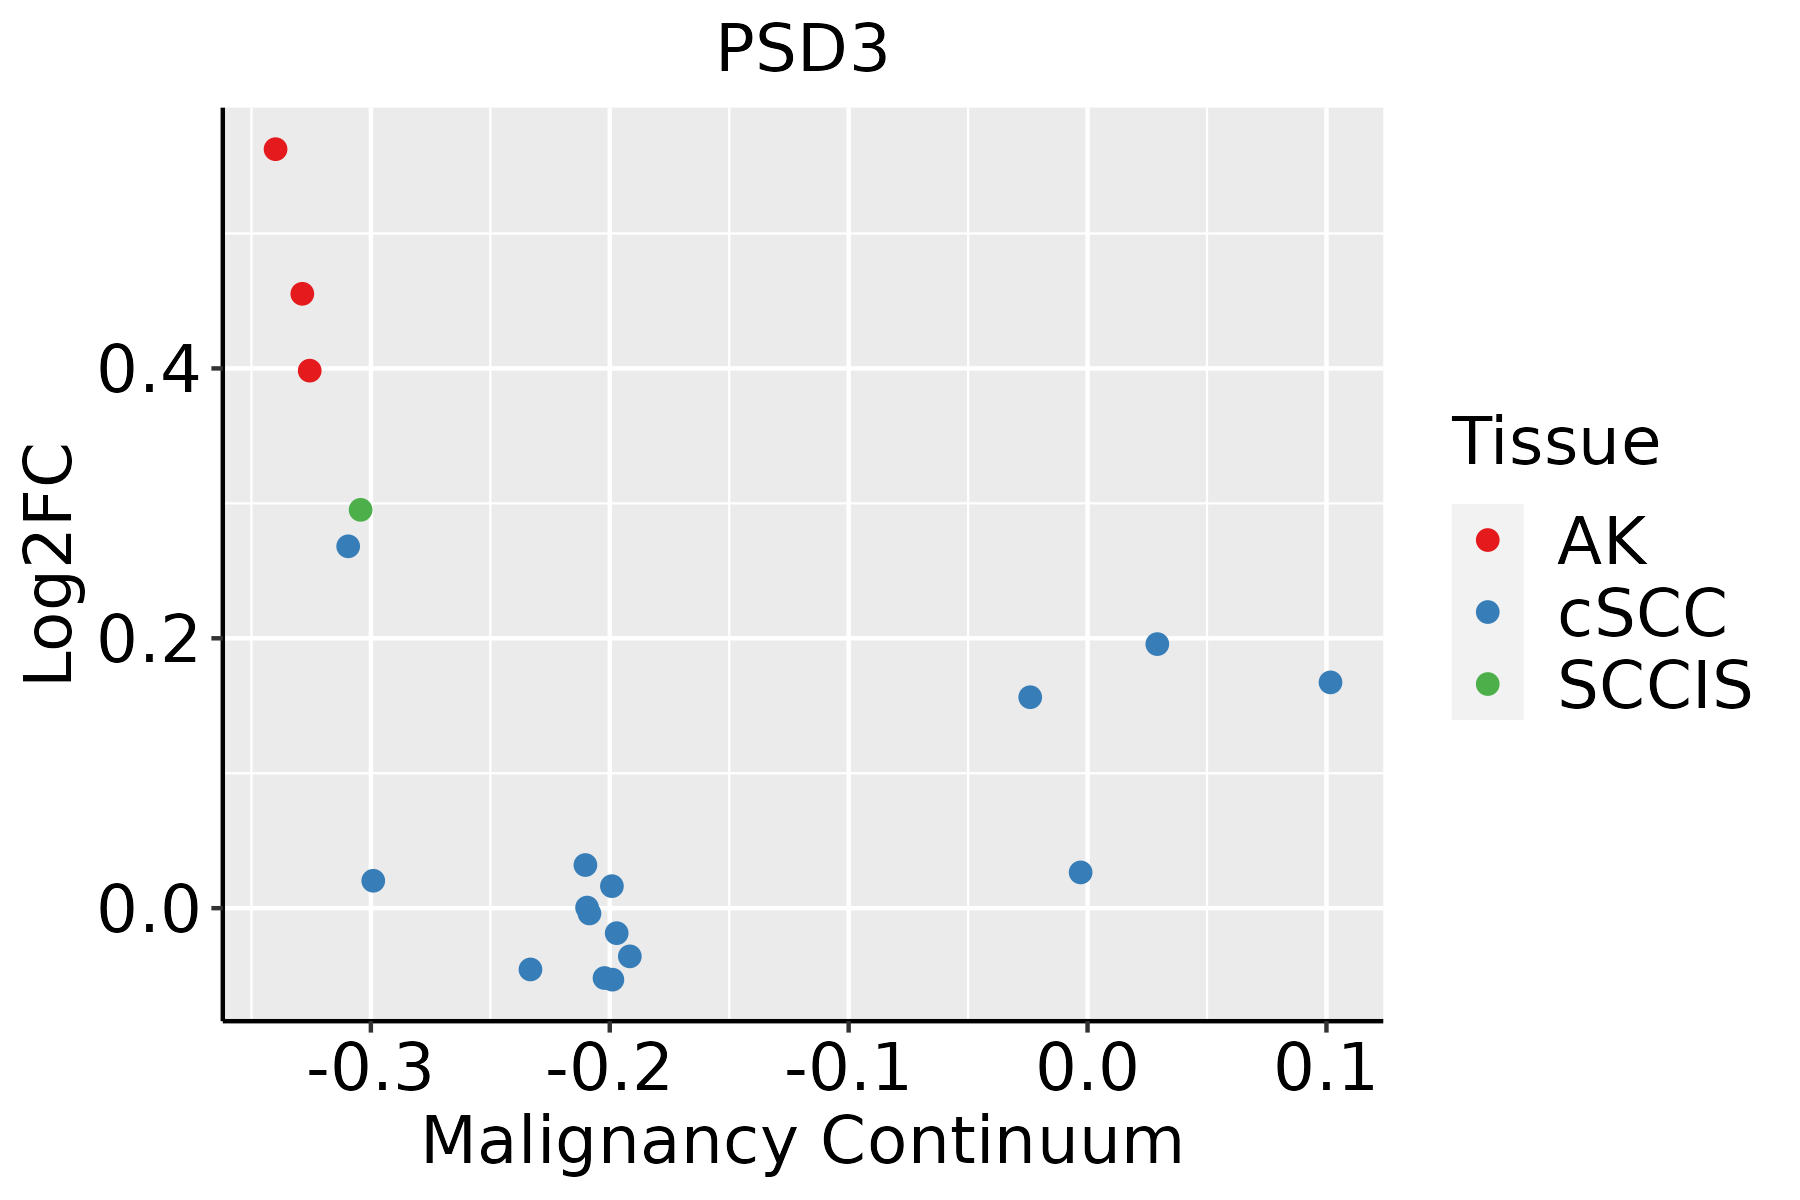 | AK: Actinic keratosis |
| cSCC: Cutaneous squamous cell carcinoma | ||
| SCCIS:squamous cell carcinoma in situ | ||
| Thyroid | 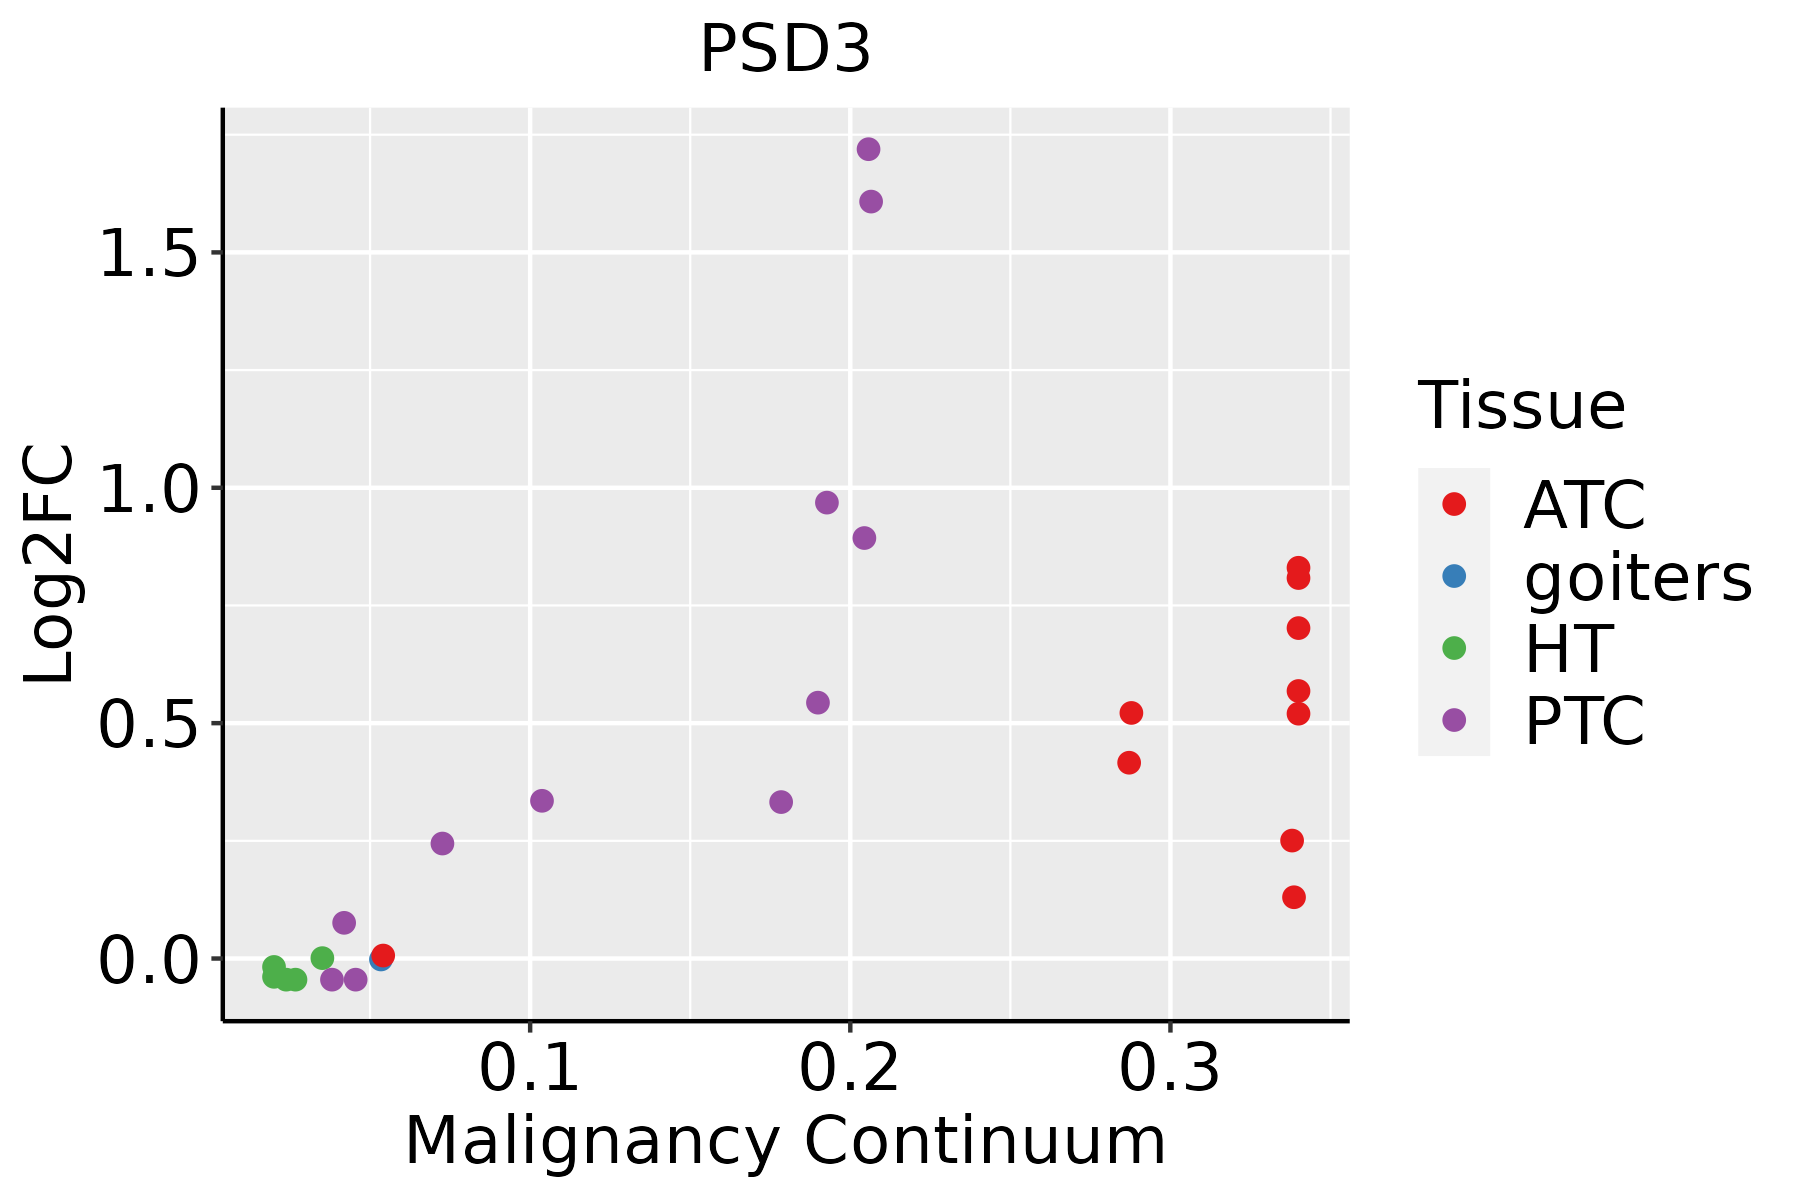 | ATC: Anaplastic thyroid cancer |
| HT: Hashimoto's thyroiditis | ||
| PTC: Papillary thyroid cancer |
| ∗log2FC in expression of this searched gene in stem-like cells from each diseased tissue sample relative to stem-like cells in normal samples in each tissue plotted against the malignancy continuum. Samples are colored based on if they are from different disease stage. |
Top |
Malignant transformation related pathway analysis |
| Find out the enriched GO biological processes and KEGG pathways involved in transition from healthy to precancer to cancer |
| Tissue | Disease Stage | Enriched GO biological Processes |
| Colorectum | AD |  |
| Colorectum | SER |  |
| Colorectum | MSS |  |
| Colorectum | MSI-H |  |
| Colorectum | FAP |  |
| ∗Top 15 enriched GO BP terms are showed in the bar plot of each disease state in each tissue. Each row represents a significant GO biological process which is colored according to the -log10(p.adjust). |
| Page: 1 2 3 4 5 6 7 8 9 |
| GO ID | Tissue | Disease Stage | Description | Gene Ratio | Bg Ratio | pvalue | p.adjust | Count |
| GO:00510566 | Cervix | CC | regulation of small GTPase mediated signal transduction | 75/2311 | 302/18723 | 1.54e-09 | 1.74e-07 | 75 |
| GO:00072656 | Cervix | CC | Ras protein signal transduction | 79/2311 | 337/18723 | 9.49e-09 | 7.77e-07 | 79 |
| GO:00465785 | Cervix | CC | regulation of Ras protein signal transduction | 44/2311 | 189/18723 | 2.05e-05 | 3.73e-04 | 44 |
| GO:0007265 | Colorectum | AD | Ras protein signal transduction | 104/3918 | 337/18723 | 1.01e-05 | 2.35e-04 | 104 |
| GO:0051056 | Colorectum | AD | regulation of small GTPase mediated signal transduction | 94/3918 | 302/18723 | 1.81e-05 | 3.76e-04 | 94 |
| GO:0046578 | Colorectum | AD | regulation of Ras protein signal transduction | 56/3918 | 189/18723 | 2.85e-03 | 2.14e-02 | 56 |
| GO:00072651 | Colorectum | MSS | Ras protein signal transduction | 91/3467 | 337/18723 | 7.20e-05 | 1.21e-03 | 91 |
| GO:00510561 | Colorectum | MSS | regulation of small GTPase mediated signal transduction | 82/3467 | 302/18723 | 1.31e-04 | 1.99e-03 | 82 |
| GO:00510562 | Colorectum | FAP | regulation of small GTPase mediated signal transduction | 78/2622 | 302/18723 | 3.25e-08 | 2.85e-06 | 78 |
| GO:00072652 | Colorectum | FAP | Ras protein signal transduction | 80/2622 | 337/18723 | 9.61e-07 | 4.33e-05 | 80 |
| GO:00465781 | Colorectum | FAP | regulation of Ras protein signal transduction | 47/2622 | 189/18723 | 4.67e-05 | 9.60e-04 | 47 |
| GO:00510563 | Colorectum | CRC | regulation of small GTPase mediated signal transduction | 69/2078 | 302/18723 | 3.34e-09 | 9.08e-07 | 69 |
| GO:00072653 | Colorectum | CRC | Ras protein signal transduction | 70/2078 | 337/18723 | 1.49e-07 | 1.66e-05 | 70 |
| GO:00465782 | Colorectum | CRC | regulation of Ras protein signal transduction | 43/2078 | 189/18723 | 3.26e-06 | 1.47e-04 | 43 |
| GO:00510567 | Endometrium | AEH | regulation of small GTPase mediated signal transduction | 59/2100 | 302/18723 | 1.43e-05 | 3.03e-04 | 59 |
| GO:00072657 | Endometrium | AEH | Ras protein signal transduction | 63/2100 | 337/18723 | 3.09e-05 | 5.66e-04 | 63 |
| GO:00465786 | Endometrium | AEH | regulation of Ras protein signal transduction | 36/2100 | 189/18723 | 1.01e-03 | 8.97e-03 | 36 |
| GO:005105612 | Endometrium | EEC | regulation of small GTPase mediated signal transduction | 61/2168 | 302/18723 | 9.42e-06 | 2.08e-04 | 61 |
| GO:000726513 | Endometrium | EEC | Ras protein signal transduction | 64/2168 | 337/18723 | 4.31e-05 | 7.10e-04 | 64 |
| GO:004657813 | Endometrium | EEC | regulation of Ras protein signal transduction | 37/2168 | 189/18723 | 9.23e-04 | 8.32e-03 | 37 |
| Page: 1 2 3 4 |
| Pathway ID | Tissue | Disease Stage | Description | Gene Ratio | Bg Ratio | pvalue | p.adjust | qvalue | Count |
| hsa0414418 | Cervix | CC | Endocytosis | 64/1267 | 251/8465 | 6.97e-06 | 6.10e-05 | 3.61e-05 | 64 |
| hsa0414419 | Cervix | CC | Endocytosis | 64/1267 | 251/8465 | 6.97e-06 | 6.10e-05 | 3.61e-05 | 64 |
| hsa04144 | Colorectum | AD | Endocytosis | 111/2092 | 251/8465 | 5.95e-12 | 1.42e-10 | 9.08e-11 | 111 |
| hsa041441 | Colorectum | AD | Endocytosis | 111/2092 | 251/8465 | 5.95e-12 | 1.42e-10 | 9.08e-11 | 111 |
| hsa041442 | Colorectum | SER | Endocytosis | 81/1580 | 251/8465 | 1.14e-07 | 2.36e-06 | 1.71e-06 | 81 |
| hsa041443 | Colorectum | SER | Endocytosis | 81/1580 | 251/8465 | 1.14e-07 | 2.36e-06 | 1.71e-06 | 81 |
| hsa041444 | Colorectum | MSS | Endocytosis | 102/1875 | 251/8465 | 1.85e-11 | 4.43e-10 | 2.71e-10 | 102 |
| hsa041445 | Colorectum | MSS | Endocytosis | 102/1875 | 251/8465 | 1.85e-11 | 4.43e-10 | 2.71e-10 | 102 |
| hsa041446 | Colorectum | FAP | Endocytosis | 78/1404 | 251/8465 | 6.20e-09 | 2.96e-07 | 1.80e-07 | 78 |
| hsa041447 | Colorectum | FAP | Endocytosis | 78/1404 | 251/8465 | 6.20e-09 | 2.96e-07 | 1.80e-07 | 78 |
| hsa041448 | Colorectum | CRC | Endocytosis | 65/1091 | 251/8465 | 1.27e-08 | 1.06e-06 | 7.19e-07 | 65 |
| hsa041449 | Colorectum | CRC | Endocytosis | 65/1091 | 251/8465 | 1.27e-08 | 1.06e-06 | 7.19e-07 | 65 |
| hsa0414420 | Endometrium | AEH | Endocytosis | 56/1197 | 251/8465 | 2.58e-04 | 2.15e-03 | 1.57e-03 | 56 |
| hsa04144110 | Endometrium | AEH | Endocytosis | 56/1197 | 251/8465 | 2.58e-04 | 2.15e-03 | 1.57e-03 | 56 |
| hsa0414424 | Endometrium | EEC | Endocytosis | 57/1237 | 251/8465 | 3.34e-04 | 2.82e-03 | 2.10e-03 | 57 |
| hsa0414434 | Endometrium | EEC | Endocytosis | 57/1237 | 251/8465 | 3.34e-04 | 2.82e-03 | 2.10e-03 | 57 |
| hsa04144210 | Esophagus | ESCC | Endocytosis | 186/4205 | 251/8465 | 9.74e-16 | 4.66e-14 | 2.39e-14 | 186 |
| hsa0414437 | Esophagus | ESCC | Endocytosis | 186/4205 | 251/8465 | 9.74e-16 | 4.66e-14 | 2.39e-14 | 186 |
| hsa0414412 | Liver | Cirrhotic | Endocytosis | 119/2530 | 251/8465 | 2.33e-09 | 4.56e-08 | 2.81e-08 | 119 |
| hsa0414413 | Liver | Cirrhotic | Endocytosis | 119/2530 | 251/8465 | 2.33e-09 | 4.56e-08 | 2.81e-08 | 119 |
| Page: 1 2 |
Top |
Cell-cell communication analysis |
| Identification of potential cell-cell interactions between two cell types and their ligand-receptor pairs for different disease states |
| Ligand | Receptor | LRpair | Pathway | Tissue | Disease Stage |
| Page: 1 |
Top |
Single-cell gene regulatory network inference analysis |
| Find out the significant the regulons (TFs) and the target genes of each regulon across cell types for different disease states |
| TF | Cell Type | Tissue | Disease Stage | Target Gene | RSS | Regulon Activity |
| ∗The dot plots of a searched regulon are shown for all cell subpopulations in each disease state of each tissue based on the regulon specific score inferred using pySCENIC and by calculating the average expression. |
| Page: 1 |
Top |
Somatic mutation of malignant transformation related genes |
| Annotation of somatic variants for genes involved in malignant transformation |
| Hugo Symbol | Variant Class | Variant Classification | dbSNP RS | HGVSc | HGVSp | HGVSp Short | SWISSPROT | BIOTYPE | SIFT | PolyPhen | Tumor Sample Barcode | Tissue | Histology | Sex | Age | Stage | Therapy Types | Drugs | Outcome |
| PSD3 | SNV | Missense_Mutation | c.2788N>C | p.Glu930Gln | p.E930Q | Q9NYI0 | protein_coding | deleterious(0.01) | possibly_damaging(0.757) | TCGA-AC-A23H-01 | Breast | breast invasive carcinoma | Female | >=65 | I/II | Unknown | Unknown | PD | |
| PSD3 | SNV | Missense_Mutation | c.1030N>G | p.Leu344Val | p.L344V | Q9NYI0 | protein_coding | tolerated_low_confidence(0.38) | benign(0.018) | TCGA-AC-A23H-01 | Breast | breast invasive carcinoma | Female | >=65 | I/II | Unknown | Unknown | PD | |
| PSD3 | SNV | Missense_Mutation | novel | c.40N>A | p.Val14Met | p.V14M | Q9NYI0 | protein_coding | deleterious_low_confidence(0.01) | benign(0.303) | TCGA-AC-A3QQ-01 | Breast | breast invasive carcinoma | Female | <65 | I/II | Unknown | Unknown | SD |
| PSD3 | SNV | Missense_Mutation | c.718N>A | p.Ala240Thr | p.A240T | Q9NYI0 | protein_coding | tolerated_low_confidence(0.22) | benign(0) | TCGA-BH-A0HF-01 | Breast | breast invasive carcinoma | Female | >=65 | I/II | Hormone Therapy | arimidex | SD | |
| PSD3 | insertion | Nonsense_Mutation | novel | c.1647_1648insTAAACTATTT | p.Lys550Ter | p.K550* | Q9NYI0 | protein_coding | TCGA-AC-A3QQ-01 | Breast | breast invasive carcinoma | Female | <65 | I/II | Unknown | Unknown | SD | ||
| PSD3 | insertion | Frame_Shift_Ins | novel | c.3143_3144insATATATCATTTTTCCTAATTGGTTCTTGACGTGCAGTG | p.Ter1048%3D | p.*1048%3D | Q9NYI0 | protein_coding | TCGA-BH-A0HK-01 | Breast | breast invasive carcinoma | Female | >=65 | I/II | Hormone Therapy | arimidex | SD | ||
| PSD3 | deletion | Frame_Shift_Del | novel | c.2829delC | p.Thr944ProfsTer25 | p.T944Pfs*25 | Q9NYI0 | protein_coding | TCGA-EW-A2FV-01 | Breast | breast invasive carcinoma | Female | <65 | III/IV | Chemotherapy | docetaxel | SD | ||
| PSD3 | SNV | Missense_Mutation | rs201831146 | c.442N>A | p.Gly148Arg | p.G148R | Q9NYI0 | protein_coding | tolerated_low_confidence(0.12) | benign(0.052) | TCGA-C5-A1BQ-01 | Cervix | cervical & endocervical cancer | Female | >=65 | III/IV | Chemotherapy | cisplatin | CR |
| PSD3 | insertion | Frame_Shift_Ins | novel | c.2237_2238insAA | p.Pro748LeufsTer72 | p.P748Lfs*72 | Q9NYI0 | protein_coding | TCGA-2W-A8YY-01 | Cervix | cervical & endocervical cancer | Female | <65 | I/II | Chemotherapy | cisplatin | CR | ||
| PSD3 | SNV | Missense_Mutation | rs753810304 | c.1834N>A | p.Glu612Lys | p.E612K | Q9NYI0 | protein_coding | deleterious(0) | benign(0.418) | TCGA-AA-3510-01 | Colorectum | colon adenocarcinoma | Male | >=65 | I/II | Unknown | Unknown | SD |
| Page: 1 2 3 4 5 6 7 8 9 10 11 12 13 |
Top |
Related drugs of malignant transformation related genes |
| Identification of chemicals and drugs interact with genes involved in malignant transfromation |
| (DGIdb 4.0) |
| Entrez ID | Symbol | Category | Interaction Types | Drug Claim Name | Drug Name | PMIDs |
| Page: 1 |

Copyright 2023-Present -The University of Texas Health Science Center at Houston |