
|
|||||
|
 | |
| |
| |
| |
| |
| |
|
Gene: PSCA |
Gene summary for PSCA |
| Gene information | Species | Human | Gene symbol | PSCA | Gene ID | 8000 |
| Gene name | prostate stem cell antigen | |
| Gene Alias | PRO232 | |
| Cytomap | 8q24.3 | |
| Gene Type | protein-coding | GO ID | GO:0000165 | UniProtAcc | D3DWI6 |
Top |
Malignant transformation analysis |
| Identification of the aberrant gene expression in precancerous and cancerous lesions by comparing the gene expression of stem-like cells in diseased tissues with normal stem cells |
| Entrez ID | Symbol | Replicates | Species | Organ | Tissue | Adj P-value | Log2FC | Malignancy |
| 8000 | PSCA | LZE5T | Human | Esophagus | ESCC | 1.22e-23 | 3.06e+00 | 0.0514 |
| 8000 | PSCA | LZE20T | Human | Esophagus | ESCC | 1.20e-05 | 6.57e-01 | 0.0662 |
| 8000 | PSCA | LZE22D1 | Human | Esophagus | HGIN | 8.03e-04 | 2.47e-01 | 0.0595 |
| 8000 | PSCA | LZE22T | Human | Esophagus | ESCC | 1.15e-08 | 2.49e+00 | 0.068 |
| 8000 | PSCA | LZE24T | Human | Esophagus | ESCC | 5.74e-23 | 2.66e+00 | 0.0596 |
| 8000 | PSCA | P1T-E | Human | Esophagus | ESCC | 7.43e-09 | 1.79e+00 | 0.0875 |
| 8000 | PSCA | P8T-E | Human | Esophagus | ESCC | 9.49e-35 | 2.98e+00 | 0.0889 |
| 8000 | PSCA | P23T-E | Human | Esophagus | ESCC | 1.99e-08 | 8.57e-01 | 0.108 |
| 8000 | PSCA | P39T-E | Human | Esophagus | ESCC | 5.58e-06 | 5.90e-01 | 0.0894 |
| 8000 | PSCA | P54T-E | Human | Esophagus | ESCC | 2.11e-02 | 5.68e-01 | 0.0975 |
| 8000 | PSCA | P65T-E | Human | Esophagus | ESCC | 6.20e-10 | 1.89e+00 | 0.0978 |
| 8000 | PSCA | P74T-E | Human | Esophagus | ESCC | 5.30e-04 | 8.74e-01 | 0.1479 |
| 8000 | PSCA | P75T-E | Human | Esophagus | ESCC | 1.42e-54 | 4.42e+00 | 0.1125 |
| 8000 | PSCA | P82T-E | Human | Esophagus | ESCC | 6.98e-18 | 4.11e+00 | 0.1072 |
| 8000 | PSCA | P83T-E | Human | Esophagus | ESCC | 1.35e-05 | 1.67e-01 | 0.1738 |
| 8000 | PSCA | P84T-E | Human | Esophagus | ESCC | 2.46e-07 | 2.52e+00 | 0.0933 |
| 8000 | PSCA | P94T-E | Human | Esophagus | ESCC | 6.09e-07 | 1.92e+00 | 0.0879 |
| 8000 | PSCA | P104T-E | Human | Esophagus | ESCC | 1.42e-36 | 3.08e+00 | 0.0931 |
| 8000 | PSCA | P127T-E | Human | Esophagus | ESCC | 3.94e-21 | 1.27e+00 | 0.0826 |
| 8000 | PSCA | P128T-E | Human | Esophagus | ESCC | 1.91e-31 | 4.55e+00 | 0.1241 |
| Page: 1 2 3 4 |
| Tissue | Expression Dynamics | Abbreviation |
| Esophagus |  | ESCC: Esophageal squamous cell carcinoma |
| HGIN: High-grade intraepithelial neoplasias | ||
| LGIN: Low-grade intraepithelial neoplasias | ||
| GC |  | CAG: Chronic atrophic gastritis |
| CAG with IM: Chronic atrophic gastritis with intestinal metaplasia | ||
| CSG: Chronic superficial gastritis | ||
| GC: Gastric cancer | ||
| SIM: Severe intestinal metaplasia | ||
| WIM: Wild intestinal metaplasia | ||
| Oral Cavity | 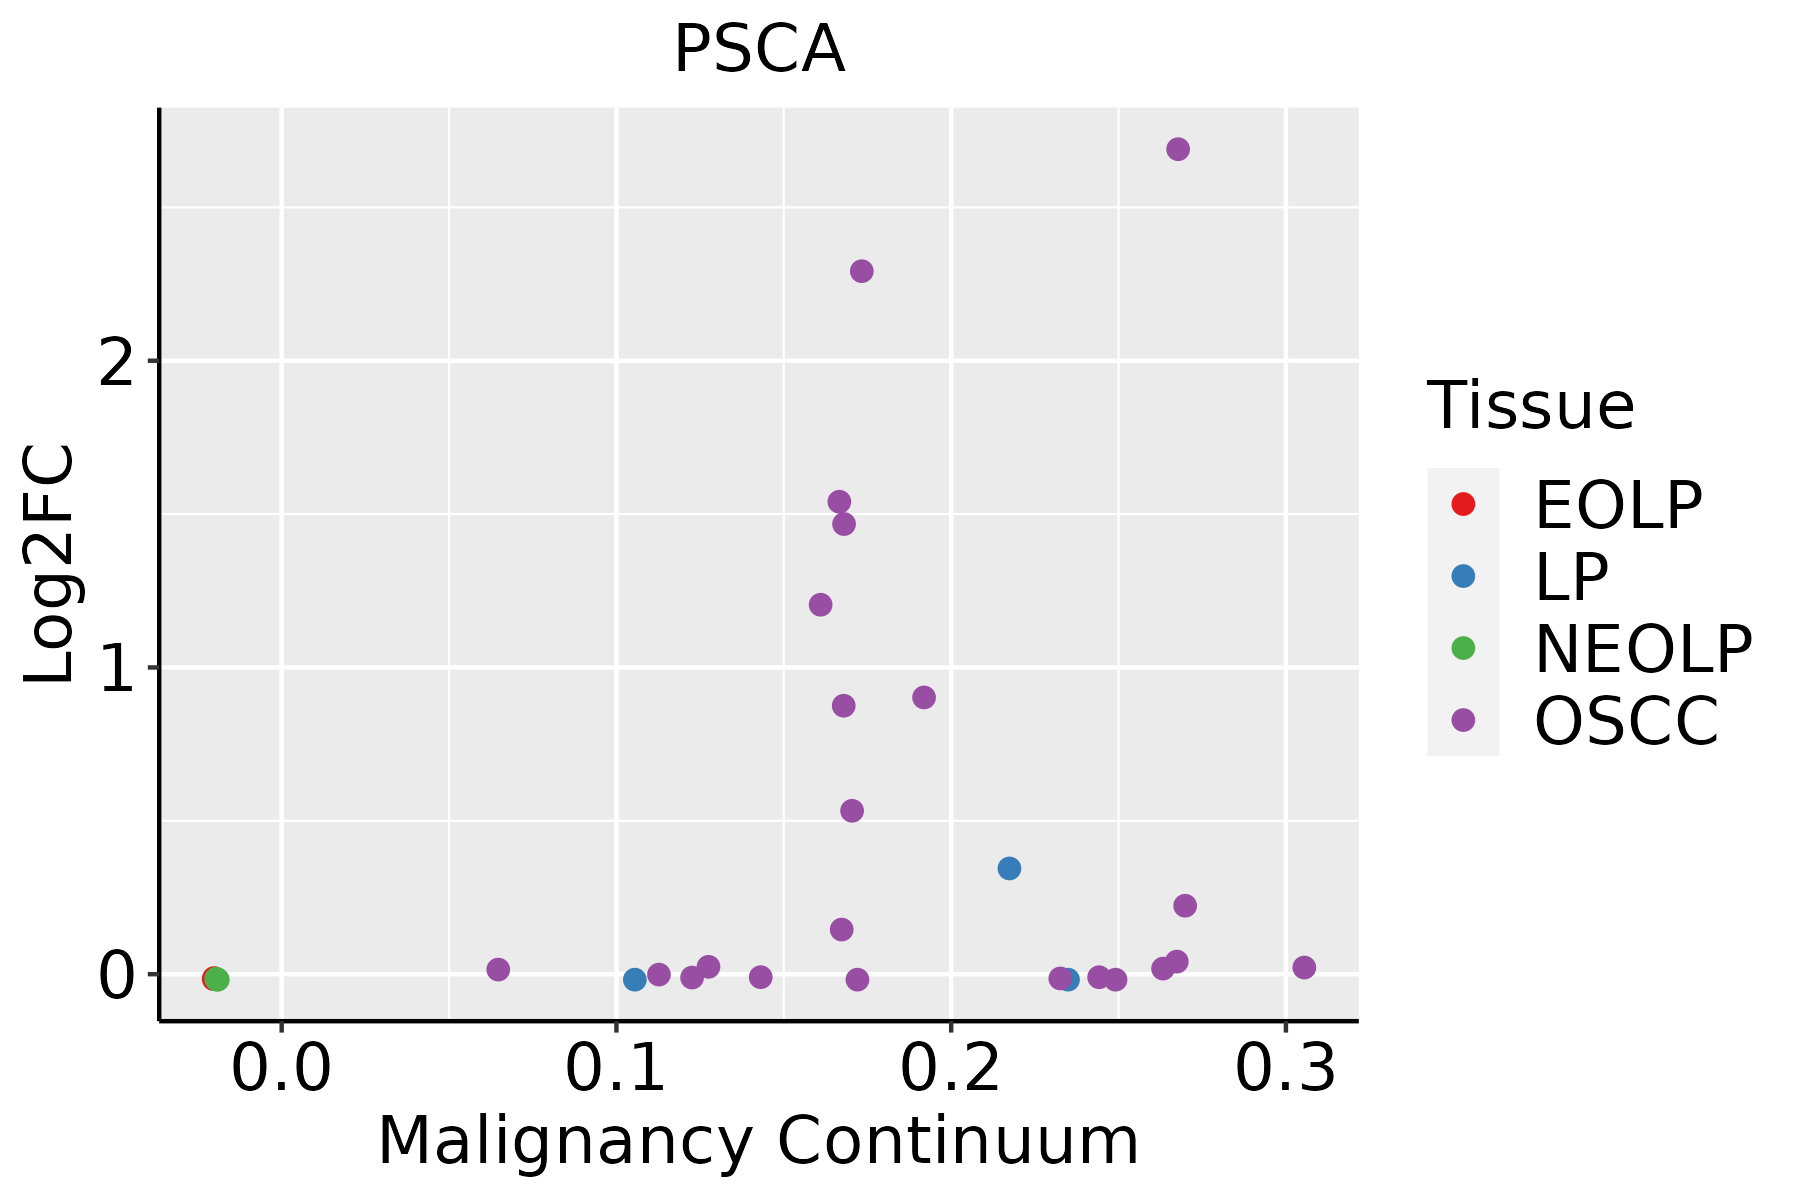 | EOLP: Erosive Oral lichen planus |
| LP: leukoplakia | ||
| NEOLP: Non-erosive oral lichen planus | ||
| OSCC: Oral squamous cell carcinoma | ||
| Prostate | 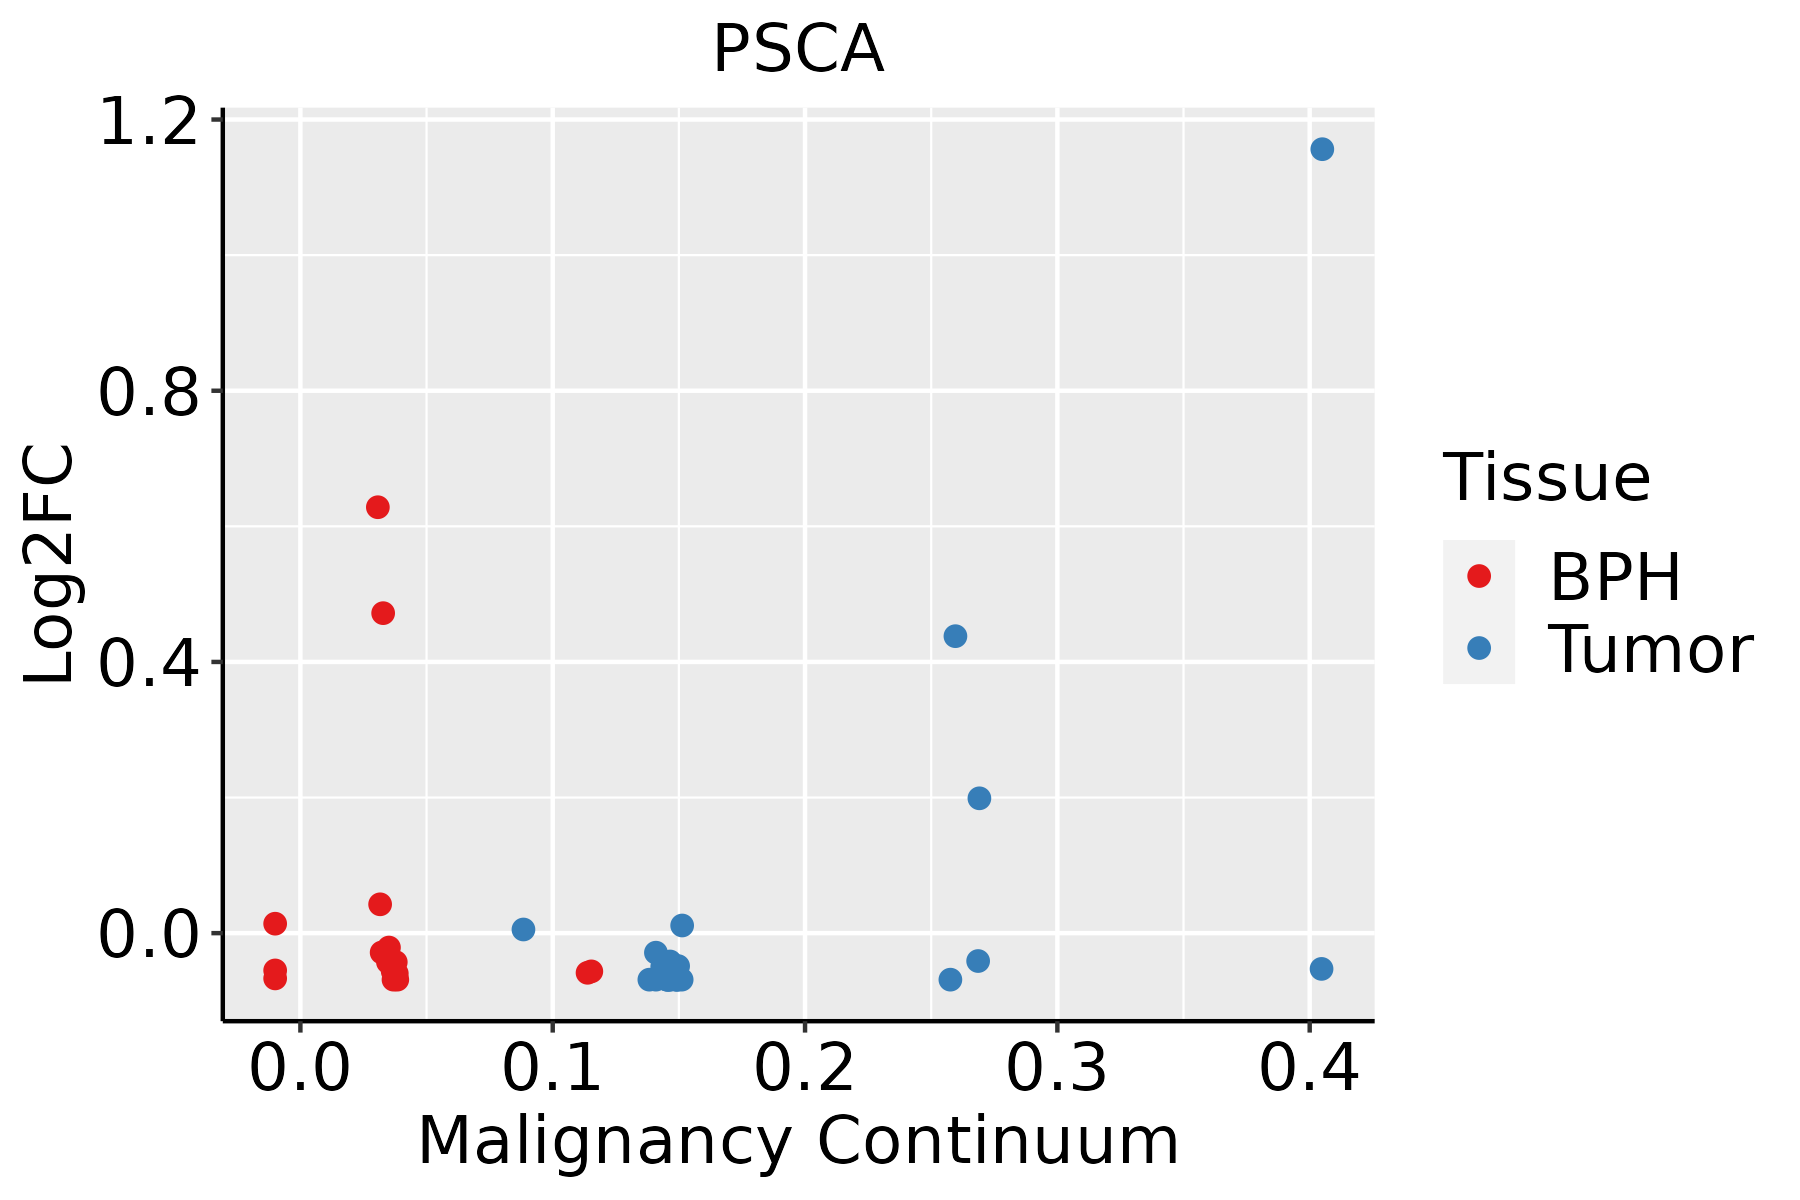 | BPH: Benign Prostatic Hyperplasia |
| ∗log2FC in expression of this searched gene in stem-like cells from each diseased tissue sample relative to stem-like cells in normal samples in each tissue plotted against the malignancy continuum. Samples are colored based on if they are from different disease stage. |
Top |
Malignant transformation related pathway analysis |
| Find out the enriched GO biological processes and KEGG pathways involved in transition from healthy to precancer to cancer |
| Tissue | Disease Stage | Enriched GO biological Processes |
| Colorectum | AD |  |
| Colorectum | SER |  |
| Colorectum | MSS |  |
| Colorectum | MSI-H |  |
| Colorectum | FAP |  |
| ∗Top 15 enriched GO BP terms are showed in the bar plot of each disease state in each tissue. Each row represents a significant GO biological process which is colored according to the -log10(p.adjust). |
| Page: 1 2 3 4 5 6 7 8 9 |
| GO ID | Tissue | Disease Stage | Description | Gene Ratio | Bg Ratio | pvalue | p.adjust | Count |
| GO:004340919 | Esophagus | HGIN | negative regulation of MAPK cascade | 38/2587 | 180/18723 | 4.58e-03 | 3.96e-02 | 38 |
| GO:0043409110 | Esophagus | ESCC | negative regulation of MAPK cascade | 105/8552 | 180/18723 | 4.13e-04 | 2.35e-03 | 105 |
| GO:004340917 | Oral cavity | OSCC | negative regulation of MAPK cascade | 105/7305 | 180/18723 | 1.10e-07 | 1.87e-06 | 105 |
| GO:00703735 | Oral cavity | OSCC | negative regulation of ERK1 and ERK2 cascade | 43/7305 | 78/18723 | 2.80e-03 | 1.22e-02 | 43 |
| GO:00703716 | Oral cavity | OSCC | ERK1 and ERK2 cascade | 150/7305 | 330/18723 | 9.47e-03 | 3.38e-02 | 150 |
| GO:00703724 | Oral cavity | OSCC | regulation of ERK1 and ERK2 cascade | 140/7305 | 309/18723 | 1.34e-02 | 4.46e-02 | 140 |
| GO:004340915 | Prostate | BPH | negative regulation of MAPK cascade | 51/3107 | 180/18723 | 5.20e-05 | 5.35e-04 | 51 |
| GO:00703715 | Prostate | BPH | ERK1 and ERK2 cascade | 74/3107 | 330/18723 | 3.43e-03 | 1.76e-02 | 74 |
| GO:00703734 | Prostate | BPH | negative regulation of ERK1 and ERK2 cascade | 22/3107 | 78/18723 | 6.93e-03 | 3.11e-02 | 22 |
| GO:004340916 | Prostate | Tumor | negative regulation of MAPK cascade | 54/3246 | 180/18723 | 1.92e-05 | 2.50e-04 | 54 |
| GO:007037312 | Prostate | Tumor | negative regulation of ERK1 and ERK2 cascade | 24/3246 | 78/18723 | 2.56e-03 | 1.42e-02 | 24 |
| GO:007037113 | Prostate | Tumor | ERK1 and ERK2 cascade | 76/3246 | 330/18723 | 4.66e-03 | 2.29e-02 | 76 |
| GO:00434096 | Stomach | GC | negative regulation of MAPK cascade | 21/1159 | 180/18723 | 3.86e-03 | 3.26e-02 | 21 |
| GO:004340911 | Stomach | CAG with IM | negative regulation of MAPK cascade | 19/1050 | 180/18723 | 6.02e-03 | 4.63e-02 | 19 |
| GO:004340921 | Stomach | CSG | negative regulation of MAPK cascade | 19/1034 | 180/18723 | 5.12e-03 | 4.17e-02 | 19 |
| Page: 1 |
| Pathway ID | Tissue | Disease Stage | Description | Gene Ratio | Bg Ratio | pvalue | p.adjust | qvalue | Count |
| Page: 1 |
Top |
Cell-cell communication analysis |
| Identification of potential cell-cell interactions between two cell types and their ligand-receptor pairs for different disease states |
| Ligand | Receptor | LRpair | Pathway | Tissue | Disease Stage |
| Page: 1 |
Top |
Single-cell gene regulatory network inference analysis |
| Find out the significant the regulons (TFs) and the target genes of each regulon across cell types for different disease states |
| TF | Cell Type | Tissue | Disease Stage | Target Gene | RSS | Regulon Activity |
| ∗The dot plots of a searched regulon are shown for all cell subpopulations in each disease state of each tissue based on the regulon specific score inferred using pySCENIC and by calculating the average expression. |
| Page: 1 |
Top |
Somatic mutation of malignant transformation related genes |
| Annotation of somatic variants for genes involved in malignant transformation |
| Hugo Symbol | Variant Class | Variant Classification | dbSNP RS | HGVSc | HGVSp | HGVSp Short | SWISSPROT | BIOTYPE | SIFT | PolyPhen | Tumor Sample Barcode | Tissue | Histology | Sex | Age | Stage | Therapy Types | Drugs | Outcome |
| PSCA | SNV | Missense_Mutation | rs782528619 | c.127N>T | p.Arg43Cys | p.R43C | O43653 | protein_coding | deleterious(0.03) | possibly_damaging(0.871) | TCGA-BH-A0HA-01 | Breast | breast invasive carcinoma | Female | <65 | I/II | Unknown | Unknown | SD |
| PSCA | insertion | Nonsense_Mutation | novel | c.121_122insGTTTTTCAGGTTAACTT | p.Thr41SerfsTer5 | p.T41Sfs*5 | O43653 | protein_coding | TCGA-A2-A0CP-01 | Breast | breast invasive carcinoma | Female | <65 | I/II | Chemotherapy | cytoxan | SD | ||
| PSCA | SNV | Missense_Mutation | c.125C>T | p.Ala42Val | p.A42V | O43653 | protein_coding | deleterious(0.02) | benign(0.003) | TCGA-A6-A565-01 | Colorectum | colon adenocarcinoma | Female | <65 | III/IV | Unspecific | 5FU | PD | |
| PSCA | SNV | Missense_Mutation | c.191N>G | p.Asp64Gly | p.D64G | O43653 | protein_coding | tolerated(0.09) | benign(0.013) | TCGA-AA-A01R-01 | Colorectum | colon adenocarcinoma | Male | <65 | III/IV | Chemotherapy | 5-fluorouracil | PD | |
| PSCA | SNV | Missense_Mutation | novel | c.332C>A | p.Pro111His | p.P111H | O43653 | protein_coding | deleterious(0.03) | possibly_damaging(0.536) | TCGA-D1-A163-01 | Endometrium | uterine corpus endometrioid carcinoma | Female | <65 | III/IV | Chemotherapy | taxol | SD |
| PSCA | SNV | Missense_Mutation | novel | c.242N>G | p.Asp81Gly | p.D81G | O43653 | protein_coding | deleterious(0.01) | possibly_damaging(0.664) | TCGA-EO-A22R-01 | Endometrium | uterine corpus endometrioid carcinoma | Female | <65 | I/II | Unknown | Unknown | SD |
| PSCA | SNV | Missense_Mutation | novel | c.257N>T | p.Ser86Ile | p.S86I | O43653 | protein_coding | deleterious(0) | possibly_damaging(0.601) | TCGA-NJ-A4YQ-01 | Lung | lung adenocarcinoma | Female | >=65 | I/II | Unknown | Unknown | SD |
| PSCA | SNV | Missense_Mutation | novel | c.259N>A | p.Gly87Arg | p.G87R | O43653 | protein_coding | tolerated(0.22) | benign(0.078) | TCGA-37-A5EL-01 | Lung | lung squamous cell carcinoma | Male | <65 | I/II | Chemotherapy | temodal | PD |
| PSCA | SNV | Missense_Mutation | novel | c.248G>A | p.Cys83Tyr | p.C83Y | O43653 | protein_coding | deleterious(0) | probably_damaging(0.998) | TCGA-CR-6472-01 | Oral cavity | head & neck squamous cell carcinoma | Male | <65 | I/II | Chemotherapy | paclitaxel | SD |
| PSCA | SNV | Missense_Mutation | c.313N>T | p.Gly105Cys | p.G105C | O43653 | protein_coding | deleterious(0.04) | possibly_damaging(0.682) | TCGA-CV-A45V-01 | Oral cavity | head & neck squamous cell carcinoma | Female | >=65 | I/II | Unknown | Unknown | SD |
| Page: 1 2 |
Top |
Related drugs of malignant transformation related genes |
| Identification of chemicals and drugs interact with genes involved in malignant transfromation |
| (DGIdb 4.0) |
| Entrez ID | Symbol | Category | Interaction Types | Drug Claim Name | Drug Name | PMIDs |
| 8000 | PSCA | DRUGGABLE GENOME | CAR-T Cells targeting PSCA | |||
| 8000 | PSCA | DRUGGABLE GENOME | CAR-T cells targeting PSCA | |||
| 8000 | PSCA | DRUGGABLE GENOME | AGS-PSCA | MK-4721 | ||
| 8000 | PSCA | DRUGGABLE GENOME | BPX-601 | |||
| 8000 | PSCA | DRUGGABLE GENOME | Anti-PSCA mab | |||
| 8000 | PSCA | DRUGGABLE GENOME | AGS-1C4D4 |
| Page: 1 |

Copyright 2023-Present -The University of Texas Health Science Center at Houston |