
|
|||||
|
 | |
| |
| |
| |
| |
| |
|
Gene: PSAT1 |
Gene summary for PSAT1 |
| Gene information | Species | Human | Gene symbol | PSAT1 | Gene ID | 29968 |
| Gene name | phosphoserine aminotransferase 1 | |
| Gene Alias | EPIP | |
| Cytomap | 9q21.2 | |
| Gene Type | protein-coding | GO ID | GO:0006082 | UniProtAcc | A0A024R280 |
Top |
Malignant transformation analysis |
| Identification of the aberrant gene expression in precancerous and cancerous lesions by comparing the gene expression of stem-like cells in diseased tissues with normal stem cells |
| Entrez ID | Symbol | Replicates | Species | Organ | Tissue | Adj P-value | Log2FC | Malignancy |
| 29968 | PSAT1 | AEH-subject5 | Human | Endometrium | AEH | 3.87e-12 | 4.48e-01 | -0.2953 |
| 29968 | PSAT1 | EEC-subject3 | Human | Endometrium | EEC | 3.95e-03 | 1.32e-01 | -0.2525 |
| 29968 | PSAT1 | GSM5276935 | Human | Endometrium | EEC | 1.20e-18 | 5.15e-01 | -0.123 |
| 29968 | PSAT1 | GSM6177620_NYU_UCEC1_lib3_lib3 | Human | Endometrium | EEC | 6.54e-05 | 3.21e-01 | -0.1883 |
| 29968 | PSAT1 | GSM6177622_NYU_UCEC3_lib1_lib1 | Human | Endometrium | EEC | 3.62e-13 | 4.80e-01 | -0.1917 |
| 29968 | PSAT1 | GSM6177622_NYU_UCEC3_lib2_lib2 | Human | Endometrium | EEC | 6.56e-07 | 3.76e-01 | -0.1916 |
| 29968 | PSAT1 | GSM6177623_NYU_UCEC3_Vis | Human | Endometrium | EEC | 1.23e-15 | 5.35e-01 | -0.1269 |
| 29968 | PSAT1 | LZE4T | Human | Esophagus | ESCC | 4.18e-11 | 5.37e-01 | 0.0811 |
| 29968 | PSAT1 | LZE24T | Human | Esophagus | ESCC | 2.60e-12 | 6.80e-01 | 0.0596 |
| 29968 | PSAT1 | LZE21T | Human | Esophagus | ESCC | 2.47e-03 | 6.40e-01 | 0.0655 |
| 29968 | PSAT1 | LZE6T | Human | Esophagus | ESCC | 4.67e-02 | 1.65e-01 | 0.0845 |
| 29968 | PSAT1 | P2T-E | Human | Esophagus | ESCC | 4.79e-43 | 1.15e+00 | 0.1177 |
| 29968 | PSAT1 | P4T-E | Human | Esophagus | ESCC | 3.01e-30 | 1.16e+00 | 0.1323 |
| 29968 | PSAT1 | P5T-E | Human | Esophagus | ESCC | 7.43e-06 | 4.12e-01 | 0.1327 |
| 29968 | PSAT1 | P9T-E | Human | Esophagus | ESCC | 9.12e-11 | 3.45e-01 | 0.1131 |
| 29968 | PSAT1 | P10T-E | Human | Esophagus | ESCC | 3.83e-35 | 9.89e-01 | 0.116 |
| 29968 | PSAT1 | P11T-E | Human | Esophagus | ESCC | 5.45e-04 | 3.68e-01 | 0.1426 |
| 29968 | PSAT1 | P12T-E | Human | Esophagus | ESCC | 1.11e-37 | 1.03e+00 | 0.1122 |
| 29968 | PSAT1 | P15T-E | Human | Esophagus | ESCC | 1.10e-22 | 7.19e-01 | 0.1149 |
| 29968 | PSAT1 | P16T-E | Human | Esophagus | ESCC | 2.90e-26 | 7.28e-01 | 0.1153 |
| Page: 1 2 3 4 5 6 |
| Tissue | Expression Dynamics | Abbreviation |
| Endometrium |  | AEH: Atypical endometrial hyperplasia |
| EEC: Endometrioid Cancer | ||
| Esophagus | 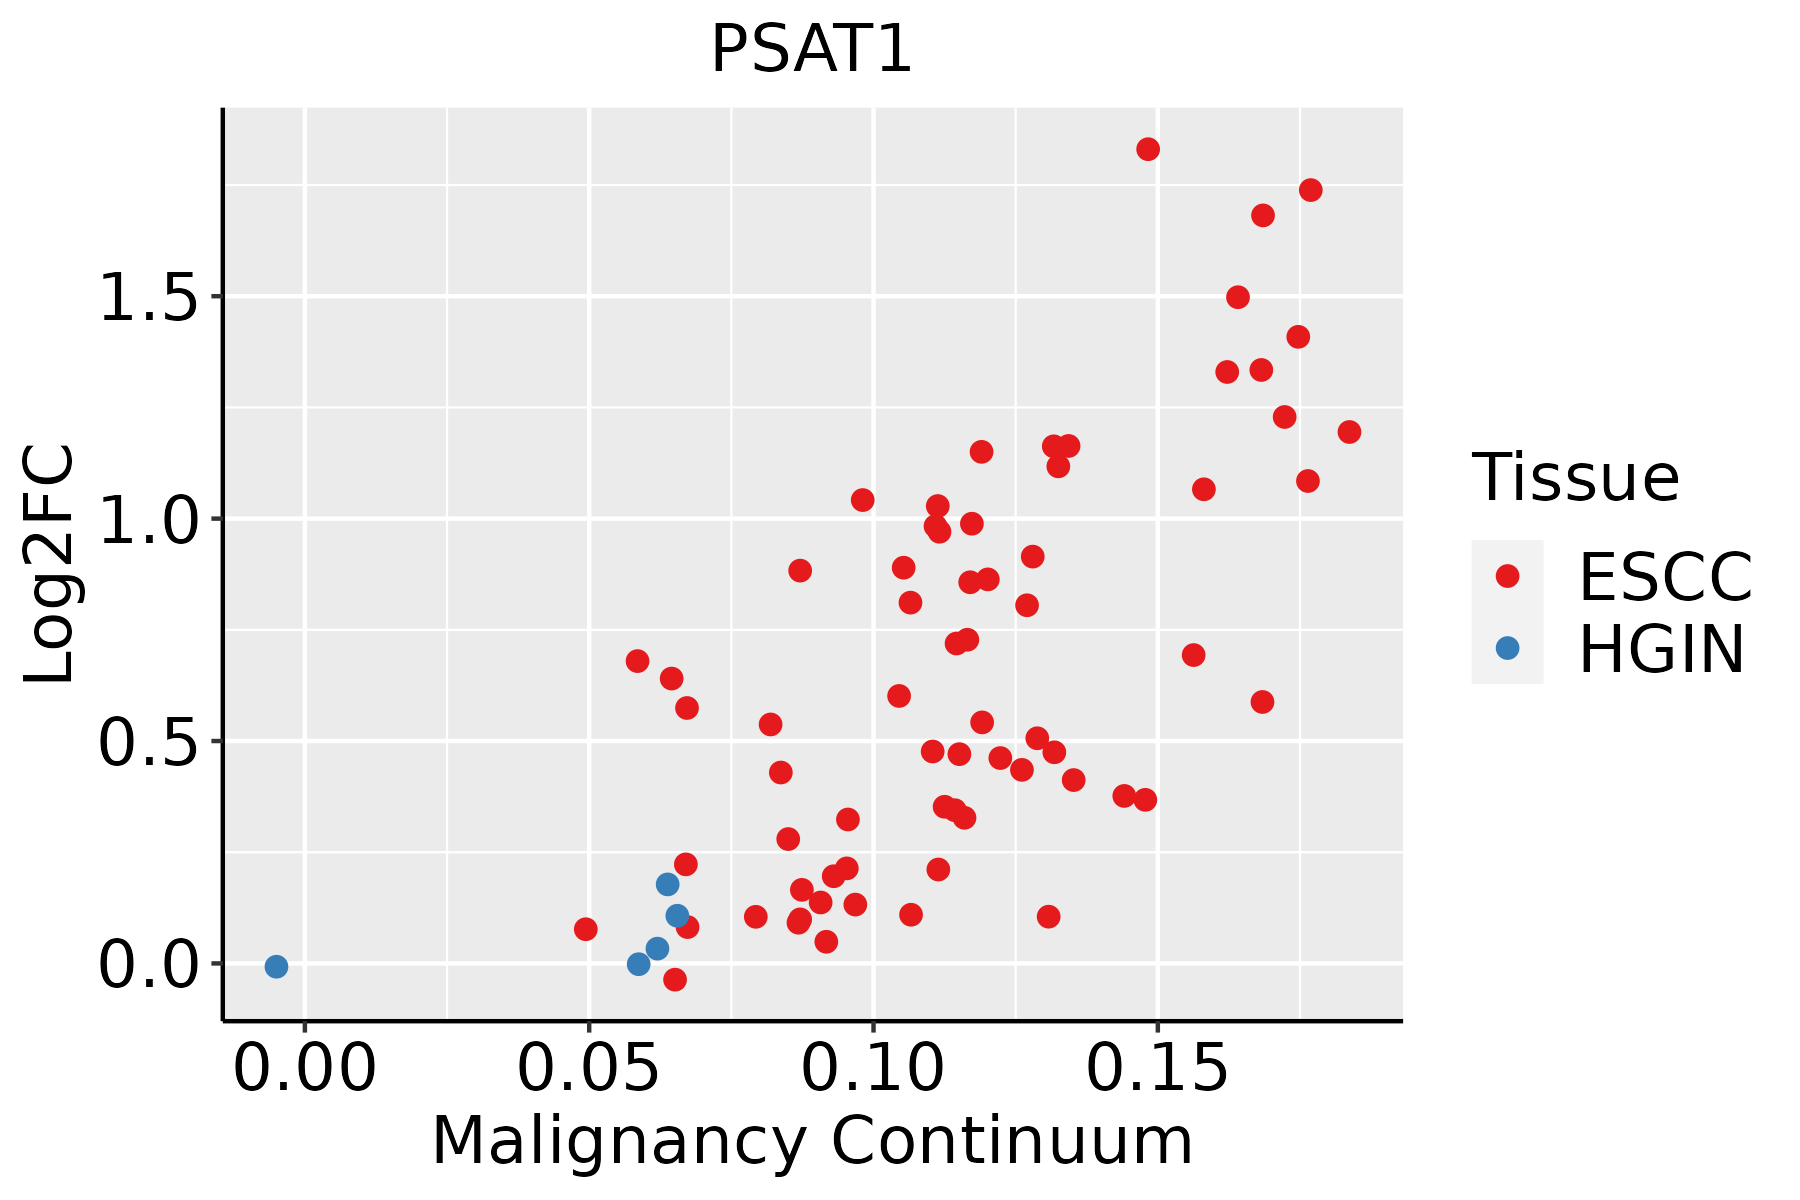 | ESCC: Esophageal squamous cell carcinoma |
| HGIN: High-grade intraepithelial neoplasias | ||
| LGIN: Low-grade intraepithelial neoplasias | ||
| Liver | 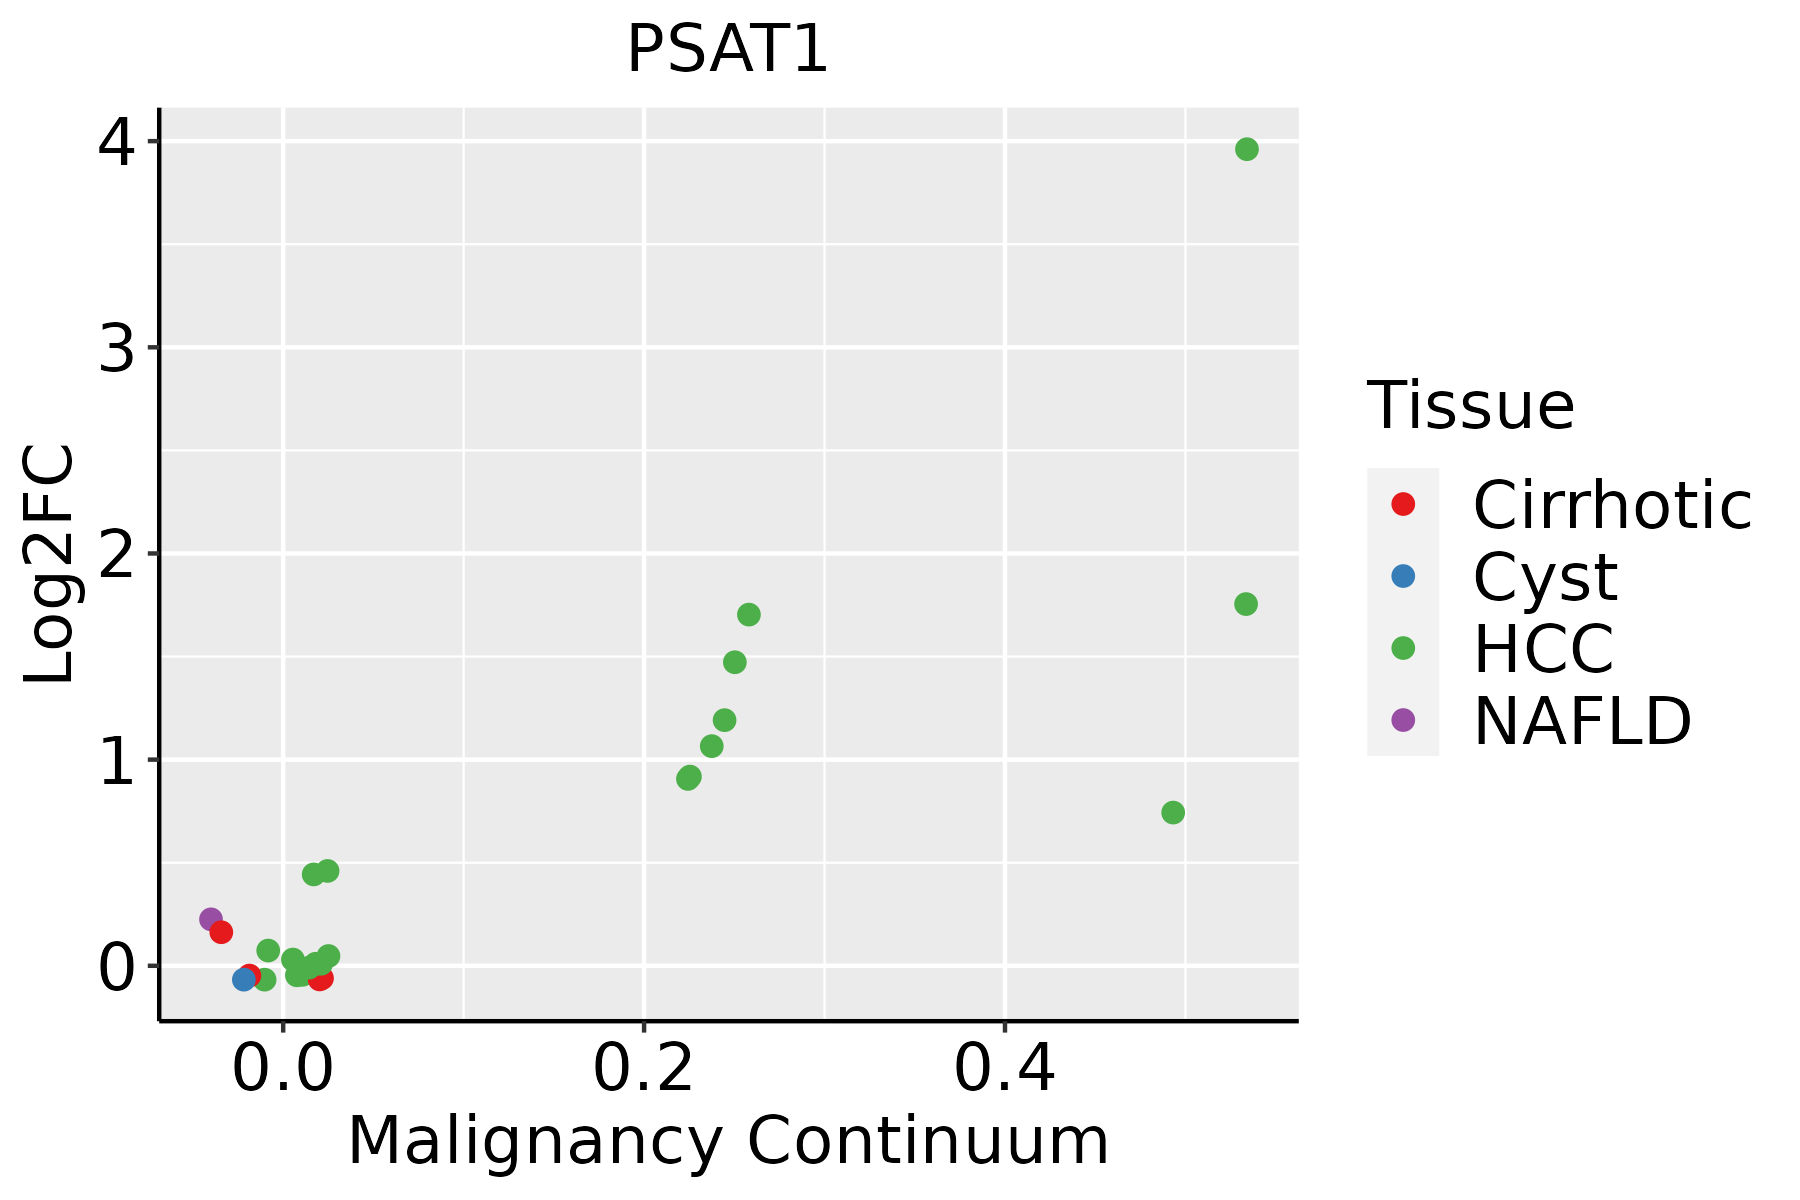 | HCC: Hepatocellular carcinoma |
| NAFLD: Non-alcoholic fatty liver disease | ||
| Oral Cavity | 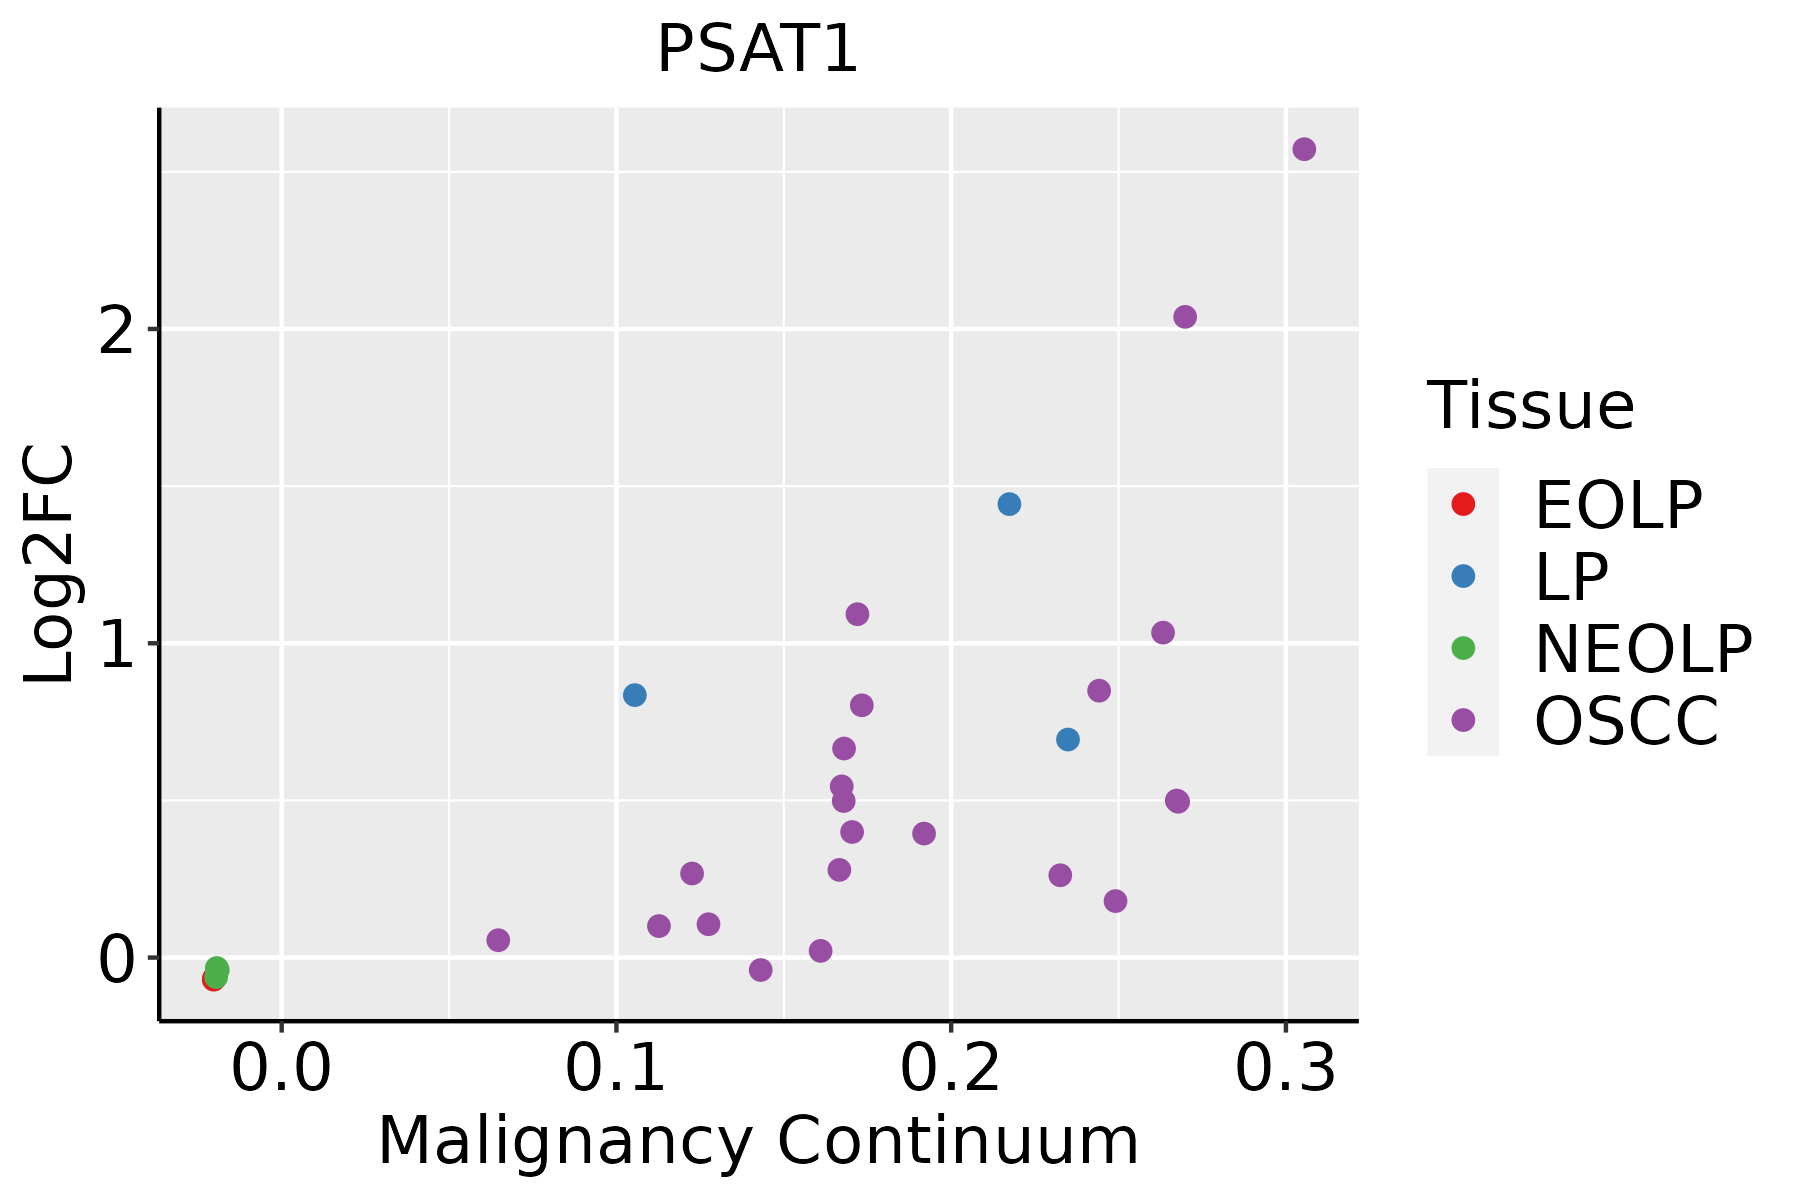 | EOLP: Erosive Oral lichen planus |
| LP: leukoplakia | ||
| NEOLP: Non-erosive oral lichen planus | ||
| OSCC: Oral squamous cell carcinoma | ||
| Skin | 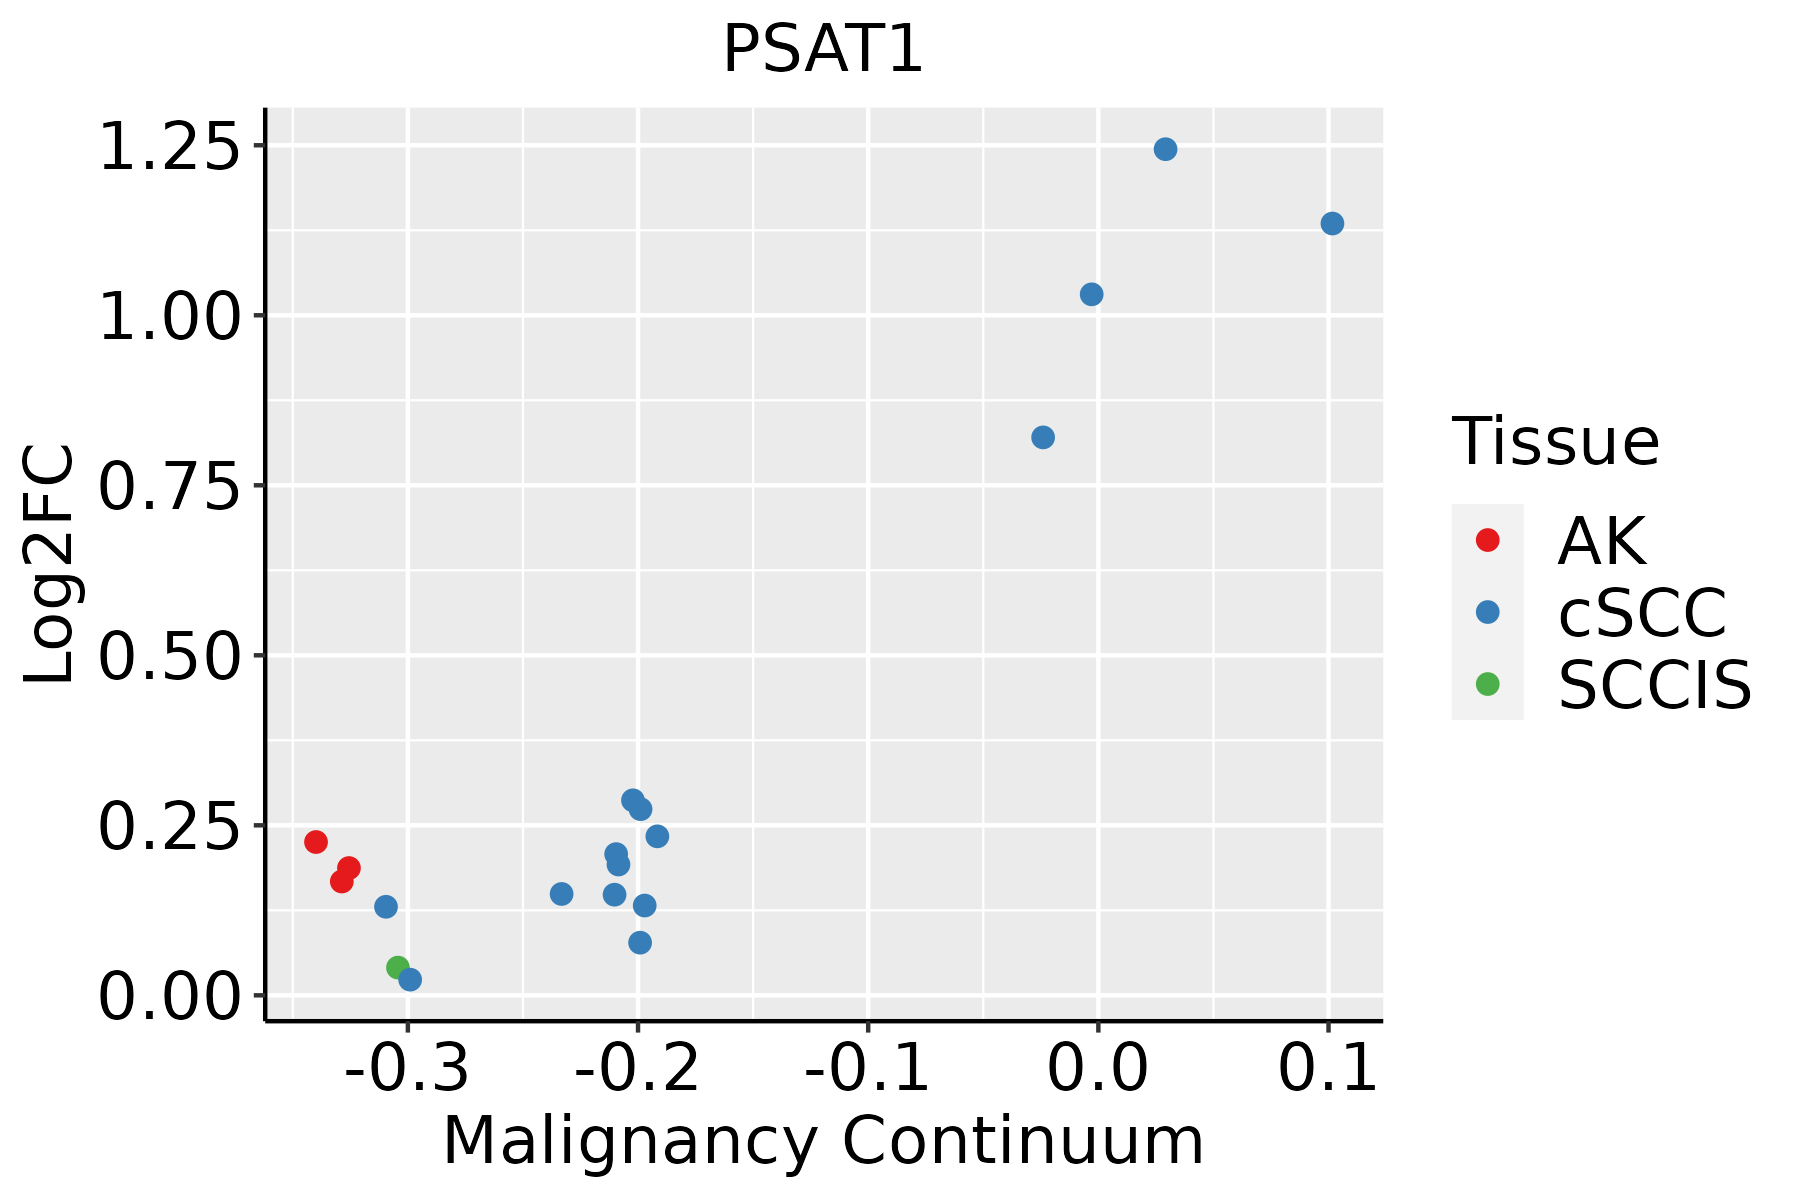 | AK: Actinic keratosis |
| cSCC: Cutaneous squamous cell carcinoma | ||
| SCCIS:squamous cell carcinoma in situ | ||
| Thyroid | 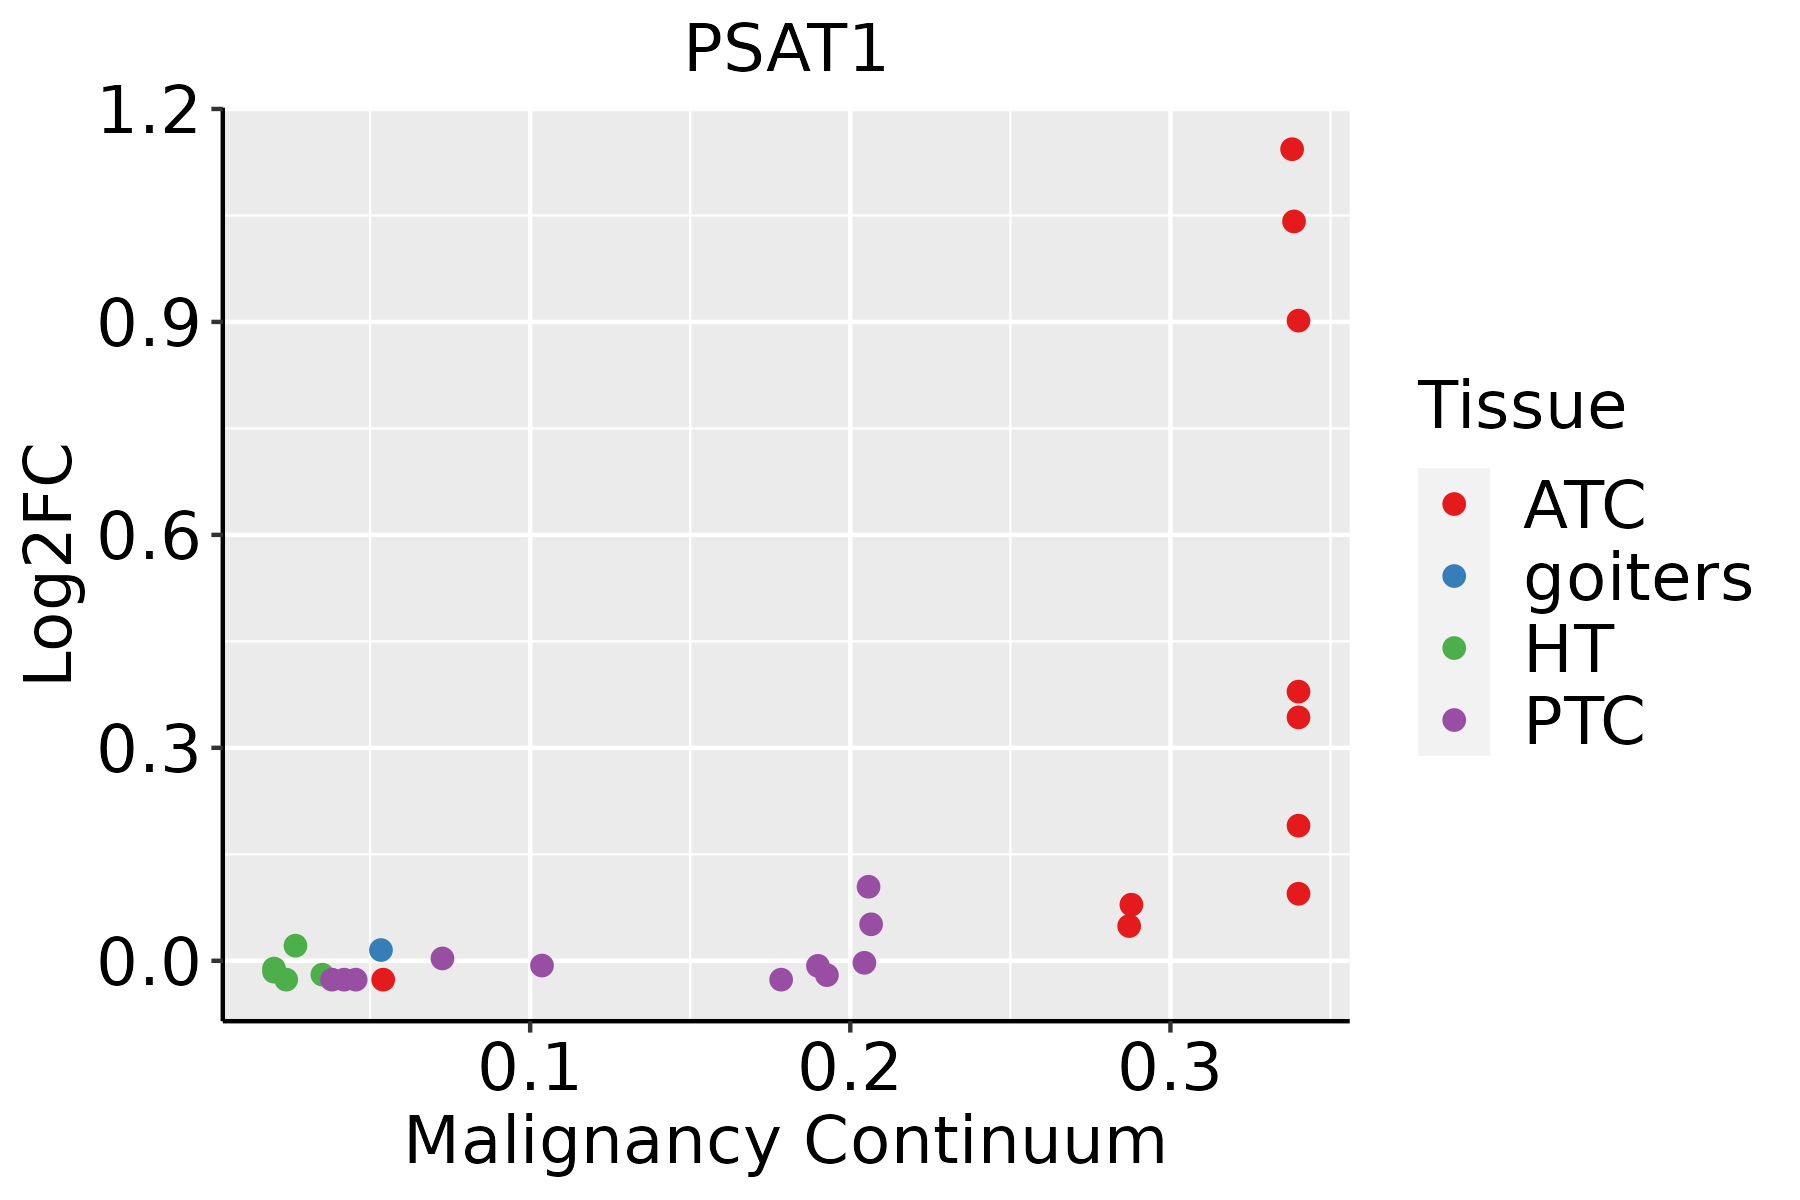 | ATC: Anaplastic thyroid cancer |
| HT: Hashimoto's thyroiditis | ||
| PTC: Papillary thyroid cancer |
| ∗log2FC in expression of this searched gene in stem-like cells from each diseased tissue sample relative to stem-like cells in normal samples in each tissue plotted against the malignancy continuum. Samples are colored based on if they are from different disease stage. |
Top |
Malignant transformation related pathway analysis |
| Find out the enriched GO biological processes and KEGG pathways involved in transition from healthy to precancer to cancer |
| Tissue | Disease Stage | Enriched GO biological Processes |
| Colorectum | AD |  |
| Colorectum | SER |  |
| Colorectum | MSS |  |
| Colorectum | MSI-H |  |
| Colorectum | FAP |  |
| ∗Top 15 enriched GO BP terms are showed in the bar plot of each disease state in each tissue. Each row represents a significant GO biological process which is colored according to the -log10(p.adjust). |
| Page: 1 2 3 4 5 6 7 8 9 |
| GO ID | Tissue | Disease Stage | Description | Gene Ratio | Bg Ratio | pvalue | p.adjust | Count |
| GO:00086525 | Esophagus | ESCC | cellular amino acid biosynthetic process | 51/8552 | 76/18723 | 1.30e-04 | 8.88e-04 | 51 |
| GO:00067671 | Esophagus | ESCC | water-soluble vitamin metabolic process | 41/8552 | 59/18723 | 1.84e-04 | 1.17e-03 | 41 |
| GO:00463948 | Esophagus | ESCC | carboxylic acid biosynthetic process | 175/8552 | 314/18723 | 1.98e-04 | 1.26e-03 | 175 |
| GO:00067661 | Esophagus | ESCC | vitamin metabolic process | 67/8552 | 106/18723 | 2.03e-04 | 1.28e-03 | 67 |
| GO:00160538 | Esophagus | ESCC | organic acid biosynthetic process | 175/8552 | 316/18723 | 3.04e-04 | 1.82e-03 | 175 |
| GO:19016075 | Esophagus | ESCC | alpha-amino acid biosynthetic process | 45/8552 | 68/18723 | 5.13e-04 | 2.84e-03 | 45 |
| GO:19016174 | Esophagus | ESCC | organic hydroxy compound biosynthetic process | 128/8552 | 237/18723 | 5.86e-03 | 2.16e-02 | 128 |
| GO:0009110 | Esophagus | ESCC | vitamin biosynthetic process | 15/8552 | 20/18723 | 7.60e-03 | 2.71e-02 | 15 |
| GO:001605321 | Liver | HCC | organic acid biosynthetic process | 200/7958 | 316/18723 | 5.24e-14 | 3.22e-12 | 200 |
| GO:004639421 | Liver | HCC | carboxylic acid biosynthetic process | 198/7958 | 314/18723 | 1.19e-13 | 6.78e-12 | 198 |
| GO:00086522 | Liver | HCC | cellular amino acid biosynthetic process | 58/7958 | 76/18723 | 1.98e-09 | 5.63e-08 | 58 |
| GO:19016052 | Liver | HCC | alpha-amino acid metabolic process | 124/7958 | 195/18723 | 2.07e-09 | 5.79e-08 | 124 |
| GO:19016072 | Liver | HCC | alpha-amino acid biosynthetic process | 53/7958 | 68/18723 | 2.62e-09 | 7.16e-08 | 53 |
| GO:00065202 | Liver | HCC | cellular amino acid metabolic process | 167/7958 | 284/18723 | 1.91e-08 | 4.56e-07 | 167 |
| GO:00090692 | Liver | HCC | serine family amino acid metabolic process | 29/7958 | 40/18723 | 1.17e-04 | 9.87e-04 | 29 |
| GO:19016172 | Liver | HCC | organic hydroxy compound biosynthetic process | 129/7958 | 237/18723 | 1.32e-04 | 1.08e-03 | 129 |
| GO:0006767 | Liver | HCC | water-soluble vitamin metabolic process | 39/7958 | 59/18723 | 2.14e-04 | 1.63e-03 | 39 |
| GO:0072525 | Liver | HCC | pyridine-containing compound biosynthetic process | 22/7958 | 32/18723 | 2.43e-03 | 1.18e-02 | 22 |
| GO:0072524 | Liver | HCC | pyridine-containing compound metabolic process | 25/7958 | 38/18723 | 3.18e-03 | 1.47e-02 | 25 |
| GO:0006766 | Liver | HCC | vitamin metabolic process | 57/7958 | 106/18723 | 1.25e-02 | 4.53e-02 | 57 |
| Page: 1 2 |
| Pathway ID | Tissue | Disease Stage | Description | Gene Ratio | Bg Ratio | pvalue | p.adjust | qvalue | Count |
| hsa002704 | Endometrium | EEC | Cysteine and methionine metabolism | 15/1237 | 52/8465 | 6.02e-03 | 3.12e-02 | 2.33e-02 | 15 |
| hsa0027011 | Endometrium | EEC | Cysteine and methionine metabolism | 15/1237 | 52/8465 | 6.02e-03 | 3.12e-02 | 2.33e-02 | 15 |
| hsa0120023 | Esophagus | ESCC | Carbon metabolism | 79/4205 | 115/8465 | 2.50e-05 | 1.21e-04 | 6.22e-05 | 79 |
| hsa012405 | Esophagus | ESCC | Biosynthesis of cofactors | 97/4205 | 153/8465 | 3.88e-04 | 1.35e-03 | 6.94e-04 | 97 |
| hsa0123023 | Esophagus | ESCC | Biosynthesis of amino acids | 49/4205 | 75/8465 | 4.35e-03 | 1.12e-02 | 5.74e-03 | 49 |
| hsa0120033 | Esophagus | ESCC | Carbon metabolism | 79/4205 | 115/8465 | 2.50e-05 | 1.21e-04 | 6.22e-05 | 79 |
| hsa0124012 | Esophagus | ESCC | Biosynthesis of cofactors | 97/4205 | 153/8465 | 3.88e-04 | 1.35e-03 | 6.94e-04 | 97 |
| hsa0123033 | Esophagus | ESCC | Biosynthesis of amino acids | 49/4205 | 75/8465 | 4.35e-03 | 1.12e-02 | 5.74e-03 | 49 |
| hsa0120041 | Liver | HCC | Carbon metabolism | 89/4020 | 115/8465 | 3.92e-11 | 6.56e-10 | 3.65e-10 | 89 |
| hsa012402 | Liver | HCC | Biosynthesis of cofactors | 103/4020 | 153/8465 | 4.67e-07 | 5.05e-06 | 2.81e-06 | 103 |
| hsa0123021 | Liver | HCC | Biosynthesis of amino acids | 53/4020 | 75/8465 | 3.79e-05 | 2.11e-04 | 1.18e-04 | 53 |
| hsa002702 | Liver | HCC | Cysteine and methionine metabolism | 35/4020 | 52/8465 | 3.03e-03 | 9.94e-03 | 5.53e-03 | 35 |
| hsa002602 | Liver | HCC | Glycine, serine and threonine metabolism | 28/4020 | 40/8465 | 3.28e-03 | 1.07e-02 | 5.93e-03 | 28 |
| hsa0120051 | Liver | HCC | Carbon metabolism | 89/4020 | 115/8465 | 3.92e-11 | 6.56e-10 | 3.65e-10 | 89 |
| hsa012403 | Liver | HCC | Biosynthesis of cofactors | 103/4020 | 153/8465 | 4.67e-07 | 5.05e-06 | 2.81e-06 | 103 |
| hsa0123031 | Liver | HCC | Biosynthesis of amino acids | 53/4020 | 75/8465 | 3.79e-05 | 2.11e-04 | 1.18e-04 | 53 |
| hsa002703 | Liver | HCC | Cysteine and methionine metabolism | 35/4020 | 52/8465 | 3.03e-03 | 9.94e-03 | 5.53e-03 | 35 |
| hsa002603 | Liver | HCC | Glycine, serine and threonine metabolism | 28/4020 | 40/8465 | 3.28e-03 | 1.07e-02 | 5.93e-03 | 28 |
| hsa0120014 | Oral cavity | OSCC | Carbon metabolism | 74/3704 | 115/8465 | 6.10e-06 | 3.05e-05 | 1.55e-05 | 74 |
| hsa012404 | Oral cavity | OSCC | Biosynthesis of cofactors | 88/3704 | 153/8465 | 3.84e-04 | 1.20e-03 | 6.12e-04 | 88 |
| Page: 1 2 |
Top |
Cell-cell communication analysis |
| Identification of potential cell-cell interactions between two cell types and their ligand-receptor pairs for different disease states |
| Ligand | Receptor | LRpair | Pathway | Tissue | Disease Stage |
| Page: 1 |
Top |
Single-cell gene regulatory network inference analysis |
| Find out the significant the regulons (TFs) and the target genes of each regulon across cell types for different disease states |
| TF | Cell Type | Tissue | Disease Stage | Target Gene | RSS | Regulon Activity |
| ∗The dot plots of a searched regulon are shown for all cell subpopulations in each disease state of each tissue based on the regulon specific score inferred using pySCENIC and by calculating the average expression. |
| Page: 1 |
Top |
Somatic mutation of malignant transformation related genes |
| Annotation of somatic variants for genes involved in malignant transformation |
| Hugo Symbol | Variant Class | Variant Classification | dbSNP RS | HGVSc | HGVSp | HGVSp Short | SWISSPROT | BIOTYPE | SIFT | PolyPhen | Tumor Sample Barcode | Tissue | Histology | Sex | Age | Stage | Therapy Types | Drugs | Outcome |
| PSAT1 | SNV | Missense_Mutation | rs373209481 | c.917N>A | p.Arg306His | p.R306H | Q9Y617 | protein_coding | tolerated(0.15) | probably_damaging(0.958) | TCGA-AN-A046-01 | Breast | breast invasive carcinoma | Female | >=65 | I/II | Unknown | Unknown | SD |
| PSAT1 | SNV | Missense_Mutation | c.578N>C | p.Val193Ala | p.V193A | Q9Y617 | protein_coding | deleterious(0.04) | benign(0.173) | TCGA-AA-3672-01 | Colorectum | colon adenocarcinoma | Female | >=65 | III/IV | Unknown | Unknown | SD | |
| PSAT1 | SNV | Missense_Mutation | c.346N>G | p.Lys116Glu | p.K116E | Q9Y617 | protein_coding | tolerated(0.56) | benign(0) | TCGA-CM-6674-01 | Colorectum | colon adenocarcinoma | Male | <65 | I/II | Unknown | Unknown | SD | |
| PSAT1 | SNV | Missense_Mutation | rs368071286 | c.748N>A | p.Val250Ile | p.V250I | Q9Y617 | protein_coding | tolerated(1) | benign(0.001) | TCGA-NH-A50T-01 | Colorectum | colon adenocarcinoma | Female | >=65 | I/II | Unknown | Unknown | SD |
| PSAT1 | SNV | Missense_Mutation | c.171N>T | p.Glu57Asp | p.E57D | Q9Y617 | protein_coding | deleterious(0) | benign(0.324) | TCGA-AG-A002-01 | Colorectum | rectum adenocarcinoma | Male | <65 | I/II | Unknown | Unknown | SD | |
| PSAT1 | insertion | Frame_Shift_Ins | novel | c.217_218insT | p.Leu75SerfsTer26 | p.L75Sfs*26 | Q9Y617 | protein_coding | TCGA-AD-6895-01 | Colorectum | colon adenocarcinoma | Male | >=65 | III/IV | Unknown | Unknown | SD | ||
| PSAT1 | SNV | Missense_Mutation | rs774223780 | c.637N>T | p.Arg213Cys | p.R213C | Q9Y617 | protein_coding | deleterious(0) | possibly_damaging(0.477) | TCGA-A5-A0G2-01 | Endometrium | uterine corpus endometrioid carcinoma | Female | <65 | III/IV | Unknown | Unknown | SD |
| PSAT1 | SNV | Missense_Mutation | novel | c.954A>C | p.Lys318Asn | p.K318N | Q9Y617 | protein_coding | tolerated(0.07) | benign(0.072) | TCGA-AJ-A23O-01 | Endometrium | uterine corpus endometrioid carcinoma | Female | >=65 | I/II | Unknown | Unknown | SD |
| PSAT1 | SNV | Missense_Mutation | novel | c.1079N>C | p.Phe360Ser | p.F360S | Q9Y617 | protein_coding | deleterious(0) | benign(0.336) | TCGA-AJ-A2QO-01 | Endometrium | uterine corpus endometrioid carcinoma | Female | >=65 | I/II | Unknown | Unknown | SD |
| PSAT1 | SNV | Missense_Mutation | rs200049723 | c.868N>A | p.Val290Ile | p.V290I | Q9Y617 | protein_coding | tolerated(0.42) | benign(0.001) | TCGA-AJ-A3OK-01 | Endometrium | uterine corpus endometrioid carcinoma | Female | >=65 | I/II | Chemotherapy | carboplatin | CR |
| Page: 1 2 3 4 5 |
Top |
Related drugs of malignant transformation related genes |
| Identification of chemicals and drugs interact with genes involved in malignant transfromation |
| (DGIdb 4.0) |
| Entrez ID | Symbol | Category | Interaction Types | Drug Claim Name | Drug Name | PMIDs |
| Page: 1 |

Copyright 2023-Present -The University of Texas Health Science Center at Houston |