
|
|||||
|
 | |
| |
| |
| |
| |
| |
|
Gene: PRXL2A |
Gene summary for PRXL2A |
| Gene information | Species | Human | Gene symbol | PRXL2A | Gene ID | 84293 |
| Gene name | peroxiredoxin like 2A | |
| Gene Alias | Adrx | |
| Cytomap | 10q23.1 | |
| Gene Type | protein-coding | GO ID | GO:0002376 | UniProtAcc | Q9BRX8 |
Top |
Malignant transformation analysis |
| Identification of the aberrant gene expression in precancerous and cancerous lesions by comparing the gene expression of stem-like cells in diseased tissues with normal stem cells |
| Entrez ID | Symbol | Replicates | Species | Organ | Tissue | Adj P-value | Log2FC | Malignancy |
| 84293 | PRXL2A | CA_HPV_1 | Human | Cervix | CC | 3.95e-13 | -4.22e-01 | 0.0264 |
| 84293 | PRXL2A | CA_HPV_3 | Human | Cervix | CC | 5.86e-03 | 7.12e-02 | 0.0414 |
| 84293 | PRXL2A | HSIL_HPV_2 | Human | Cervix | HSIL_HPV | 3.08e-02 | -2.83e-01 | 0.0208 |
| 84293 | PRXL2A | N_HPV_1 | Human | Cervix | N_HPV | 5.99e-06 | -4.07e-01 | 0.0079 |
| 84293 | PRXL2A | CCII_1 | Human | Cervix | CC | 5.11e-09 | -5.86e-01 | 0.3249 |
| 84293 | PRXL2A | Tumor | Human | Cervix | CC | 1.03e-36 | -6.53e-01 | 0.1241 |
| 84293 | PRXL2A | T1 | Human | Cervix | CC | 4.30e-02 | -3.04e-01 | 0.0918 |
| 84293 | PRXL2A | T3 | Human | Cervix | CC | 1.12e-03 | 8.60e-02 | 0.1389 |
| 84293 | PRXL2A | HTA11_3410_2000001011 | Human | Colorectum | AD | 5.97e-32 | 5.28e-01 | 0.0155 |
| 84293 | PRXL2A | HTA11_2487_2000001011 | Human | Colorectum | SER | 6.12e-46 | 1.00e+00 | -0.1808 |
| 84293 | PRXL2A | HTA11_2951_2000001011 | Human | Colorectum | AD | 6.82e-15 | 6.74e-01 | 0.0216 |
| 84293 | PRXL2A | HTA11_1938_2000001011 | Human | Colorectum | AD | 2.25e-38 | 1.04e+00 | -0.0811 |
| 84293 | PRXL2A | HTA11_78_2000001011 | Human | Colorectum | AD | 3.30e-29 | 7.10e-01 | -0.1088 |
| 84293 | PRXL2A | HTA11_347_2000001011 | Human | Colorectum | AD | 1.36e-80 | 1.33e+00 | -0.1954 |
| 84293 | PRXL2A | HTA11_411_2000001011 | Human | Colorectum | SER | 7.44e-09 | 6.61e-01 | -0.2602 |
| 84293 | PRXL2A | HTA11_2112_2000001011 | Human | Colorectum | SER | 5.26e-10 | 5.85e-01 | -0.2196 |
| 84293 | PRXL2A | HTA11_3361_2000001011 | Human | Colorectum | AD | 3.79e-24 | 6.88e-01 | -0.1207 |
| 84293 | PRXL2A | HTA11_83_2000001011 | Human | Colorectum | SER | 5.94e-40 | 1.36e+00 | -0.1526 |
| 84293 | PRXL2A | HTA11_696_2000001011 | Human | Colorectum | AD | 3.14e-46 | 7.81e-01 | -0.1464 |
| 84293 | PRXL2A | HTA11_866_2000001011 | Human | Colorectum | AD | 4.96e-35 | 6.69e-01 | -0.1001 |
| Page: 1 2 3 4 5 |
| Tissue | Expression Dynamics | Abbreviation |
| Cervix | 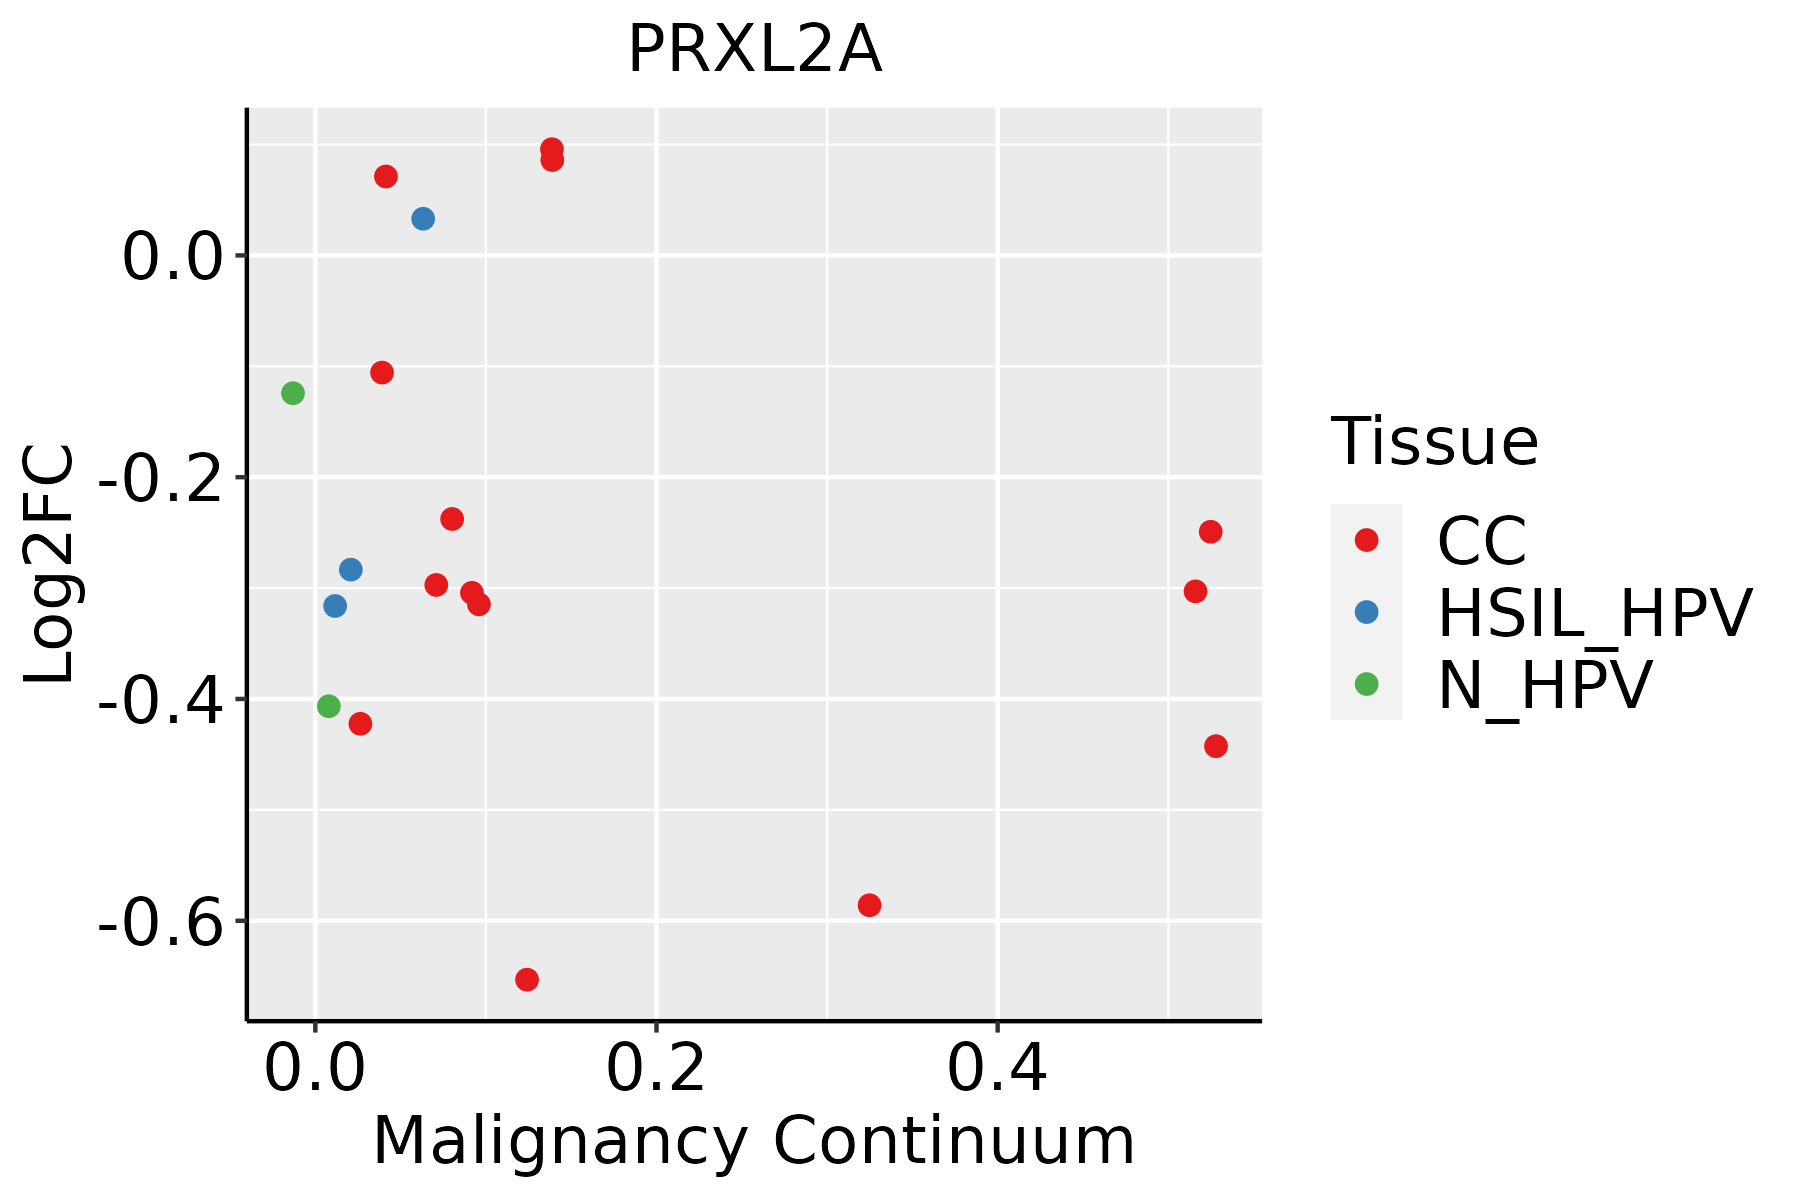 | CC: Cervix cancer |
| HSIL_HPV: HPV-infected high-grade squamous intraepithelial lesions | ||
| N_HPV: HPV-infected normal cervix | ||
| Colorectum (GSE201348) |  | FAP: Familial adenomatous polyposis |
| CRC: Colorectal cancer | ||
| Colorectum (HTA11) | 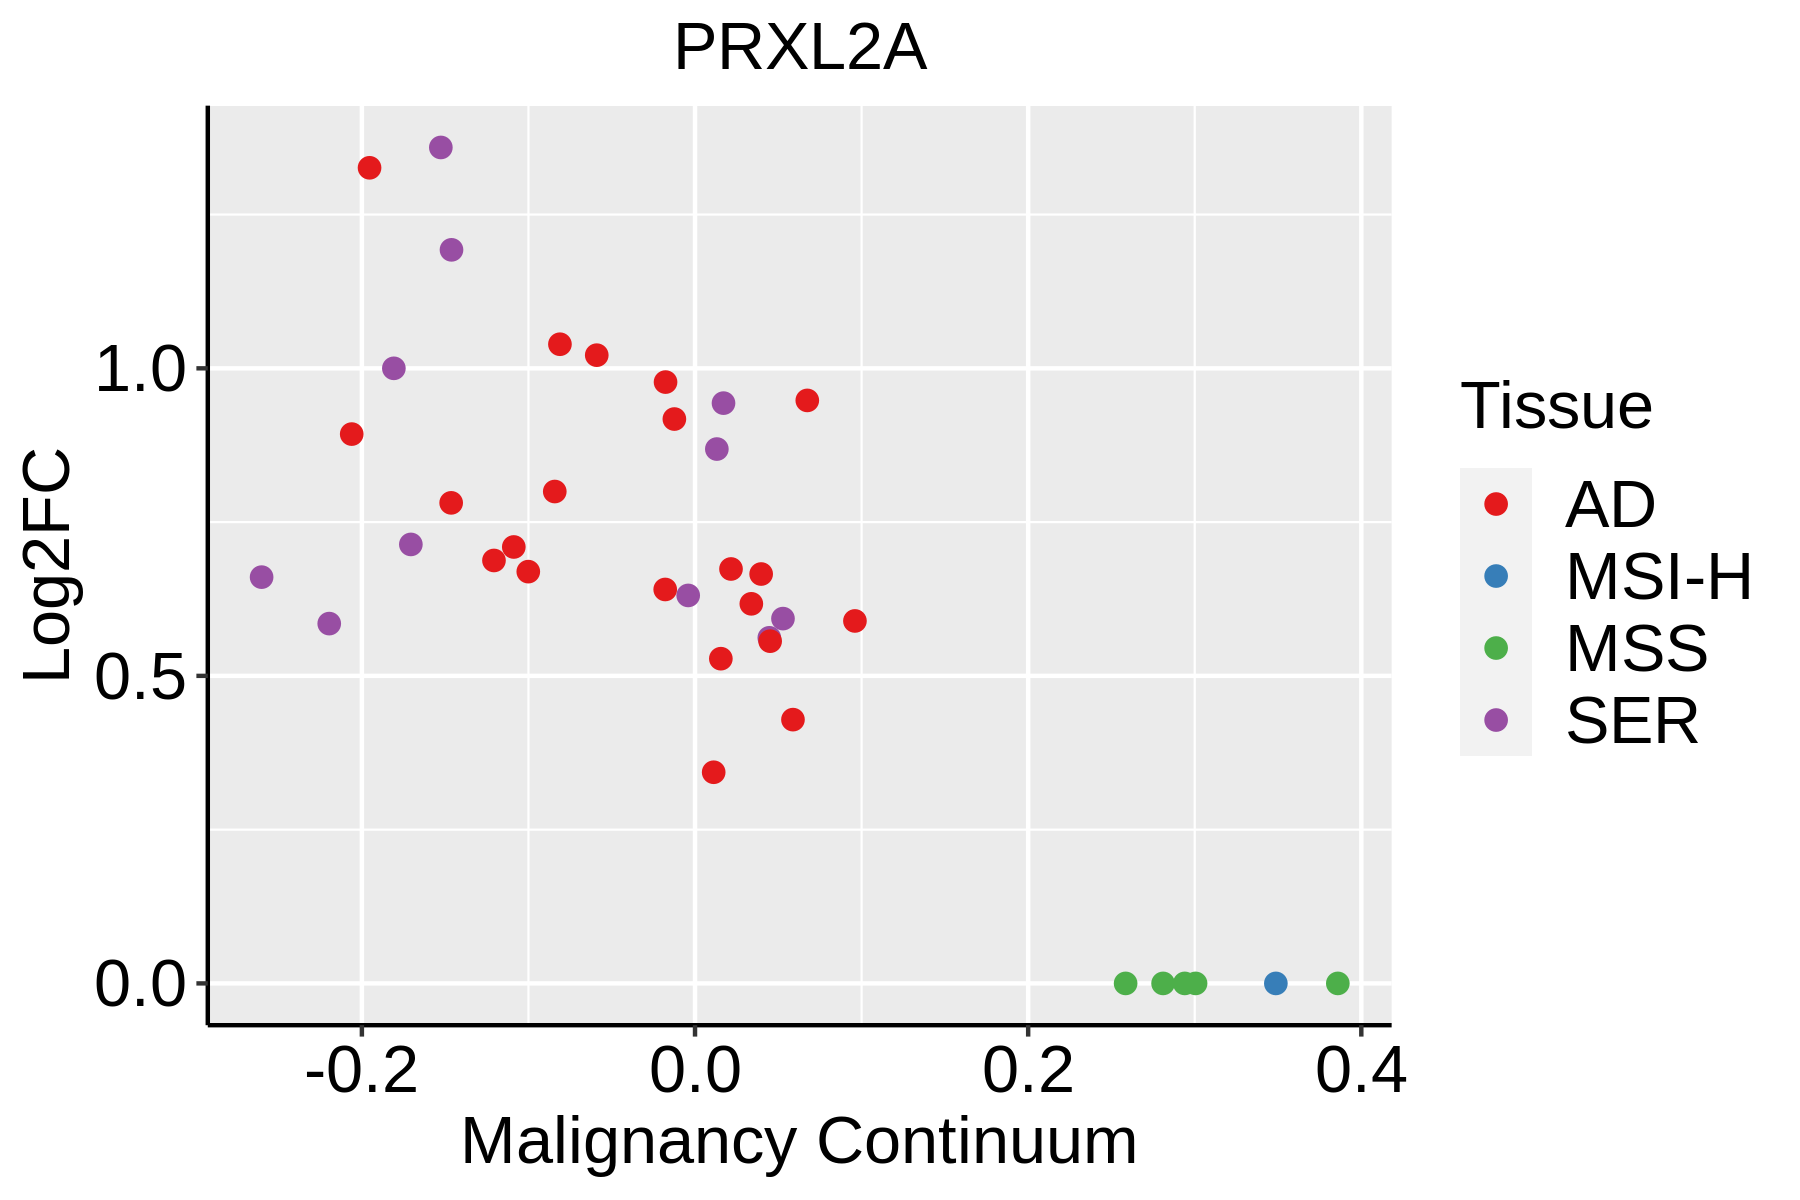 | AD: Adenomas |
| SER: Sessile serrated lesions | ||
| MSI-H: Microsatellite-high colorectal cancer | ||
| MSS: Microsatellite stable colorectal cancer | ||
| Endometrium | 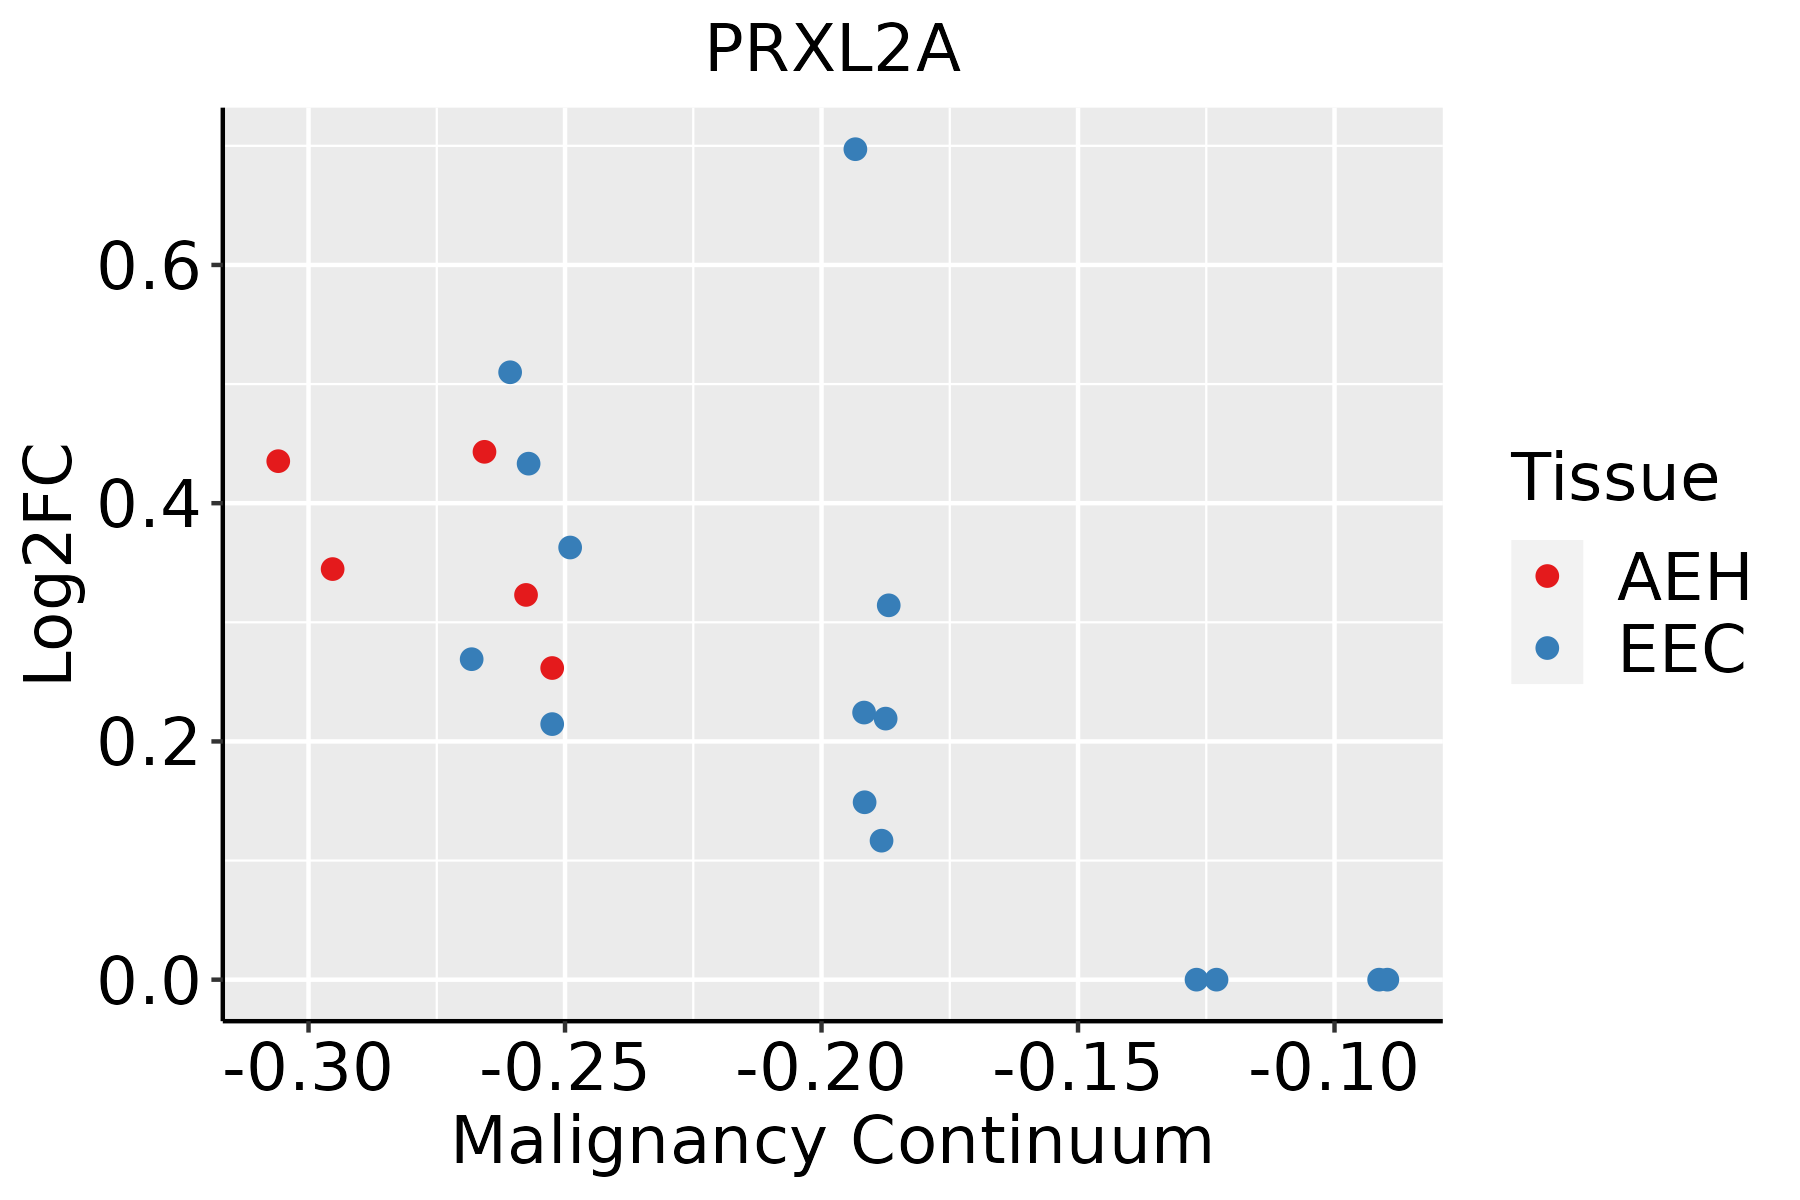 | AEH: Atypical endometrial hyperplasia |
| EEC: Endometrioid Cancer | ||
| Esophagus |  | ESCC: Esophageal squamous cell carcinoma |
| HGIN: High-grade intraepithelial neoplasias | ||
| LGIN: Low-grade intraepithelial neoplasias | ||
| Prostate | 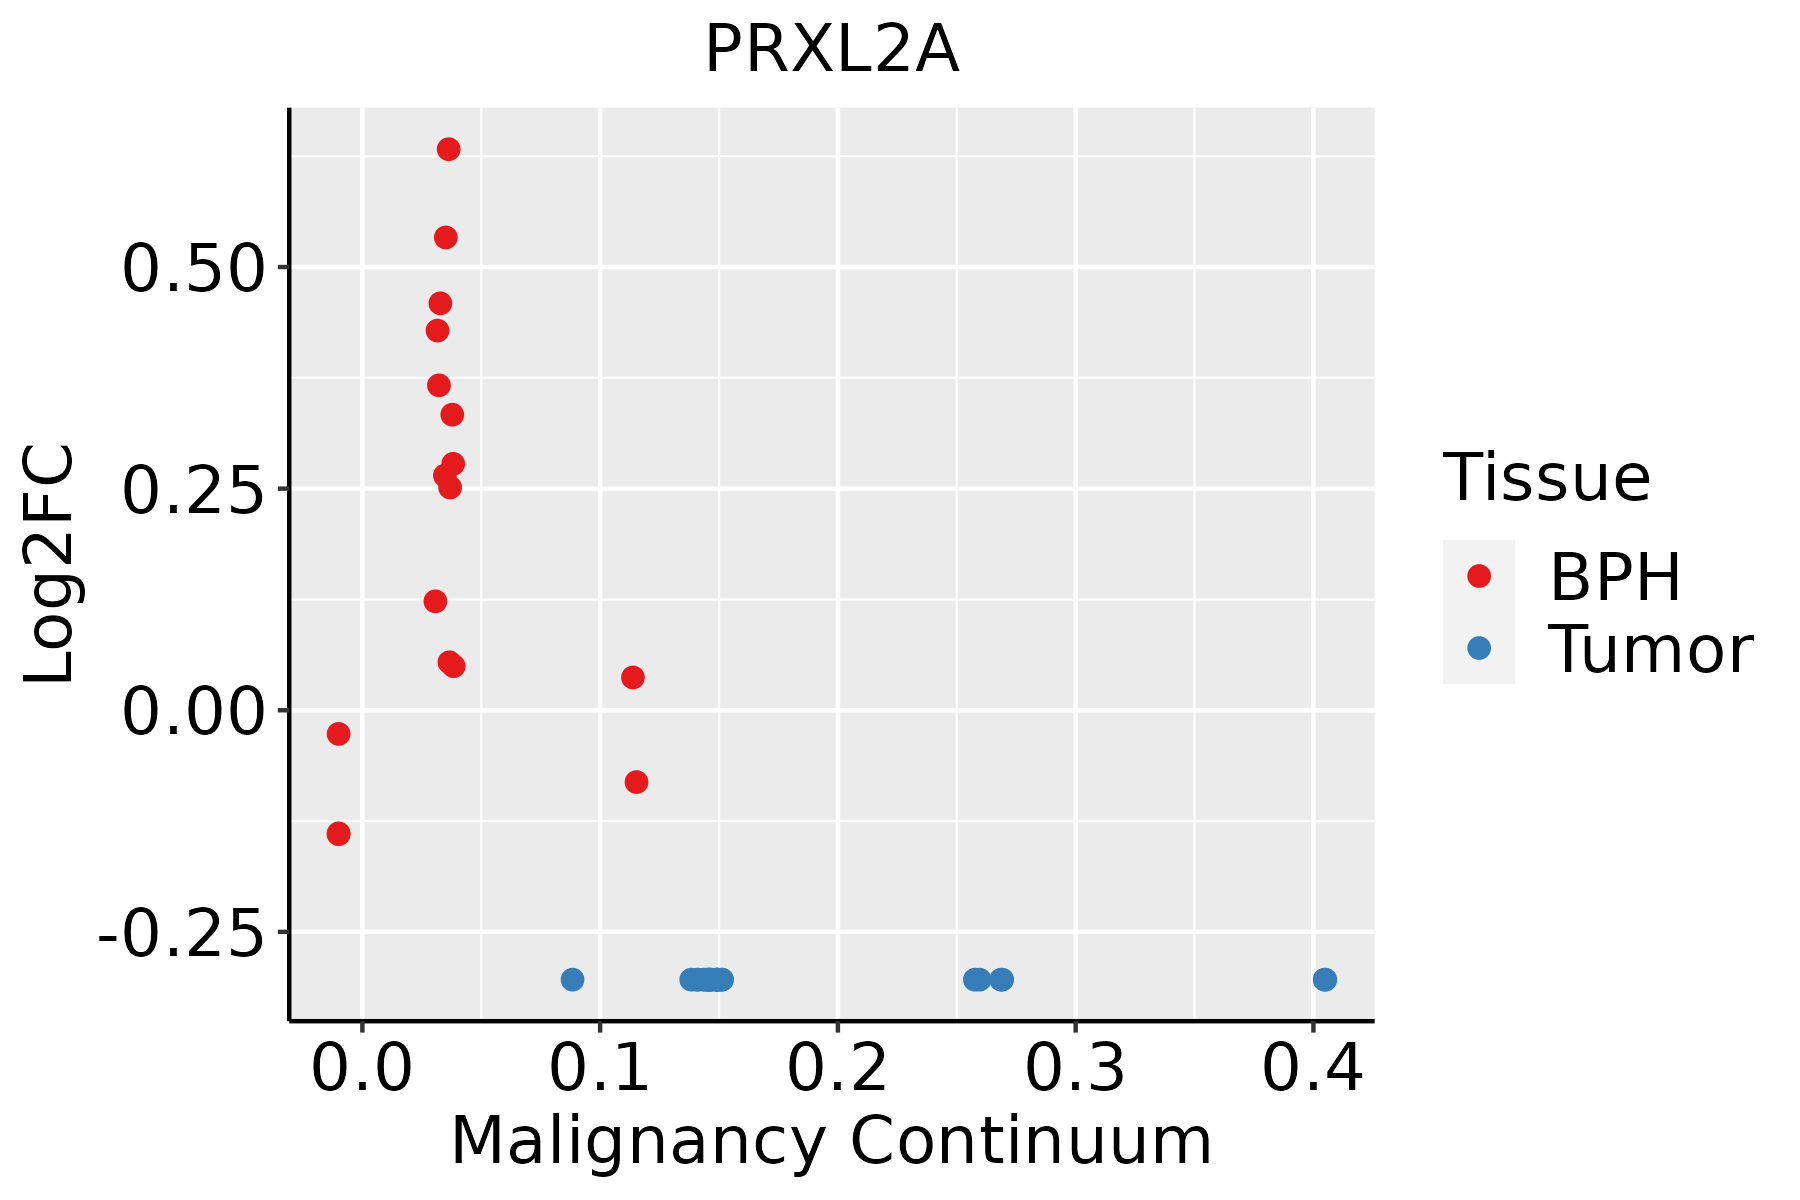 | BPH: Benign Prostatic Hyperplasia |
| Skin |  | AK: Actinic keratosis |
| cSCC: Cutaneous squamous cell carcinoma | ||
| SCCIS:squamous cell carcinoma in situ |
| ∗log2FC in expression of this searched gene in stem-like cells from each diseased tissue sample relative to stem-like cells in normal samples in each tissue plotted against the malignancy continuum. Samples are colored based on if they are from different disease stage. |
Top |
Malignant transformation related pathway analysis |
| Find out the enriched GO biological processes and KEGG pathways involved in transition from healthy to precancer to cancer |
| Tissue | Disease Stage | Enriched GO biological Processes |
| Colorectum | AD |  |
| Colorectum | SER |  |
| Colorectum | MSS |  |
| Colorectum | MSI-H |  |
| Colorectum | FAP |  |
| ∗Top 15 enriched GO BP terms are showed in the bar plot of each disease state in each tissue. Each row represents a significant GO biological process which is colored according to the -log10(p.adjust). |
| Page: 1 2 3 4 5 6 7 8 9 |
| GO ID | Tissue | Disease Stage | Description | Gene Ratio | Bg Ratio | pvalue | p.adjust | Count |
| GO:003009910 | Cervix | CC | myeloid cell differentiation | 83/2311 | 381/18723 | 1.31e-07 | 6.42e-06 | 83 |
| GO:190370610 | Cervix | CC | regulation of hemopoiesis | 80/2311 | 367/18723 | 2.14e-07 | 9.55e-06 | 80 |
| GO:00988699 | Cervix | CC | cellular oxidant detoxification | 30/2311 | 101/18723 | 2.72e-06 | 7.93e-05 | 30 |
| GO:19021056 | Cervix | CC | regulation of leukocyte differentiation | 61/2311 | 279/18723 | 5.16e-06 | 1.29e-04 | 61 |
| GO:004563710 | Cervix | CC | regulation of myeloid cell differentiation | 48/2311 | 210/18723 | 1.49e-05 | 2.93e-04 | 48 |
| GO:00025738 | Cervix | CC | myeloid leukocyte differentiation | 47/2311 | 208/18723 | 2.48e-05 | 4.27e-04 | 47 |
| GO:19907489 | Cervix | CC | cellular detoxification | 30/2311 | 116/18723 | 5.34e-05 | 7.94e-04 | 30 |
| GO:00972379 | Cervix | CC | cellular response to toxic substance | 31/2311 | 124/18723 | 8.09e-05 | 1.10e-03 | 31 |
| GO:00096369 | Cervix | CC | response to toxic substance | 52/2311 | 262/18723 | 3.34e-04 | 3.52e-03 | 52 |
| GO:00987549 | Cervix | CC | detoxification | 33/2311 | 152/18723 | 7.97e-04 | 7.00e-03 | 33 |
| GO:00027614 | Cervix | CC | regulation of myeloid leukocyte differentiation | 27/2311 | 120/18723 | 1.31e-03 | 1.04e-02 | 27 |
| GO:0030316 | Cervix | CC | osteoclast differentiation | 20/2311 | 94/18723 | 9.92e-03 | 4.86e-02 | 20 |
| GO:003009915 | Cervix | HSIL_HPV | myeloid cell differentiation | 36/737 | 381/18723 | 1.19e-06 | 5.62e-05 | 36 |
| GO:190370613 | Cervix | HSIL_HPV | regulation of hemopoiesis | 35/737 | 367/18723 | 1.35e-06 | 6.21e-05 | 35 |
| GO:190210512 | Cervix | HSIL_HPV | regulation of leukocyte differentiation | 28/737 | 279/18723 | 5.84e-06 | 2.13e-04 | 28 |
| GO:000257313 | Cervix | HSIL_HPV | myeloid leukocyte differentiation | 22/737 | 208/18723 | 2.56e-05 | 7.56e-04 | 22 |
| GO:004563715 | Cervix | HSIL_HPV | regulation of myeloid cell differentiation | 22/737 | 210/18723 | 2.97e-05 | 8.57e-04 | 22 |
| GO:000963614 | Cervix | HSIL_HPV | response to toxic substance | 24/737 | 262/18723 | 1.14e-04 | 2.36e-03 | 24 |
| GO:009886914 | Cervix | HSIL_HPV | cellular oxidant detoxification | 13/737 | 101/18723 | 1.64e-04 | 3.14e-03 | 13 |
| GO:000276112 | Cervix | HSIL_HPV | regulation of myeloid leukocyte differentiation | 14/737 | 120/18723 | 2.67e-04 | 4.54e-03 | 14 |
| Page: 1 2 3 4 5 6 7 |
| Pathway ID | Tissue | Disease Stage | Description | Gene Ratio | Bg Ratio | pvalue | p.adjust | qvalue | Count |
| Page: 1 |
Top |
Cell-cell communication analysis |
| Identification of potential cell-cell interactions between two cell types and their ligand-receptor pairs for different disease states |
| Ligand | Receptor | LRpair | Pathway | Tissue | Disease Stage |
| Page: 1 |
Top |
Single-cell gene regulatory network inference analysis |
| Find out the significant the regulons (TFs) and the target genes of each regulon across cell types for different disease states |
| TF | Cell Type | Tissue | Disease Stage | Target Gene | RSS | Regulon Activity |
| ∗The dot plots of a searched regulon are shown for all cell subpopulations in each disease state of each tissue based on the regulon specific score inferred using pySCENIC and by calculating the average expression. |
| Page: 1 |
Top |
Somatic mutation of malignant transformation related genes |
| Annotation of somatic variants for genes involved in malignant transformation |
| Hugo Symbol | Variant Class | Variant Classification | dbSNP RS | HGVSc | HGVSp | HGVSp Short | SWISSPROT | BIOTYPE | SIFT | PolyPhen | Tumor Sample Barcode | Tissue | Histology | Sex | Age | Stage | Therapy Types | Drugs | Outcome |
| Page: 1 |
Top |
Related drugs of malignant transformation related genes |
| Identification of chemicals and drugs interact with genes involved in malignant transfromation |
| (DGIdb 4.0) |
| Entrez ID | Symbol | Category | Interaction Types | Drug Claim Name | Drug Name | PMIDs |
| Page: 1 |

Copyright 2023-Present -The University of Texas Health Science Center at Houston |