
|
|||||
|
 | |
| |
| |
| |
| |
| |
|
Gene: PRUNE1 |
Gene summary for PRUNE1 |
| Gene information | Species | Human | Gene symbol | PRUNE1 | Gene ID | 58497 |
| Gene name | prune exopolyphosphatase 1 | |
| Gene Alias | DRES-17 | |
| Cytomap | 1q21.3 | |
| Gene Type | protein-coding | GO ID | GO:0000226 | UniProtAcc | Q86TP1 |
Top |
Malignant transformation analysis |
| Identification of the aberrant gene expression in precancerous and cancerous lesions by comparing the gene expression of stem-like cells in diseased tissues with normal stem cells |
| Entrez ID | Symbol | Replicates | Species | Organ | Tissue | Adj P-value | Log2FC | Malignancy |
| 58497 | PRUNE1 | HCC1 | Human | Liver | HCC | 3.20e-02 | 2.30e+00 | 0.5336 |
| 58497 | PRUNE1 | HCC2 | Human | Liver | HCC | 4.13e-06 | 2.58e+00 | 0.5341 |
| 58497 | PRUNE1 | S014 | Human | Liver | HCC | 9.38e-12 | 3.49e-01 | 0.2254 |
| 58497 | PRUNE1 | S015 | Human | Liver | HCC | 5.77e-10 | 4.05e-01 | 0.2375 |
| 58497 | PRUNE1 | S016 | Human | Liver | HCC | 2.18e-14 | 3.79e-01 | 0.2243 |
| 58497 | PRUNE1 | S027 | Human | Liver | HCC | 3.44e-02 | 2.83e-01 | 0.2446 |
| 58497 | PRUNE1 | S028 | Human | Liver | HCC | 2.22e-10 | 3.65e-01 | 0.2503 |
| 58497 | PRUNE1 | S029 | Human | Liver | HCC | 7.01e-07 | 2.61e-01 | 0.2581 |
| Page: 1 |
| Tissue | Expression Dynamics | Abbreviation |
| Liver | 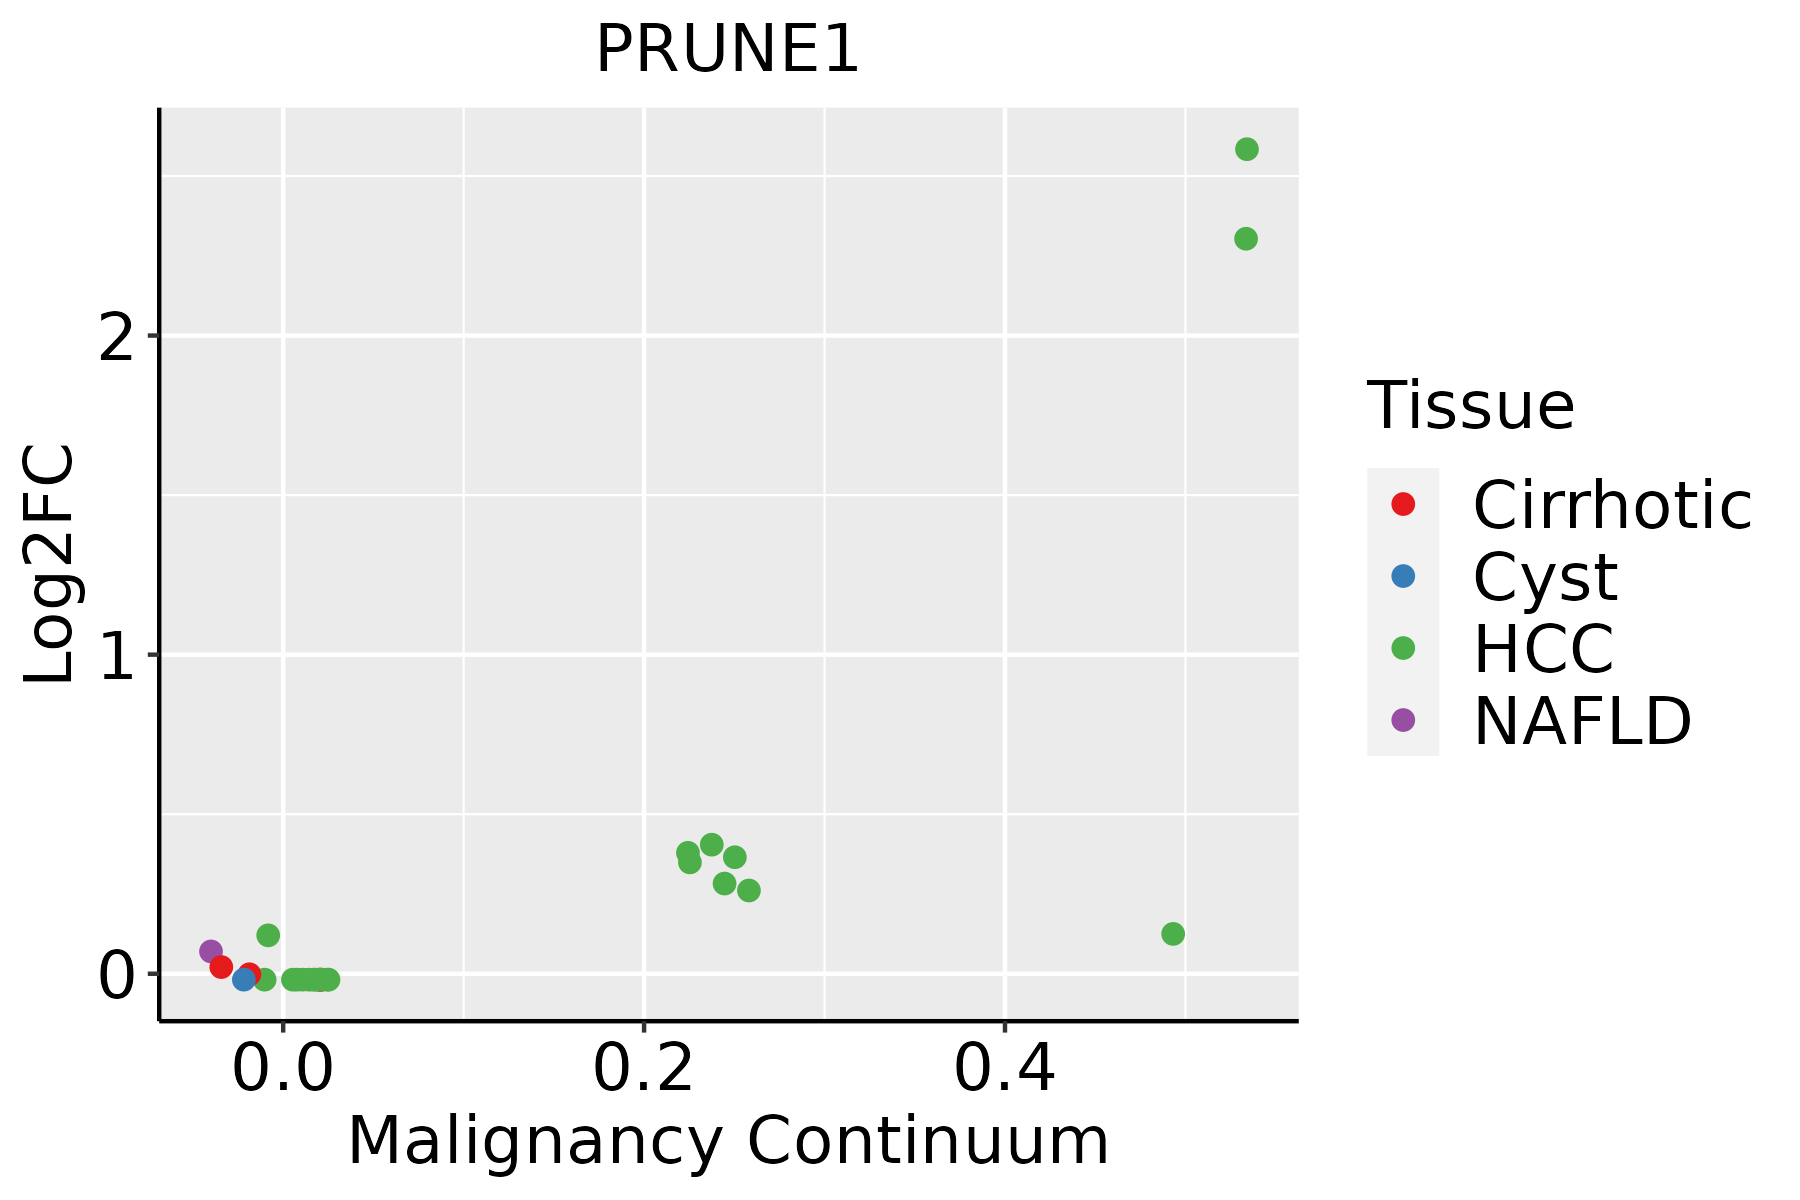 | HCC: Hepatocellular carcinoma |
| NAFLD: Non-alcoholic fatty liver disease |
| ∗log2FC in expression of this searched gene in stem-like cells from each diseased tissue sample relative to stem-like cells in normal samples in each tissue plotted against the malignancy continuum. Samples are colored based on if they are from different disease stage. |
Top |
Malignant transformation related pathway analysis |
| Find out the enriched GO biological processes and KEGG pathways involved in transition from healthy to precancer to cancer |
| Tissue | Disease Stage | Enriched GO biological Processes |
| Colorectum | AD |  |
| Colorectum | SER |  |
| Colorectum | MSS |  |
| Colorectum | MSI-H |  |
| Colorectum | FAP |  |
| ∗Top 15 enriched GO BP terms are showed in the bar plot of each disease state in each tissue. Each row represents a significant GO biological process which is colored according to the -log10(p.adjust). |
| Page: 1 2 3 4 5 6 7 8 9 |
| GO ID | Tissue | Disease Stage | Description | Gene Ratio | Bg Ratio | pvalue | p.adjust | Count |
| GO:004325422 | Liver | HCC | regulation of protein-containing complex assembly | 264/7958 | 428/18723 | 5.47e-16 | 4.39e-14 | 264 |
| GO:005125822 | Liver | HCC | protein polymerization | 182/7958 | 297/18723 | 4.17e-11 | 1.58e-09 | 182 |
| GO:190290322 | Liver | HCC | regulation of supramolecular fiber organization | 224/7958 | 383/18723 | 1.54e-10 | 5.33e-09 | 224 |
| GO:003227122 | Liver | HCC | regulation of protein polymerization | 141/7958 | 233/18723 | 2.00e-08 | 4.72e-07 | 141 |
| GO:001631121 | Liver | HCC | dephosphorylation | 230/7958 | 417/18723 | 1.00e-07 | 1.96e-06 | 230 |
| GO:007050711 | Liver | HCC | regulation of microtubule cytoskeleton organization | 88/7958 | 148/18723 | 2.28e-05 | 2.41e-04 | 88 |
| GO:0046785 | Liver | HCC | microtubule polymerization | 51/7958 | 83/18723 | 3.82e-04 | 2.61e-03 | 51 |
| GO:0031109 | Liver | HCC | microtubule polymerization or depolymerization | 68/7958 | 122/18723 | 2.14e-03 | 1.08e-02 | 68 |
| GO:0031110 | Liver | HCC | regulation of microtubule polymerization or depolymerization | 51/7958 | 88/18723 | 2.46e-03 | 1.19e-02 | 51 |
| GO:00507674 | Liver | HCC | regulation of neurogenesis | 181/7958 | 364/18723 | 3.00e-03 | 1.40e-02 | 181 |
| GO:00311132 | Liver | HCC | regulation of microtubule polymerization | 34/7958 | 55/18723 | 3.00e-03 | 1.40e-02 | 34 |
| GO:0032886 | Liver | HCC | regulation of microtubule-based process | 123/7958 | 240/18723 | 3.69e-03 | 1.64e-02 | 123 |
| Page: 1 |
| Pathway ID | Tissue | Disease Stage | Description | Gene Ratio | Bg Ratio | pvalue | p.adjust | qvalue | Count |
| Page: 1 |
Top |
Cell-cell communication analysis |
| Identification of potential cell-cell interactions between two cell types and their ligand-receptor pairs for different disease states |
| Ligand | Receptor | LRpair | Pathway | Tissue | Disease Stage |
| Page: 1 |
Top |
Single-cell gene regulatory network inference analysis |
| Find out the significant the regulons (TFs) and the target genes of each regulon across cell types for different disease states |
| TF | Cell Type | Tissue | Disease Stage | Target Gene | RSS | Regulon Activity |
| ∗The dot plots of a searched regulon are shown for all cell subpopulations in each disease state of each tissue based on the regulon specific score inferred using pySCENIC and by calculating the average expression. |
| Page: 1 |
Top |
Somatic mutation of malignant transformation related genes |
| Annotation of somatic variants for genes involved in malignant transformation |
| Hugo Symbol | Variant Class | Variant Classification | dbSNP RS | HGVSc | HGVSp | HGVSp Short | SWISSPROT | BIOTYPE | SIFT | PolyPhen | Tumor Sample Barcode | Tissue | Histology | Sex | Age | Stage | Therapy Types | Drugs | Outcome |
| PRUNE1 | SNV | Missense_Mutation | c.691N>A | p.Glu231Lys | p.E231K | Q86TP1 | protein_coding | deleterious(0.02) | probably_damaging(0.946) | TCGA-A2-A0CM-01 | Breast | breast invasive carcinoma | Female | <65 | I/II | Chemotherapy | adriamycin | PD | |
| PRUNE1 | SNV | Missense_Mutation | novel | c.439N>G | p.Ser147Ala | p.S147A | Q86TP1 | protein_coding | deleterious(0.01) | probably_damaging(0.976) | TCGA-A7-A4SE-01 | Breast | breast invasive carcinoma | Female | <65 | I/II | Chemotherapy | adriamycin | CR |
| PRUNE1 | SNV | Missense_Mutation | rs376183781 | c.812N>G | p.His271Arg | p.H271R | Q86TP1 | protein_coding | tolerated(0.52) | benign(0) | TCGA-A8-A08T-01 | Breast | breast invasive carcinoma | Female | <65 | III/IV | Unknown | Unknown | PD |
| PRUNE1 | SNV | Missense_Mutation | c.581A>G | p.Asp194Gly | p.D194G | Q86TP1 | protein_coding | deleterious(0) | probably_damaging(0.999) | TCGA-EW-A1PH-01 | Breast | breast invasive carcinoma | Female | <65 | I/II | Chemotherapy | cyclophosphamide | SD | |
| PRUNE1 | SNV | Missense_Mutation | c.771N>C | p.Leu257Phe | p.L257F | Q86TP1 | protein_coding | deleterious(0.02) | probably_damaging(0.922) | TCGA-DR-A0ZM-01 | Cervix | cervical & endocervical cancer | Female | <65 | III/IV | Unspecific | Cisplatin | SD | |
| PRUNE1 | SNV | Missense_Mutation | novel | c.1123A>G | p.Thr375Ala | p.T375A | Q86TP1 | protein_coding | tolerated(0.8) | benign(0) | TCGA-AA-3684-01 | Colorectum | colon adenocarcinoma | Female | >=65 | III/IV | Unknown | Unknown | SD |
| PRUNE1 | SNV | Missense_Mutation | c.521N>A | p.Gly174Glu | p.G174E | Q86TP1 | protein_coding | deleterious(0) | possibly_damaging(0.575) | TCGA-AZ-4323-01 | Colorectum | colon adenocarcinoma | Male | <65 | III/IV | Chemotherapy | oxaliplatin | PD | |
| PRUNE1 | SNV | Missense_Mutation | novel | c.469N>A | p.Leu157Met | p.L157M | Q86TP1 | protein_coding | deleterious(0.04) | probably_damaging(0.983) | TCGA-CA-6717-01 | Colorectum | colon adenocarcinoma | Male | <65 | I/II | Chemotherapy | oxaliplatin | CR |
| PRUNE1 | SNV | Missense_Mutation | novel | c.1047G>T | p.Lys349Asn | p.K349N | Q86TP1 | protein_coding | deleterious(0) | probably_damaging(1) | TCGA-AG-A002-01 | Colorectum | rectum adenocarcinoma | Male | <65 | I/II | Unknown | Unknown | SD |
| PRUNE1 | SNV | Missense_Mutation | novel | c.560N>A | p.Ile187Asn | p.I187N | Q86TP1 | protein_coding | deleterious(0.02) | benign(0.114) | TCGA-A5-A0G1-01 | Endometrium | uterine corpus endometrioid carcinoma | Female | >=65 | I/II | Unknown | Unknown | SD |
| Page: 1 2 3 4 |
Top |
Related drugs of malignant transformation related genes |
| Identification of chemicals and drugs interact with genes involved in malignant transfromation |
| (DGIdb 4.0) |
| Entrez ID | Symbol | Category | Interaction Types | Drug Claim Name | Drug Name | PMIDs |
| Page: 1 |

Copyright 2023-Present -The University of Texas Health Science Center at Houston |