
|
|||||
|
 | |
| |
| |
| |
| |
| |
|
Gene: PRUNE |
Gene summary for PRUNE |
| Gene information | Species | Human | Gene symbol | PRUNE | Gene ID | 58497 |
| Gene name | prune exopolyphosphatase 1 | |
| Gene Alias | DRES-17 | |
| Cytomap | 1q21.3 | |
| Gene Type | protein-coding | GO ID | GO:0000226 | UniProtAcc | Q86TP1 |
Top |
Malignant transformation analysis |
| Identification of the aberrant gene expression in precancerous and cancerous lesions by comparing the gene expression of stem-like cells in diseased tissues with normal stem cells |
| Entrez ID | Symbol | Replicates | Species | Organ | Tissue | Adj P-value | Log2FC | Malignancy |
| 58497 | PRUNE | P2T-E | Human | Esophagus | ESCC | 5.30e-21 | 3.43e-01 | 0.1177 |
| 58497 | PRUNE | P4T-E | Human | Esophagus | ESCC | 3.48e-08 | 1.90e-01 | 0.1323 |
| 58497 | PRUNE | P5T-E | Human | Esophagus | ESCC | 4.31e-06 | 1.40e-01 | 0.1327 |
| 58497 | PRUNE | P8T-E | Human | Esophagus | ESCC | 4.17e-05 | 1.26e-01 | 0.0889 |
| 58497 | PRUNE | P9T-E | Human | Esophagus | ESCC | 3.82e-08 | 1.95e-01 | 0.1131 |
| 58497 | PRUNE | P10T-E | Human | Esophagus | ESCC | 4.30e-10 | 2.44e-01 | 0.116 |
| 58497 | PRUNE | P11T-E | Human | Esophagus | ESCC | 6.74e-09 | 2.94e-01 | 0.1426 |
| 58497 | PRUNE | P12T-E | Human | Esophagus | ESCC | 1.88e-04 | 1.67e-01 | 0.1122 |
| 58497 | PRUNE | P15T-E | Human | Esophagus | ESCC | 7.37e-19 | 3.46e-01 | 0.1149 |
| 58497 | PRUNE | P16T-E | Human | Esophagus | ESCC | 5.79e-16 | 2.88e-01 | 0.1153 |
| 58497 | PRUNE | P20T-E | Human | Esophagus | ESCC | 1.35e-11 | 2.50e-01 | 0.1124 |
| 58497 | PRUNE | P21T-E | Human | Esophagus | ESCC | 3.28e-14 | 2.95e-01 | 0.1617 |
| 58497 | PRUNE | P22T-E | Human | Esophagus | ESCC | 8.56e-12 | 2.37e-01 | 0.1236 |
| 58497 | PRUNE | P23T-E | Human | Esophagus | ESCC | 2.12e-16 | 3.37e-01 | 0.108 |
| 58497 | PRUNE | P24T-E | Human | Esophagus | ESCC | 9.67e-18 | 3.47e-01 | 0.1287 |
| 58497 | PRUNE | P26T-E | Human | Esophagus | ESCC | 9.35e-10 | 2.10e-01 | 0.1276 |
| 58497 | PRUNE | P27T-E | Human | Esophagus | ESCC | 2.03e-09 | 1.72e-01 | 0.1055 |
| 58497 | PRUNE | P28T-E | Human | Esophagus | ESCC | 1.88e-11 | 2.01e-01 | 0.1149 |
| 58497 | PRUNE | P30T-E | Human | Esophagus | ESCC | 1.72e-15 | 4.15e-01 | 0.137 |
| 58497 | PRUNE | P31T-E | Human | Esophagus | ESCC | 8.56e-12 | 2.33e-01 | 0.1251 |
| Page: 1 2 3 |
| Tissue | Expression Dynamics | Abbreviation |
| Esophagus | 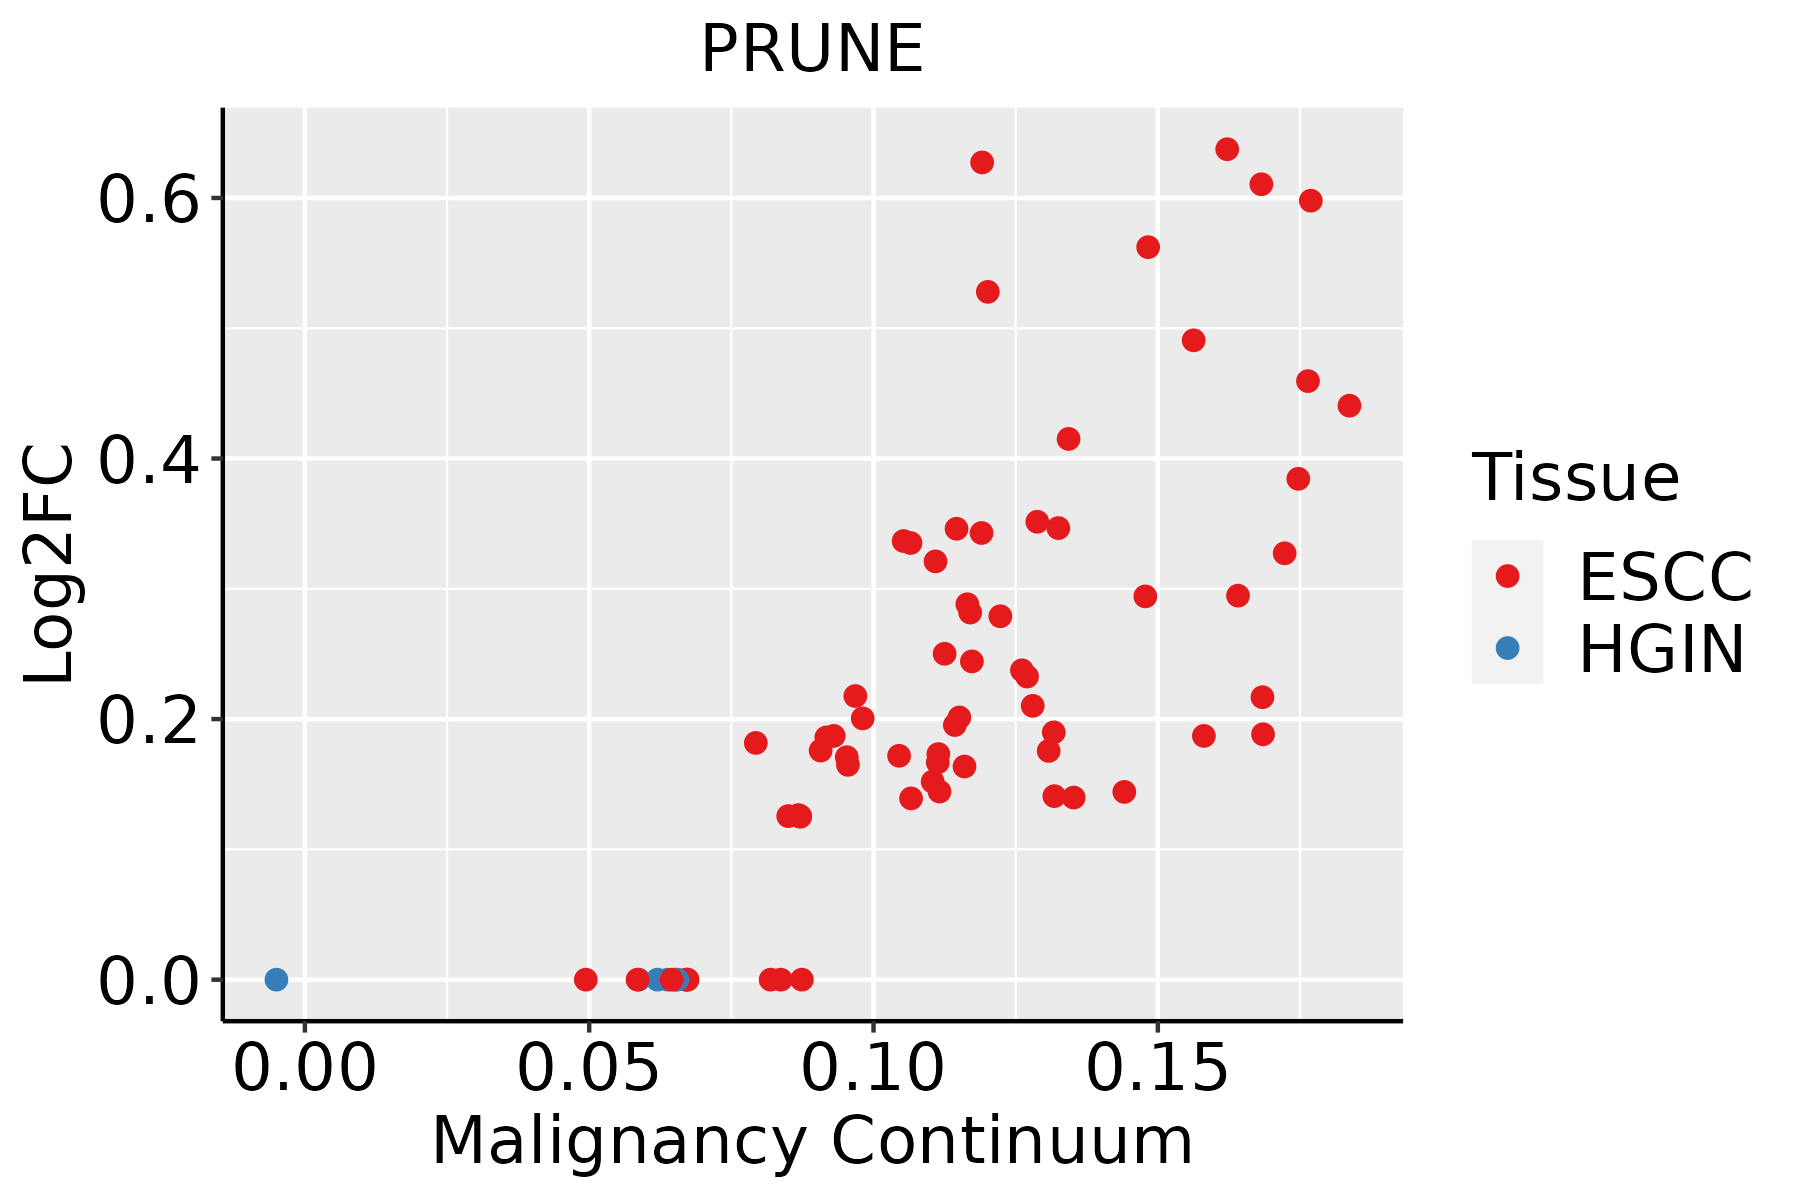 | ESCC: Esophageal squamous cell carcinoma |
| HGIN: High-grade intraepithelial neoplasias | ||
| LGIN: Low-grade intraepithelial neoplasias |
| ∗log2FC in expression of this searched gene in stem-like cells from each diseased tissue sample relative to stem-like cells in normal samples in each tissue plotted against the malignancy continuum. Samples are colored based on if they are from different disease stage. |
Top |
Malignant transformation related pathway analysis |
| Find out the enriched GO biological processes and KEGG pathways involved in transition from healthy to precancer to cancer |
| Tissue | Disease Stage | Enriched GO biological Processes |
| Colorectum | AD |  |
| Colorectum | SER |  |
| Colorectum | MSS |  |
| Colorectum | MSI-H |  |
| Colorectum | FAP |  |
| ∗Top 15 enriched GO BP terms are showed in the bar plot of each disease state in each tissue. Each row represents a significant GO biological process which is colored according to the -log10(p.adjust). |
| Page: 1 2 3 4 5 6 7 8 9 |
| GO ID | Tissue | Disease Stage | Description | Gene Ratio | Bg Ratio | pvalue | p.adjust | Count |
| GO:004325422 | Liver | HCC | regulation of protein-containing complex assembly | 264/7958 | 428/18723 | 5.47e-16 | 4.39e-14 | 264 |
| GO:005125822 | Liver | HCC | protein polymerization | 182/7958 | 297/18723 | 4.17e-11 | 1.58e-09 | 182 |
| GO:190290322 | Liver | HCC | regulation of supramolecular fiber organization | 224/7958 | 383/18723 | 1.54e-10 | 5.33e-09 | 224 |
| GO:003227122 | Liver | HCC | regulation of protein polymerization | 141/7958 | 233/18723 | 2.00e-08 | 4.72e-07 | 141 |
| GO:001631121 | Liver | HCC | dephosphorylation | 230/7958 | 417/18723 | 1.00e-07 | 1.96e-06 | 230 |
| GO:007050711 | Liver | HCC | regulation of microtubule cytoskeleton organization | 88/7958 | 148/18723 | 2.28e-05 | 2.41e-04 | 88 |
| GO:0046785 | Liver | HCC | microtubule polymerization | 51/7958 | 83/18723 | 3.82e-04 | 2.61e-03 | 51 |
| GO:0031109 | Liver | HCC | microtubule polymerization or depolymerization | 68/7958 | 122/18723 | 2.14e-03 | 1.08e-02 | 68 |
| GO:0031110 | Liver | HCC | regulation of microtubule polymerization or depolymerization | 51/7958 | 88/18723 | 2.46e-03 | 1.19e-02 | 51 |
| GO:00507674 | Liver | HCC | regulation of neurogenesis | 181/7958 | 364/18723 | 3.00e-03 | 1.40e-02 | 181 |
| GO:00311132 | Liver | HCC | regulation of microtubule polymerization | 34/7958 | 55/18723 | 3.00e-03 | 1.40e-02 | 34 |
| GO:0032886 | Liver | HCC | regulation of microtubule-based process | 123/7958 | 240/18723 | 3.69e-03 | 1.64e-02 | 123 |
| Page: 1 |
| Pathway ID | Tissue | Disease Stage | Description | Gene Ratio | Bg Ratio | pvalue | p.adjust | qvalue | Count |
| Page: 1 |
Top |
Cell-cell communication analysis |
| Identification of potential cell-cell interactions between two cell types and their ligand-receptor pairs for different disease states |
| Ligand | Receptor | LRpair | Pathway | Tissue | Disease Stage |
| Page: 1 |
Top |
Single-cell gene regulatory network inference analysis |
| Find out the significant the regulons (TFs) and the target genes of each regulon across cell types for different disease states |
| TF | Cell Type | Tissue | Disease Stage | Target Gene | RSS | Regulon Activity |
| ∗The dot plots of a searched regulon are shown for all cell subpopulations in each disease state of each tissue based on the regulon specific score inferred using pySCENIC and by calculating the average expression. |
| Page: 1 |
Top |
Somatic mutation of malignant transformation related genes |
| Annotation of somatic variants for genes involved in malignant transformation |
| Hugo Symbol | Variant Class | Variant Classification | dbSNP RS | HGVSc | HGVSp | HGVSp Short | SWISSPROT | BIOTYPE | SIFT | PolyPhen | Tumor Sample Barcode | Tissue | Histology | Sex | Age | Stage | Therapy Types | Drugs | Outcome |
| Page: 1 |
Top |
Related drugs of malignant transformation related genes |
| Identification of chemicals and drugs interact with genes involved in malignant transfromation |
| (DGIdb 4.0) |
| Entrez ID | Symbol | Category | Interaction Types | Drug Claim Name | Drug Name | PMIDs |
| Page: 1 |

Copyright 2023-Present -The University of Texas Health Science Center at Houston |