
|
|||||
|
 | |
| |
| |
| |
| |
| |
|
Gene: PRSS8 |
Gene summary for PRSS8 |
| Gene information | Species | Human | Gene symbol | PRSS8 | Gene ID | 5652 |
| Gene name | serine protease 8 | |
| Gene Alias | CAP1 | |
| Cytomap | 16p11.2 | |
| Gene Type | protein-coding | GO ID | GO:0002028 | UniProtAcc | Q16651 |
Top |
Malignant transformation analysis |
| Identification of the aberrant gene expression in precancerous and cancerous lesions by comparing the gene expression of stem-like cells in diseased tissues with normal stem cells |
| Entrez ID | Symbol | Replicates | Species | Organ | Tissue | Adj P-value | Log2FC | Malignancy |
| 5652 | PRSS8 | GSM4909281 | Human | Breast | IDC | 3.14e-02 | -2.51e-01 | 0.21 |
| 5652 | PRSS8 | GSM4909282 | Human | Breast | IDC | 9.37e-07 | -3.21e-01 | -0.0288 |
| 5652 | PRSS8 | GSM4909285 | Human | Breast | IDC | 2.89e-15 | -4.22e-01 | 0.21 |
| 5652 | PRSS8 | GSM4909286 | Human | Breast | IDC | 2.66e-08 | -3.88e-01 | 0.1081 |
| 5652 | PRSS8 | GSM4909287 | Human | Breast | IDC | 1.85e-10 | -3.46e-01 | 0.2057 |
| 5652 | PRSS8 | GSM4909288 | Human | Breast | IDC | 8.29e-04 | -4.37e-01 | 0.0988 |
| 5652 | PRSS8 | GSM4909290 | Human | Breast | IDC | 3.57e-02 | -2.56e-01 | 0.2096 |
| 5652 | PRSS8 | GSM4909293 | Human | Breast | IDC | 4.52e-03 | -9.51e-02 | 0.1581 |
| 5652 | PRSS8 | GSM4909294 | Human | Breast | IDC | 2.43e-07 | -3.63e-01 | 0.2022 |
| 5652 | PRSS8 | GSM4909296 | Human | Breast | IDC | 1.12e-11 | -3.16e-01 | 0.1524 |
| 5652 | PRSS8 | GSM4909297 | Human | Breast | IDC | 4.51e-14 | -3.92e-01 | 0.1517 |
| 5652 | PRSS8 | GSM4909298 | Human | Breast | IDC | 1.37e-06 | -2.67e-01 | 0.1551 |
| 5652 | PRSS8 | GSM4909304 | Human | Breast | IDC | 5.16e-05 | -3.99e-01 | 0.1636 |
| 5652 | PRSS8 | GSM4909307 | Human | Breast | IDC | 5.75e-04 | -2.99e-01 | 0.1569 |
| 5652 | PRSS8 | GSM4909308 | Human | Breast | IDC | 1.98e-03 | -2.63e-01 | 0.158 |
| 5652 | PRSS8 | GSM4909309 | Human | Breast | IDC | 1.17e-02 | -2.01e-01 | 0.0483 |
| 5652 | PRSS8 | GSM4909311 | Human | Breast | IDC | 8.62e-26 | -3.87e-01 | 0.1534 |
| 5652 | PRSS8 | GSM4909312 | Human | Breast | IDC | 7.62e-16 | -3.52e-01 | 0.1552 |
| 5652 | PRSS8 | GSM4909313 | Human | Breast | IDC | 6.97e-04 | -1.20e-01 | 0.0391 |
| 5652 | PRSS8 | GSM4909315 | Human | Breast | IDC | 6.71e-09 | -4.07e-01 | 0.21 |
| Page: 1 2 3 4 5 6 7 8 |
| Tissue | Expression Dynamics | Abbreviation |
| Breast | 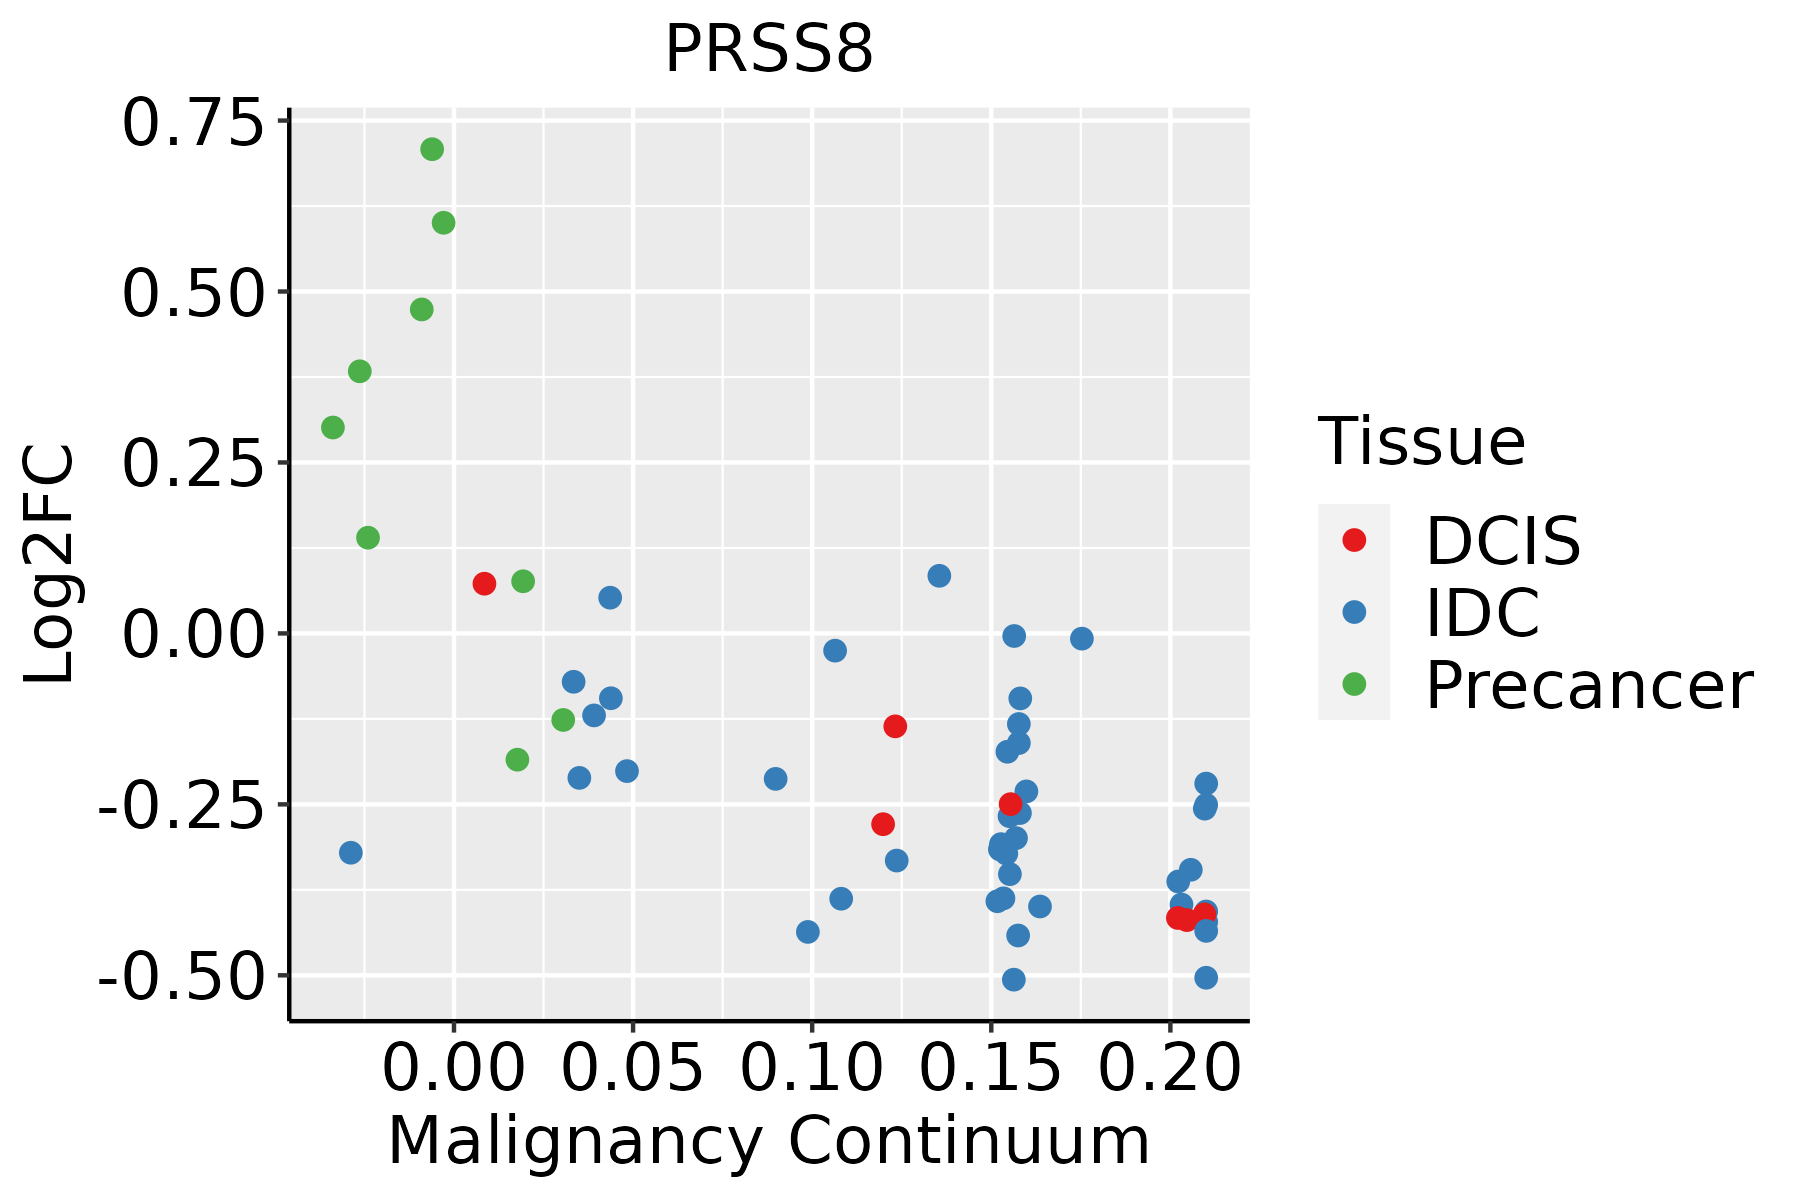 | IDC: Invasive ductal carcinoma |
| DCIS: Ductal carcinoma in situ | ||
| Precancer(BRCA1-mut): Precancerous lesion from BRCA1 mutation carriers | ||
| Cervix | 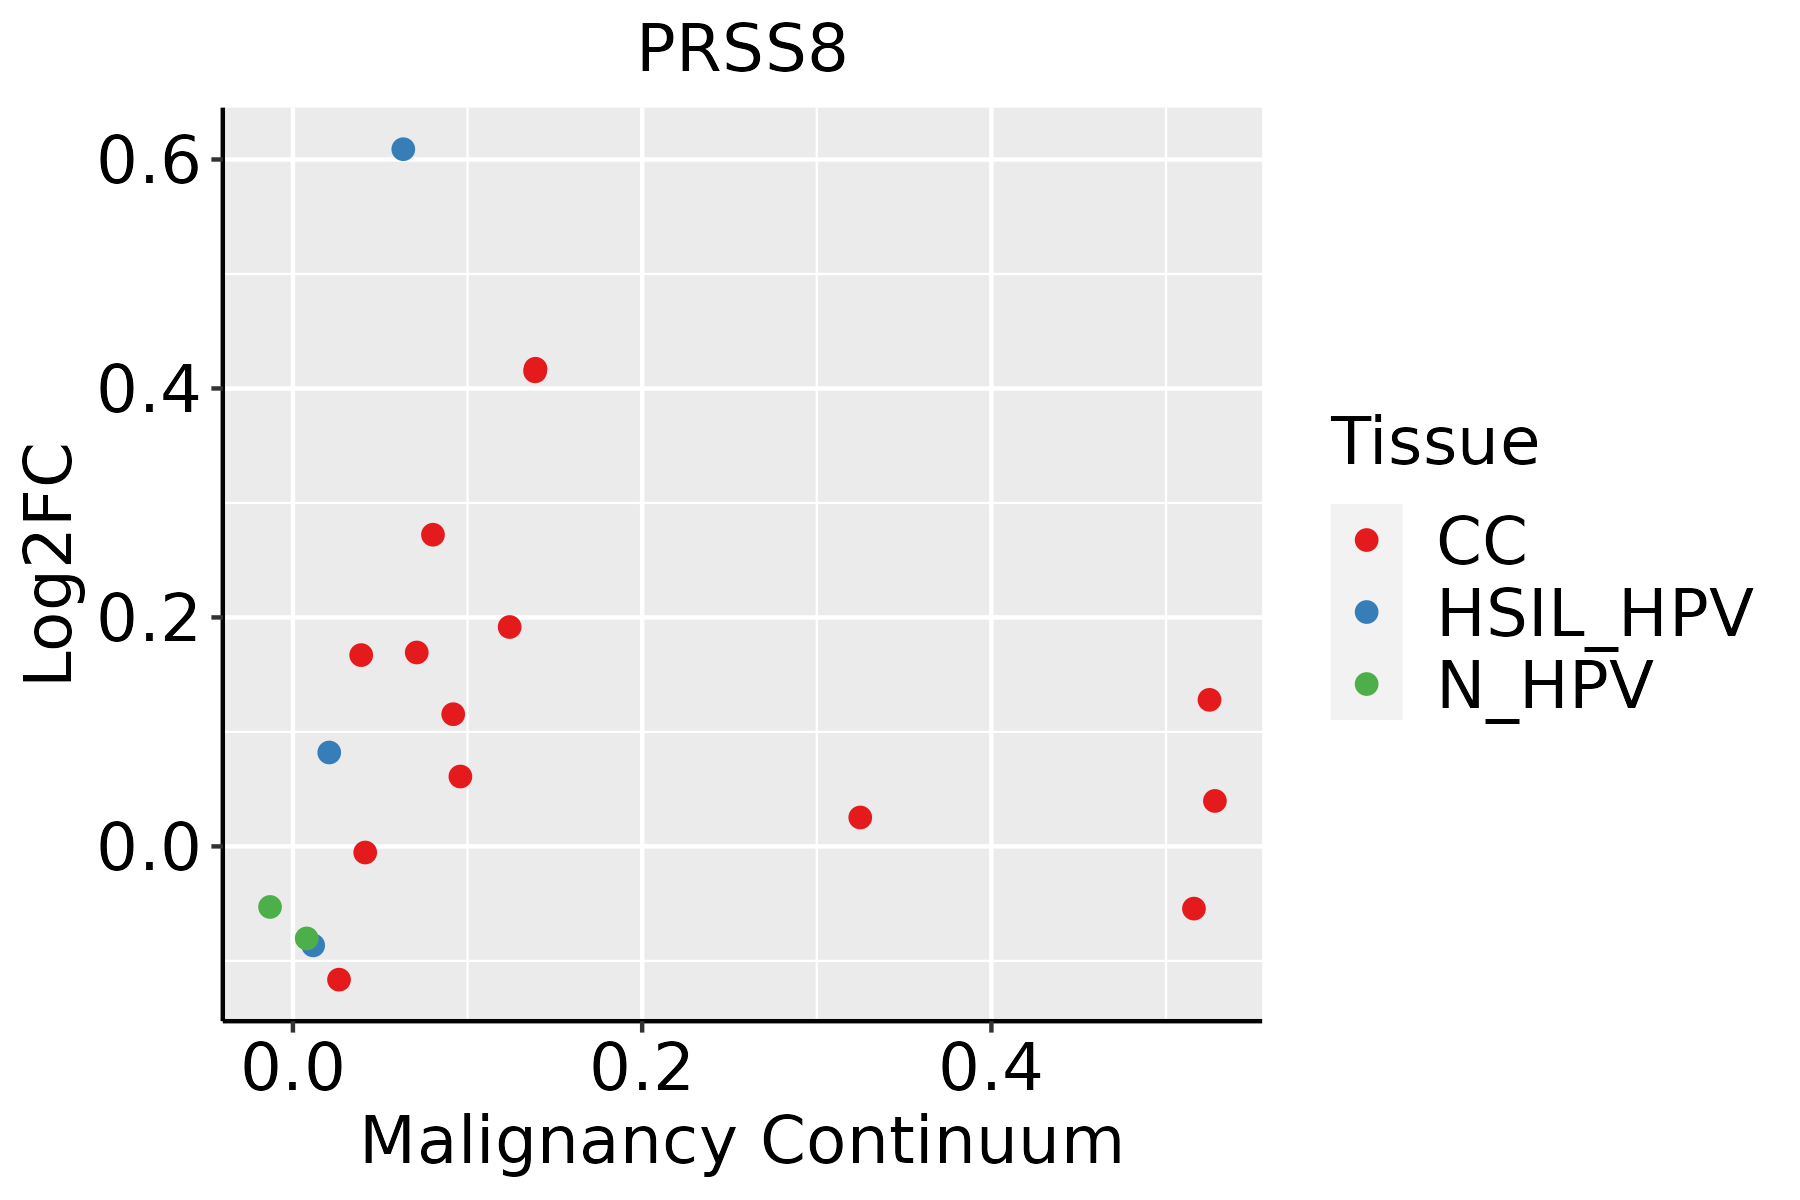 | CC: Cervix cancer |
| HSIL_HPV: HPV-infected high-grade squamous intraepithelial lesions | ||
| N_HPV: HPV-infected normal cervix | ||
| Endometrium | 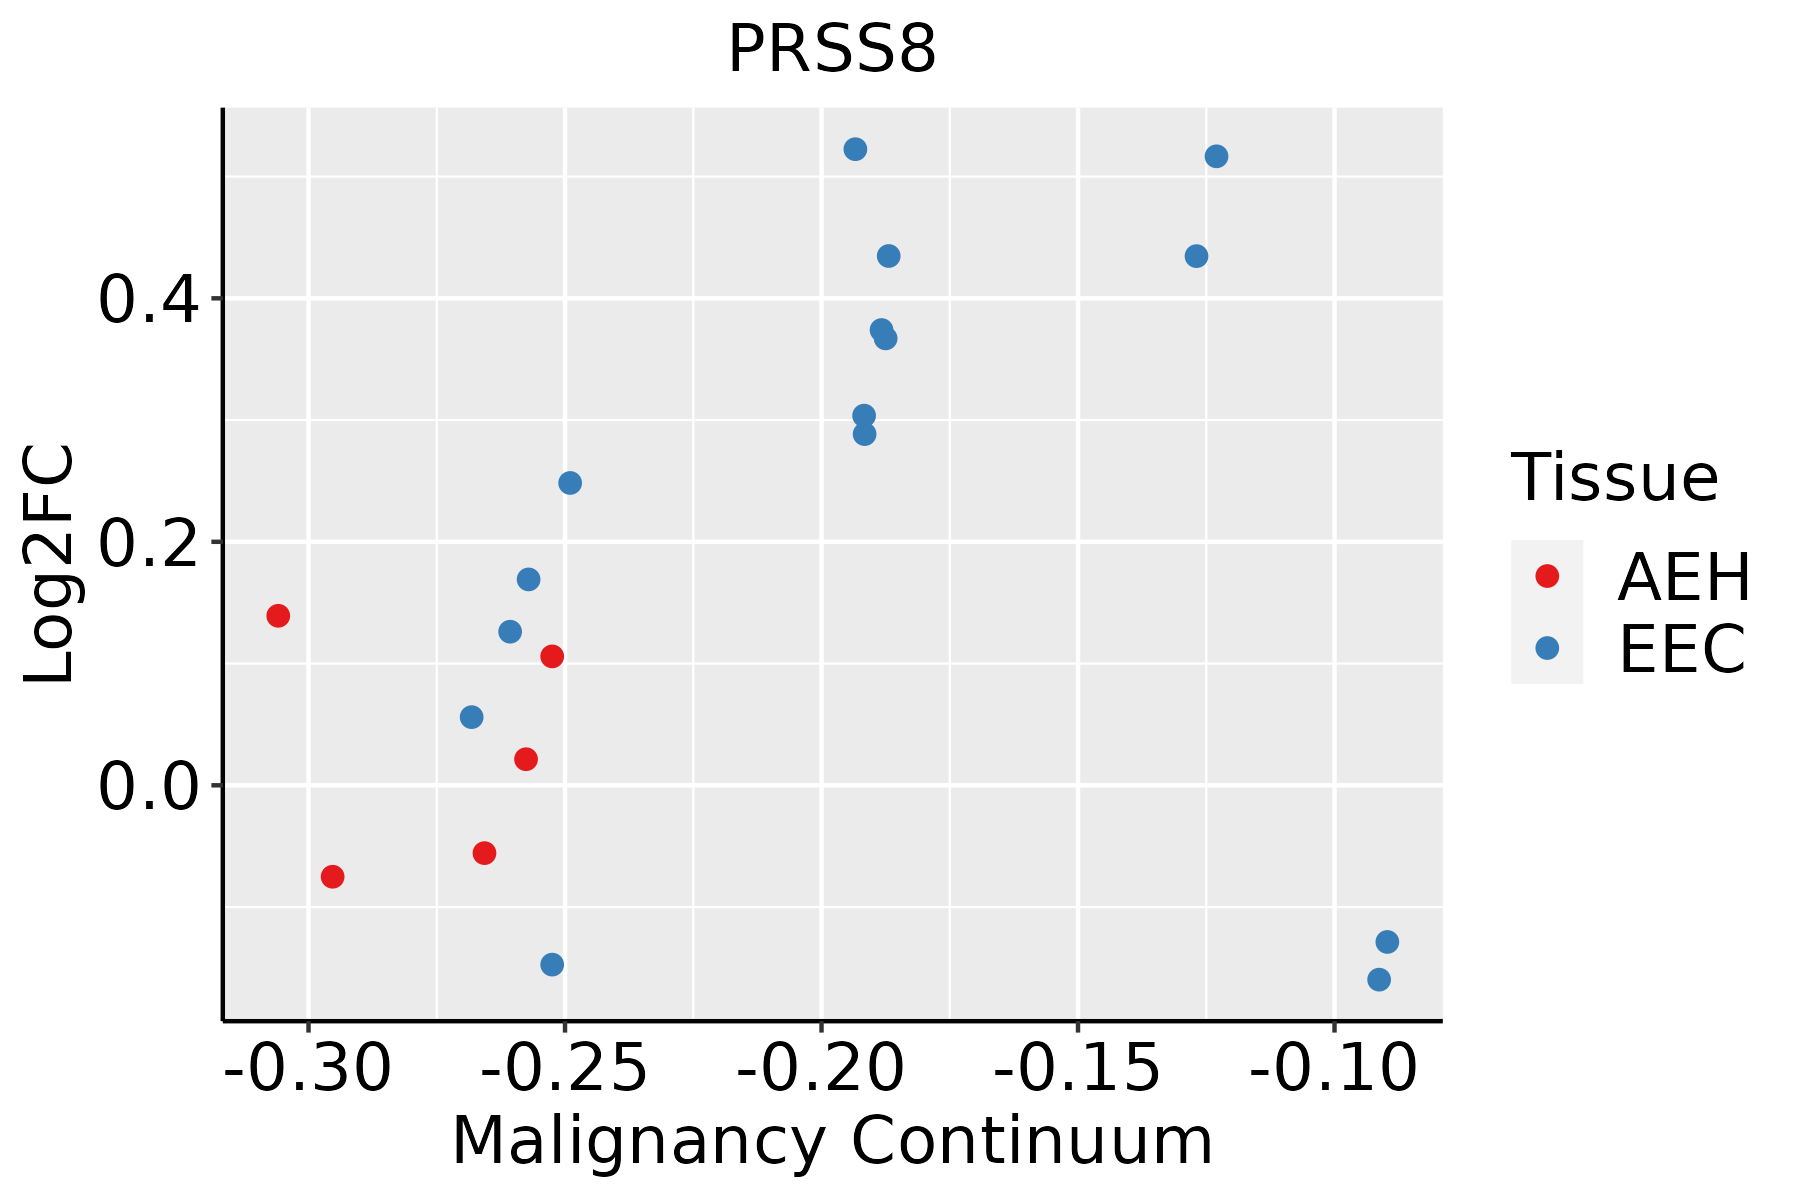 | AEH: Atypical endometrial hyperplasia |
| EEC: Endometrioid Cancer | ||
| Esophagus |  | ESCC: Esophageal squamous cell carcinoma |
| HGIN: High-grade intraepithelial neoplasias | ||
| LGIN: Low-grade intraepithelial neoplasias | ||
| Liver | 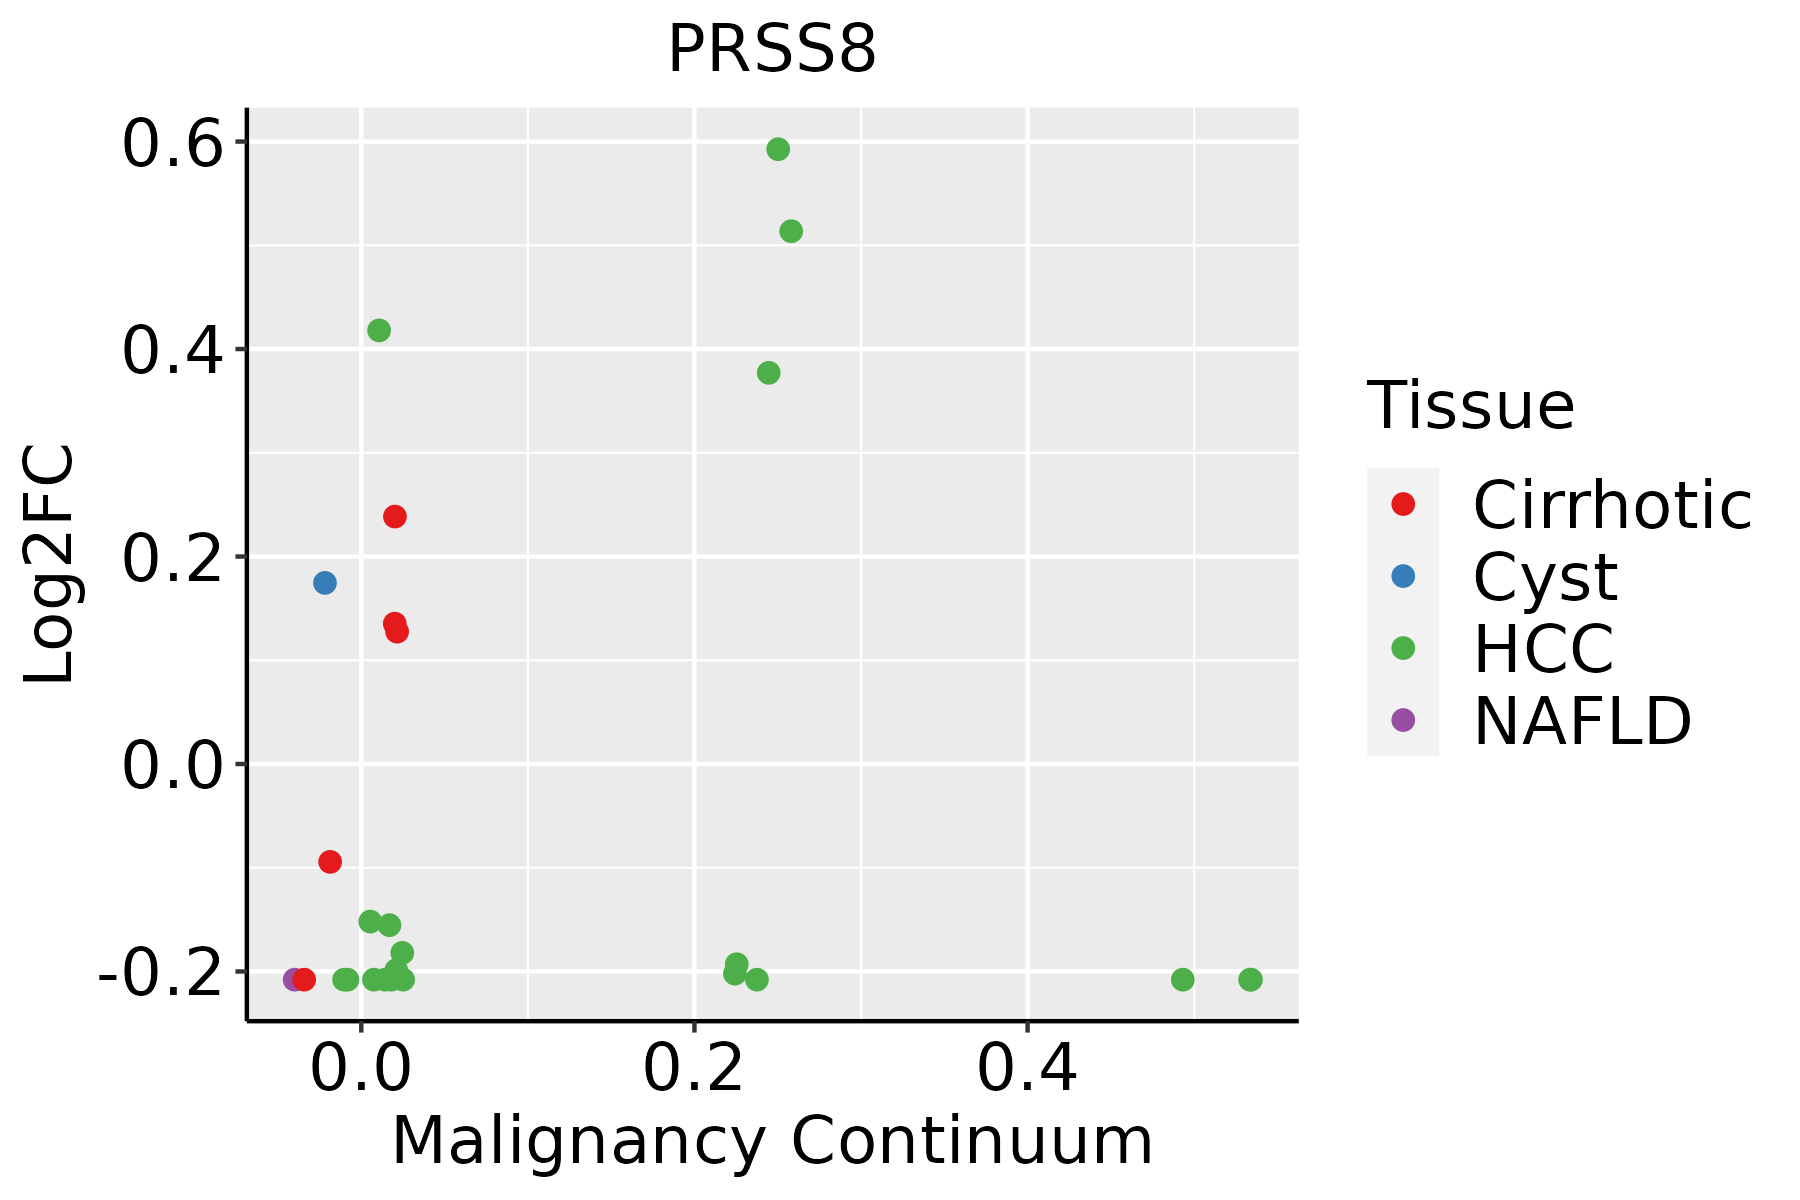 | HCC: Hepatocellular carcinoma |
| NAFLD: Non-alcoholic fatty liver disease | ||
| Oral Cavity | 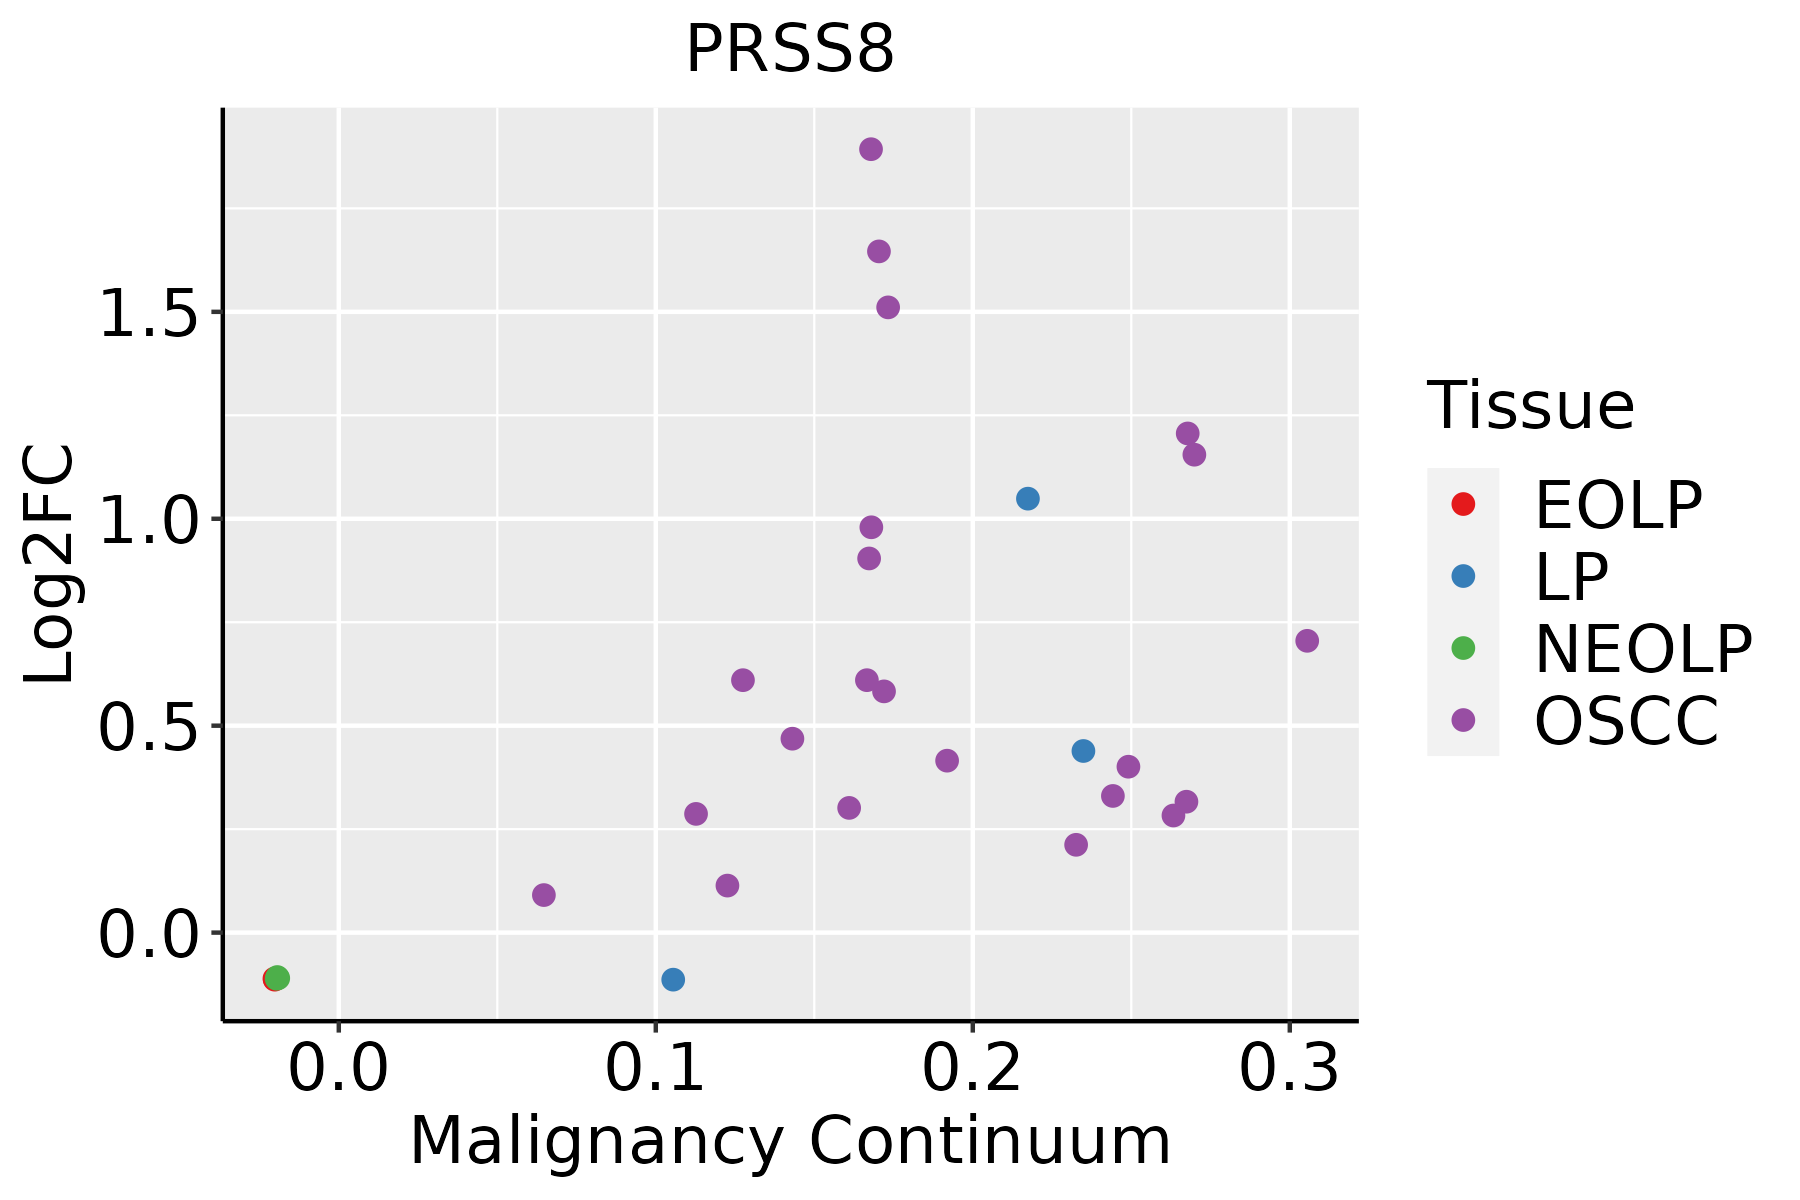 | EOLP: Erosive Oral lichen planus |
| LP: leukoplakia | ||
| NEOLP: Non-erosive oral lichen planus | ||
| OSCC: Oral squamous cell carcinoma | ||
| Skin | 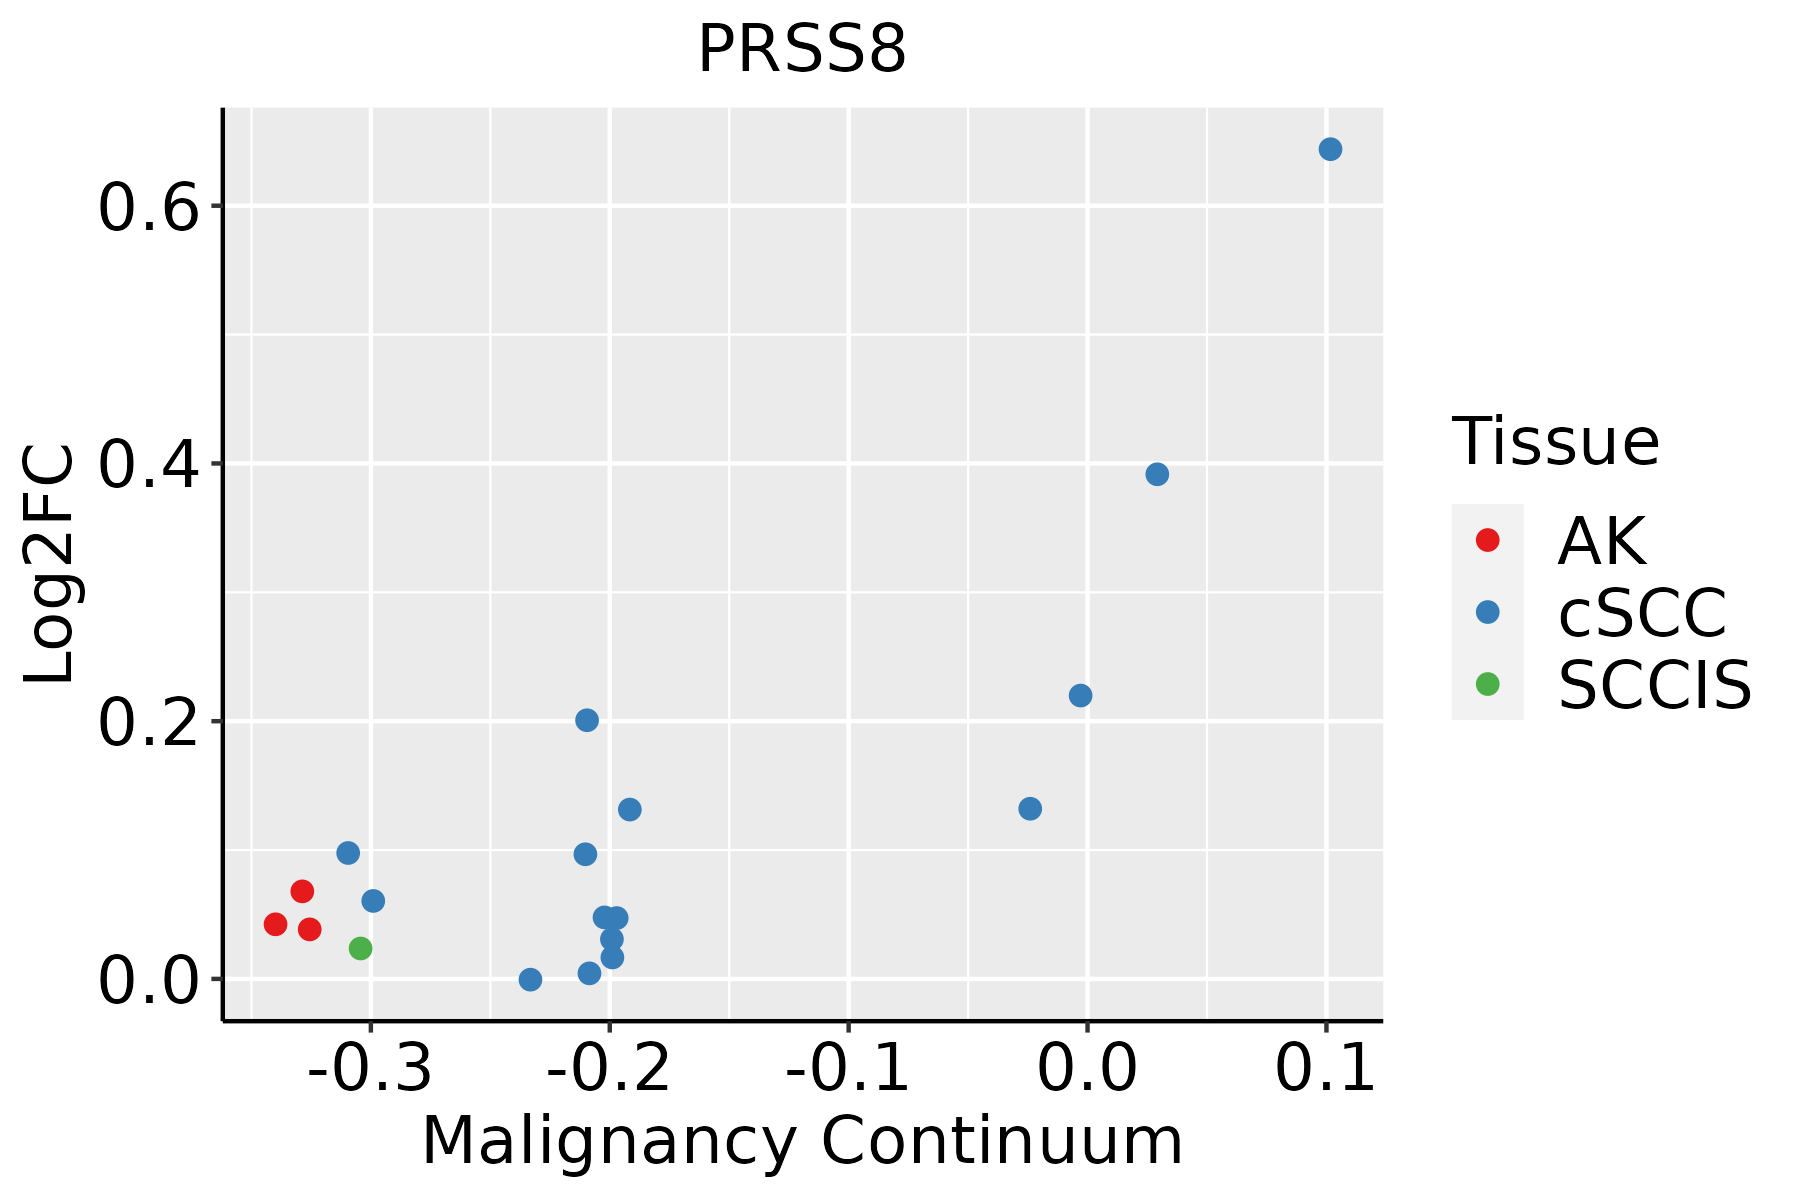 | AK: Actinic keratosis |
| cSCC: Cutaneous squamous cell carcinoma | ||
| SCCIS:squamous cell carcinoma in situ | ||
| Thyroid | 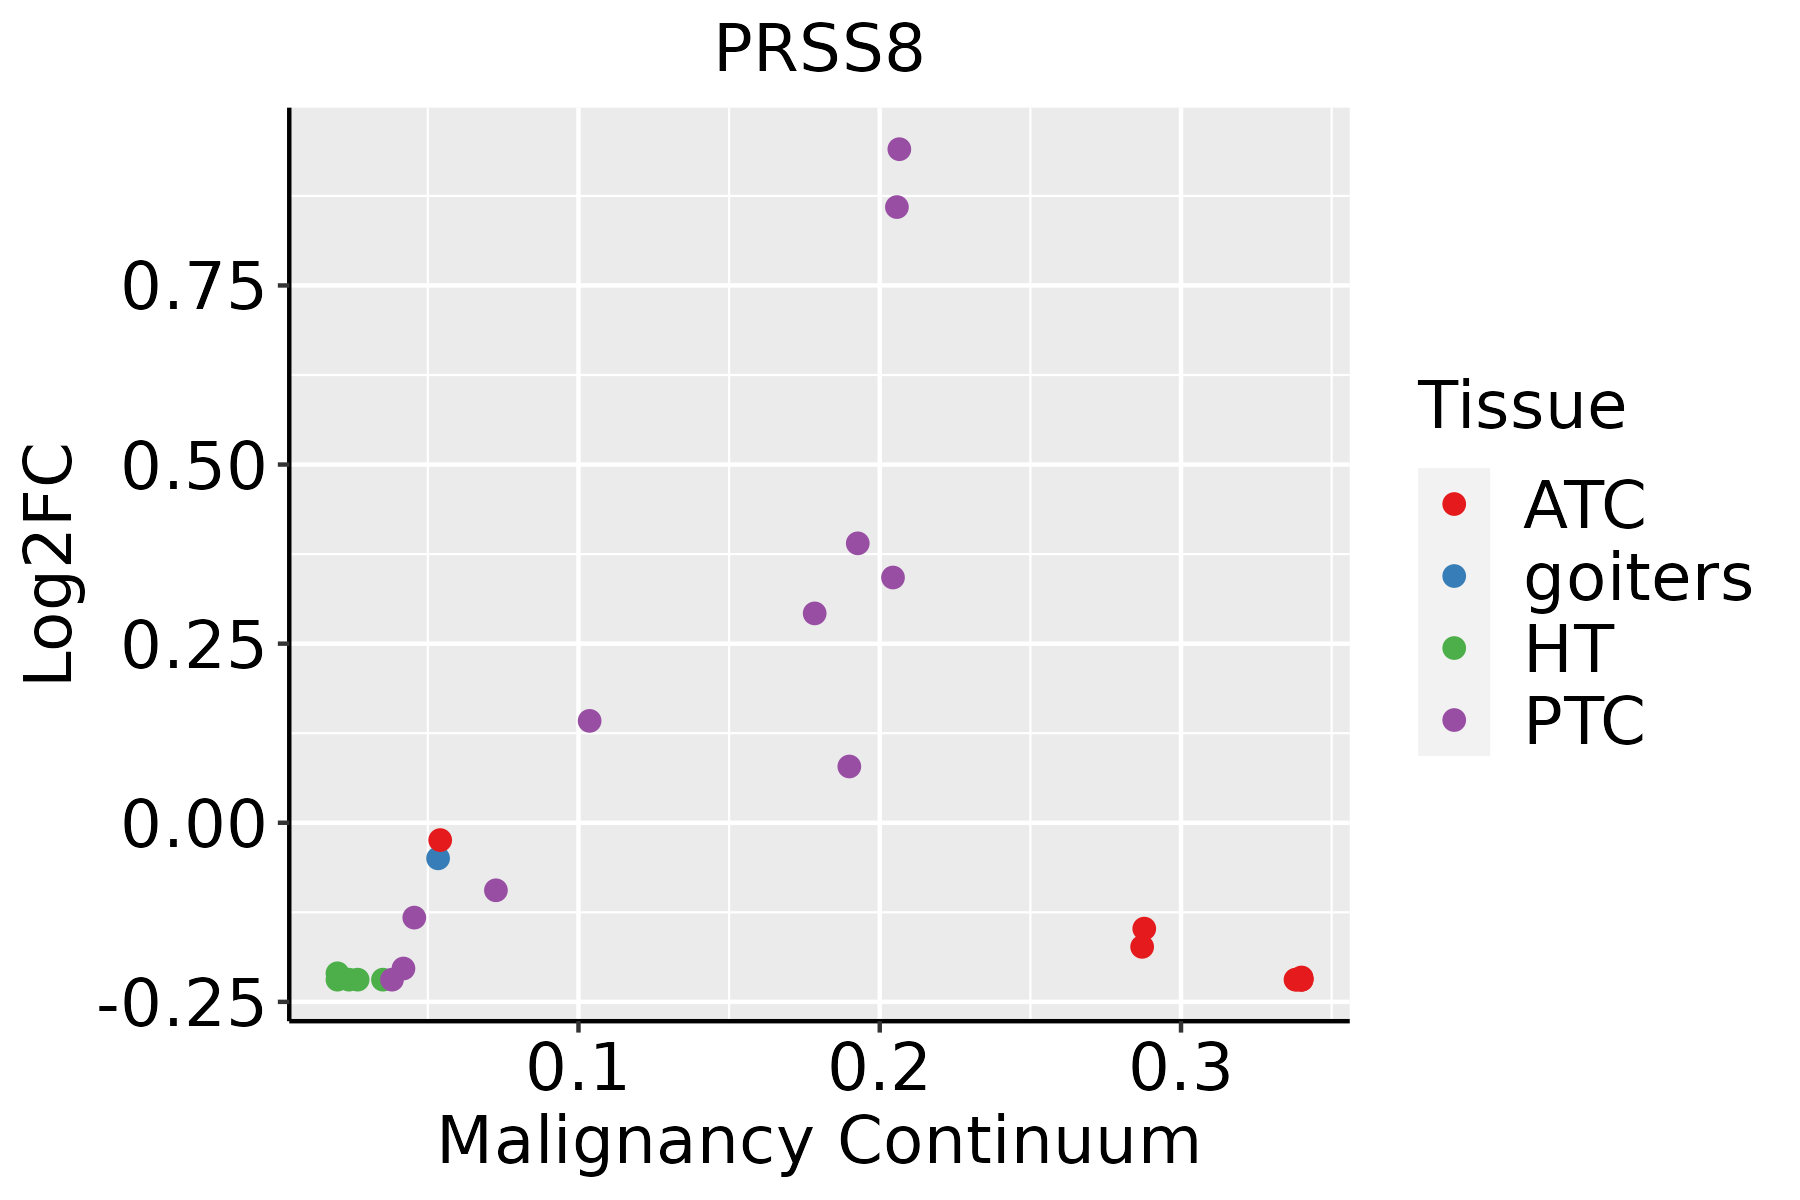 | ATC: Anaplastic thyroid cancer |
| HT: Hashimoto's thyroiditis | ||
| PTC: Papillary thyroid cancer |
| ∗log2FC in expression of this searched gene in stem-like cells from each diseased tissue sample relative to stem-like cells in normal samples in each tissue plotted against the malignancy continuum. Samples are colored based on if they are from different disease stage. |
Top |
Malignant transformation related pathway analysis |
| Find out the enriched GO biological processes and KEGG pathways involved in transition from healthy to precancer to cancer |
| Tissue | Disease Stage | Enriched GO biological Processes |
| Colorectum | AD |  |
| Colorectum | SER |  |
| Colorectum | MSS |  |
| Colorectum | MSI-H |  |
| Colorectum | FAP |  |
| ∗Top 15 enriched GO BP terms are showed in the bar plot of each disease state in each tissue. Each row represents a significant GO biological process which is colored according to the -log10(p.adjust). |
| Page: 1 2 3 4 5 6 7 8 9 |
| GO ID | Tissue | Disease Stage | Description | Gene Ratio | Bg Ratio | pvalue | p.adjust | Count |
| GO:00109596 | Breast | Precancer | regulation of metal ion transport | 37/1080 | 406/18723 | 4.07e-03 | 3.22e-02 | 37 |
| GO:001095913 | Breast | IDC | regulation of metal ion transport | 52/1434 | 406/18723 | 1.76e-04 | 2.97e-03 | 52 |
| GO:00432703 | Breast | IDC | positive regulation of ion transport | 36/1434 | 275/18723 | 1.11e-03 | 1.22e-02 | 36 |
| GO:001095921 | Breast | DCIS | regulation of metal ion transport | 50/1390 | 406/18723 | 2.86e-04 | 4.22e-03 | 50 |
| GO:004327011 | Breast | DCIS | positive regulation of ion transport | 34/1390 | 275/18723 | 2.35e-03 | 2.13e-02 | 34 |
| GO:00020288 | Cervix | CC | regulation of sodium ion transport | 21/2311 | 90/18723 | 2.71e-03 | 1.85e-02 | 21 |
| GO:001095914 | Endometrium | EEC | regulation of metal ion transport | 70/2168 | 406/18723 | 4.12e-04 | 4.35e-03 | 70 |
| GO:001076512 | Endometrium | EEC | positive regulation of sodium ion transport | 11/2168 | 35/18723 | 1.44e-03 | 1.17e-02 | 11 |
| GO:00020289 | Endometrium | EEC | regulation of sodium ion transport | 20/2168 | 90/18723 | 2.92e-03 | 2.06e-02 | 20 |
| GO:00107656 | Liver | Cirrhotic | positive regulation of sodium ion transport | 17/4634 | 35/18723 | 1.93e-03 | 1.21e-02 | 17 |
| Page: 1 |
| Pathway ID | Tissue | Disease Stage | Description | Gene Ratio | Bg Ratio | pvalue | p.adjust | qvalue | Count |
| Page: 1 |
Top |
Cell-cell communication analysis |
| Identification of potential cell-cell interactions between two cell types and their ligand-receptor pairs for different disease states |
| Ligand | Receptor | LRpair | Pathway | Tissue | Disease Stage |
| Page: 1 |
Top |
Single-cell gene regulatory network inference analysis |
| Find out the significant the regulons (TFs) and the target genes of each regulon across cell types for different disease states |
| TF | Cell Type | Tissue | Disease Stage | Target Gene | RSS | Regulon Activity |
| ∗The dot plots of a searched regulon are shown for all cell subpopulations in each disease state of each tissue based on the regulon specific score inferred using pySCENIC and by calculating the average expression. |
| Page: 1 |
Top |
Somatic mutation of malignant transformation related genes |
| Annotation of somatic variants for genes involved in malignant transformation |
| Hugo Symbol | Variant Class | Variant Classification | dbSNP RS | HGVSc | HGVSp | HGVSp Short | SWISSPROT | BIOTYPE | SIFT | PolyPhen | Tumor Sample Barcode | Tissue | Histology | Sex | Age | Stage | Therapy Types | Drugs | Outcome |
| PRSS8 | SNV | Missense_Mutation | novel | c.665N>G | p.Val222Gly | p.V222G | Q16651 | protein_coding | deleterious(0) | probably_damaging(0.922) | TCGA-BH-A0HA-01 | Breast | breast invasive carcinoma | Female | <65 | I/II | Unknown | Unknown | SD |
| PRSS8 | insertion | Frame_Shift_Ins | rs769337133 | c.534_535insC | p.Ser179LeufsTer21 | p.S179Lfs*21 | Q16651 | protein_coding | TCGA-AN-A0AK-01 | Breast | breast invasive carcinoma | Female | >=65 | I/II | Unknown | Unknown | SD | ||
| PRSS8 | insertion | Frame_Shift_Ins | novel | c.579_580insGTCTCGATCT | p.Pro194ValfsTer9 | p.P194Vfs*9 | Q16651 | protein_coding | TCGA-AN-A0FX-01 | Breast | breast invasive carcinoma | Female | <65 | I/II | Unknown | Unknown | SD | ||
| PRSS8 | insertion | Frame_Shift_Ins | novel | c.577_578insGGTTTCGCCACGTTGGCCAGGA | p.Val193GlyfsTer14 | p.V193Gfs*14 | Q16651 | protein_coding | TCGA-AN-A0FX-01 | Breast | breast invasive carcinoma | Female | <65 | I/II | Unknown | Unknown | SD | ||
| PRSS8 | SNV | Missense_Mutation | rs757490302 | c.599C>T | p.Thr200Met | p.T200M | Q16651 | protein_coding | deleterious(0.02) | probably_damaging(0.999) | TCGA-2W-A8YY-01 | Cervix | cervical & endocervical cancer | Female | <65 | I/II | Chemotherapy | cisplatin | CR |
| PRSS8 | SNV | Missense_Mutation | rs778802523 | c.671N>T | p.Ala224Val | p.A224V | Q16651 | protein_coding | deleterious(0) | probably_damaging(0.998) | TCGA-A6-2686-01 | Colorectum | colon adenocarcinoma | Female | >=65 | I/II | Unknown | Unknown | SD |
| PRSS8 | SNV | Missense_Mutation | c.841N>G | p.Ile281Val | p.I281V | Q16651 | protein_coding | deleterious(0) | probably_damaging(0.981) | TCGA-AA-A010-01 | Colorectum | colon adenocarcinoma | Female | <65 | I/II | Chemotherapy | folinic | CR | |
| PRSS8 | SNV | Missense_Mutation | rs779230970 | c.592C>T | p.Arg198Cys | p.R198C | Q16651 | protein_coding | deleterious(0.01) | probably_damaging(0.988) | TCGA-AA-A01D-01 | Colorectum | colon adenocarcinoma | Female | <65 | III/IV | Chemotherapy | capecitabine | PD |
| PRSS8 | SNV | Missense_Mutation | c.802N>T | p.Pro268Ser | p.P268S | Q16651 | protein_coding | deleterious(0) | probably_damaging(1) | TCGA-G4-6309-01 | Colorectum | colon adenocarcinoma | Female | <65 | III/IV | Chemotherapy | xeloda | PD | |
| PRSS8 | deletion | Frame_Shift_Del | c.883delN | p.Gln295LysfsTer27 | p.Q295Kfs*27 | Q16651 | protein_coding | TCGA-F4-6570-01 | Colorectum | colon adenocarcinoma | Female | >=65 | I/II | Unknown | Unknown | SD |
| Page: 1 2 3 |
Top |
Related drugs of malignant transformation related genes |
| Identification of chemicals and drugs interact with genes involved in malignant transfromation |
| (DGIdb 4.0) |
| Entrez ID | Symbol | Category | Interaction Types | Drug Claim Name | Drug Name | PMIDs |
| 5652 | PRSS8 | DRUGGABLE GENOME, PROTEASE, ENZYME, CLINICALLY ACTIONABLE | inhibitor | 223366189 |
| Page: 1 |

Copyright 2023-Present -The University of Texas Health Science Center at Houston |