
|
|||||
|
 | |
| |
| |
| |
| |
| |
|
Gene: PRSS3 |
Gene summary for PRSS3 |
| Gene information | Species | Human | Gene symbol | PRSS3 | Gene ID | 5646 |
| Gene name | serine protease 3 | |
| Gene Alias | MTG | |
| Cytomap | 9p13.3 | |
| Gene Type | protein-coding | GO ID | GO:0001667 | UniProtAcc | P35030 |
Top |
Malignant transformation analysis |
| Identification of the aberrant gene expression in precancerous and cancerous lesions by comparing the gene expression of stem-like cells in diseased tissues with normal stem cells |
| Entrez ID | Symbol | Replicates | Species | Organ | Tissue | Adj P-value | Log2FC | Malignancy |
| 5646 | PRSS3 | HTA11_3410_2000001011 | Human | Colorectum | AD | 9.54e-06 | -4.10e-01 | 0.0155 |
| 5646 | PRSS3 | HTA11_2487_2000001011 | Human | Colorectum | SER | 1.27e-11 | 8.61e-01 | -0.1808 |
| 5646 | PRSS3 | HTA11_347_2000001011 | Human | Colorectum | AD | 2.74e-26 | 9.21e-01 | -0.1954 |
| 5646 | PRSS3 | HTA11_411_2000001011 | Human | Colorectum | SER | 2.92e-10 | 1.55e+00 | -0.2602 |
| 5646 | PRSS3 | HTA11_2112_2000001011 | Human | Colorectum | SER | 2.58e-10 | 1.26e+00 | -0.2196 |
| 5646 | PRSS3 | HTA11_83_2000001011 | Human | Colorectum | SER | 2.85e-03 | 4.75e-01 | -0.1526 |
| 5646 | PRSS3 | HTA11_696_2000001011 | Human | Colorectum | AD | 1.29e-02 | 4.66e-01 | -0.1464 |
| 5646 | PRSS3 | HTA11_1391_2000001011 | Human | Colorectum | AD | 1.64e-03 | 4.83e-01 | -0.059 |
| 5646 | PRSS3 | HTA11_2992_2000001011 | Human | Colorectum | SER | 2.71e-02 | 6.67e-01 | -0.1706 |
| 5646 | PRSS3 | HTA11_5212_2000001011 | Human | Colorectum | AD | 3.88e-02 | 5.34e-01 | -0.2061 |
| 5646 | PRSS3 | HTA11_99999965062_69753 | Human | Colorectum | MSI-H | 5.82e-07 | 8.92e-01 | 0.3487 |
| 5646 | PRSS3 | HTA11_99999965104_69814 | Human | Colorectum | MSS | 7.13e-03 | 4.10e-01 | 0.281 |
| 5646 | PRSS3 | A001-C-207 | Human | Colorectum | FAP | 4.04e-02 | -2.35e-01 | 0.1278 |
| 5646 | PRSS3 | A015-C-203 | Human | Colorectum | FAP | 3.76e-30 | -5.20e-01 | -0.1294 |
| 5646 | PRSS3 | A015-C-204 | Human | Colorectum | FAP | 4.03e-03 | -2.00e-01 | -0.0228 |
| 5646 | PRSS3 | A014-C-040 | Human | Colorectum | FAP | 5.59e-05 | -6.24e-01 | -0.1184 |
| 5646 | PRSS3 | A002-C-201 | Human | Colorectum | FAP | 1.59e-12 | -4.53e-01 | 0.0324 |
| 5646 | PRSS3 | A002-C-203 | Human | Colorectum | FAP | 2.22e-05 | -1.66e-01 | 0.2786 |
| 5646 | PRSS3 | A001-C-119 | Human | Colorectum | FAP | 6.05e-10 | -6.16e-01 | -0.1557 |
| 5646 | PRSS3 | A001-C-108 | Human | Colorectum | FAP | 2.00e-14 | -2.95e-01 | -0.0272 |
| Page: 1 2 3 4 5 |
| Tissue | Expression Dynamics | Abbreviation |
| Colorectum (GSE201348) | 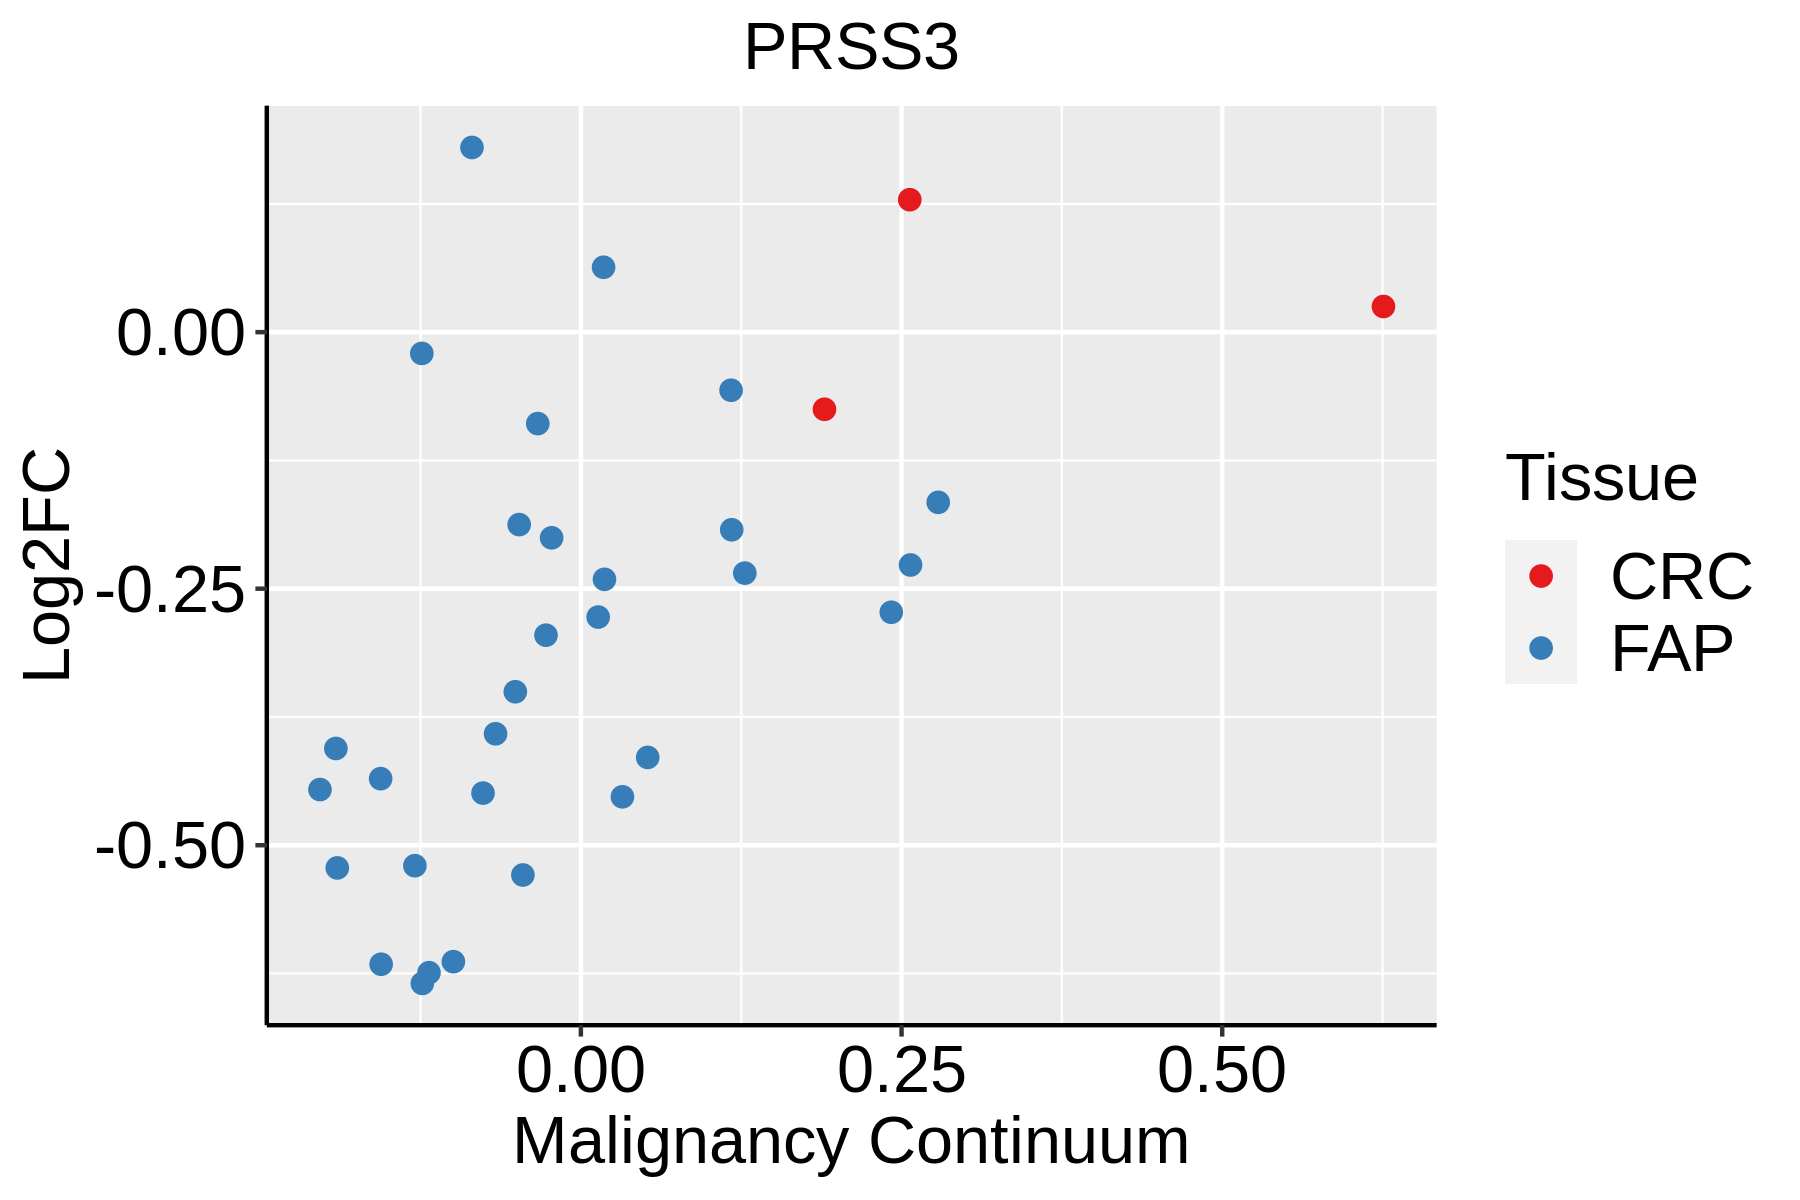 | FAP: Familial adenomatous polyposis |
| CRC: Colorectal cancer | ||
| Colorectum (HTA11) | 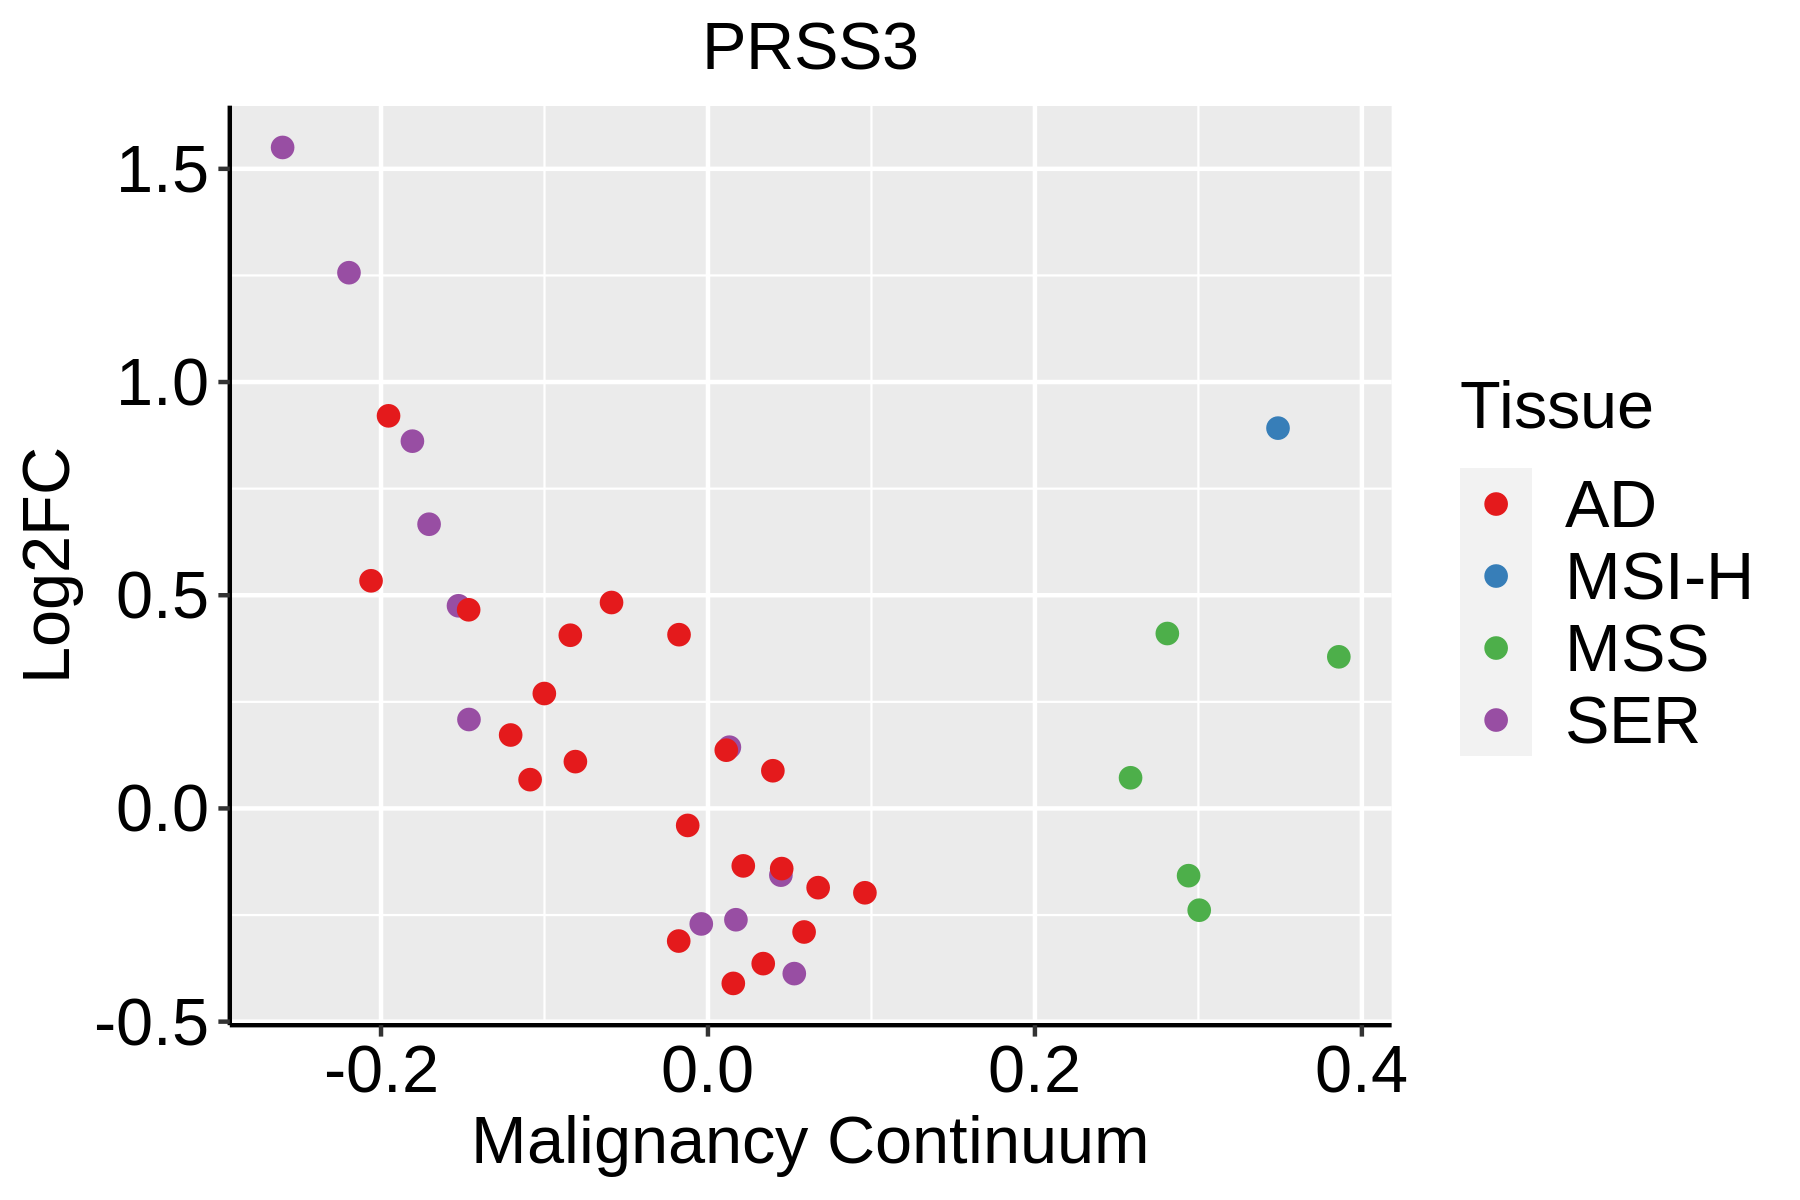 | AD: Adenomas |
| SER: Sessile serrated lesions | ||
| MSI-H: Microsatellite-high colorectal cancer | ||
| MSS: Microsatellite stable colorectal cancer | ||
| Esophagus | 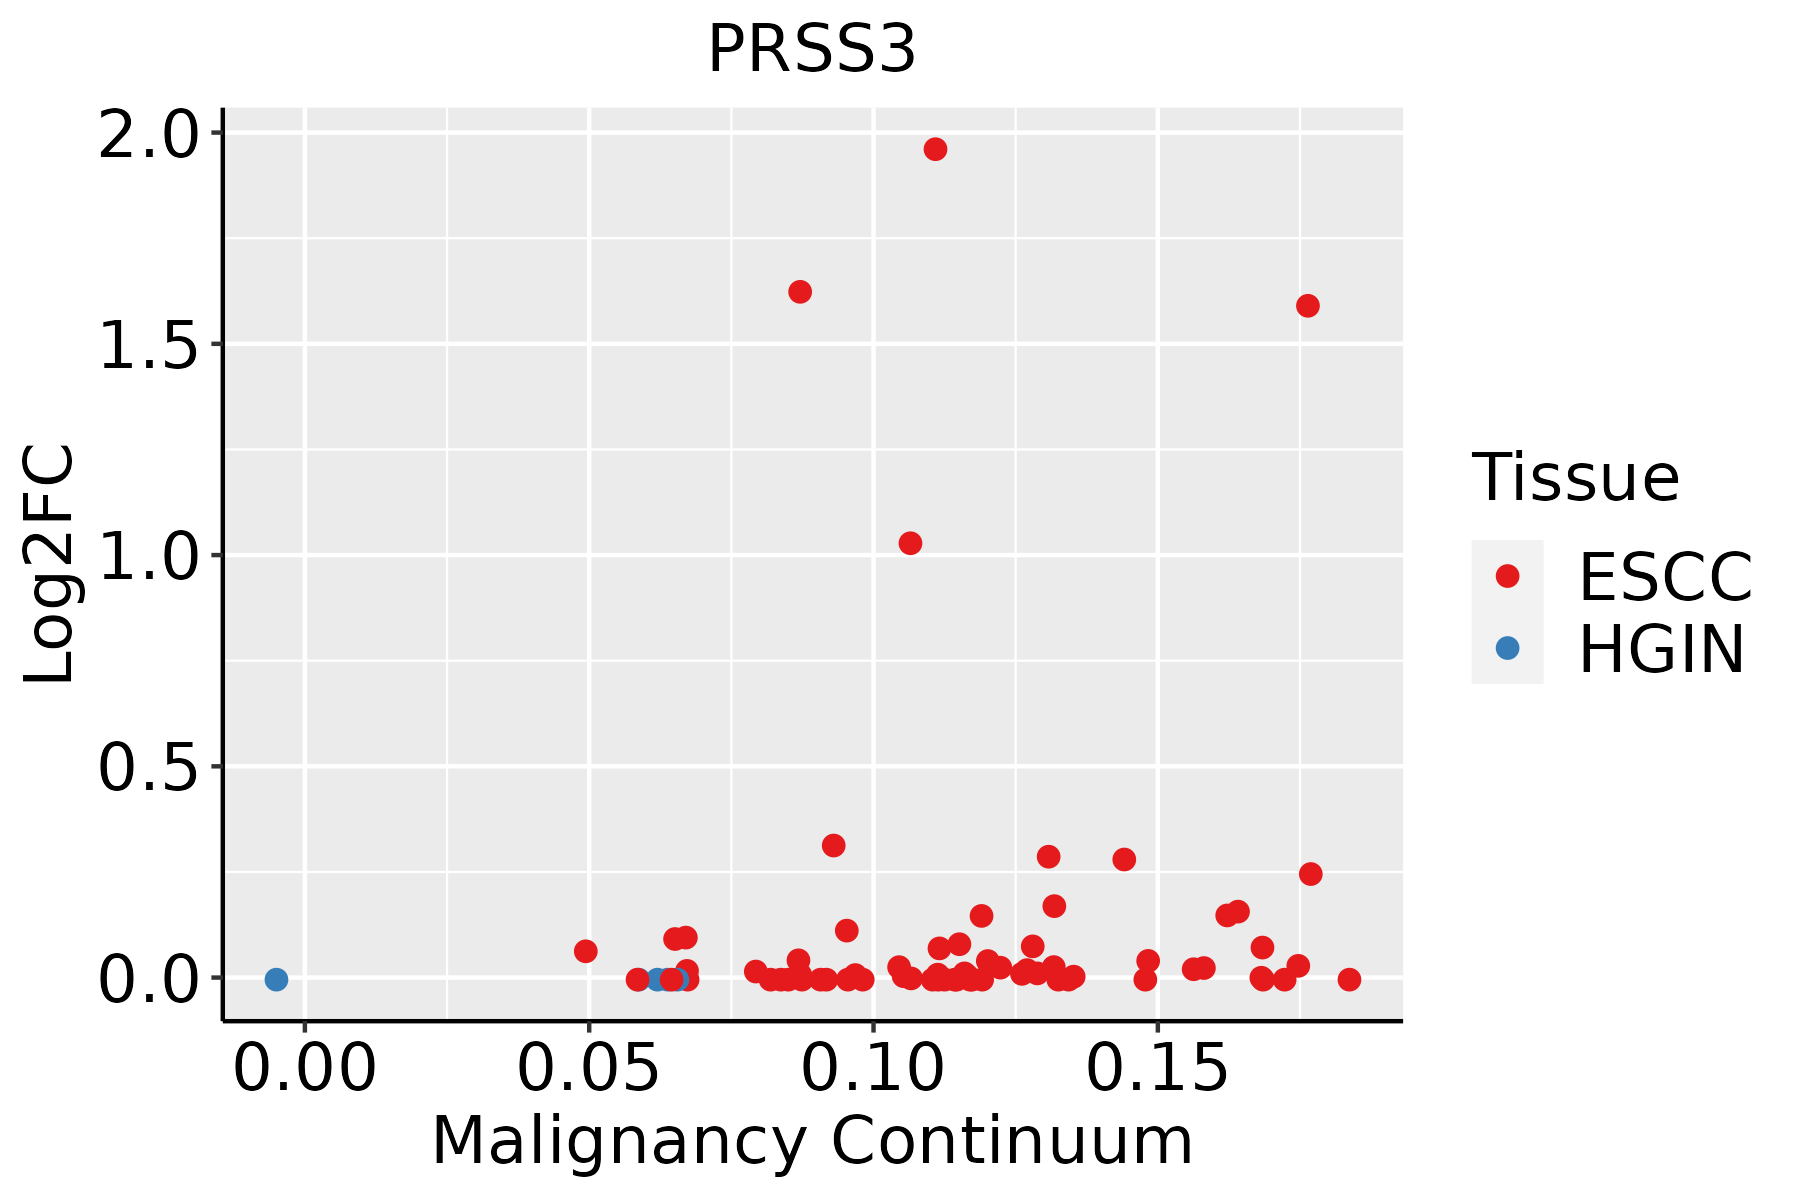 | ESCC: Esophageal squamous cell carcinoma |
| HGIN: High-grade intraepithelial neoplasias | ||
| LGIN: Low-grade intraepithelial neoplasias | ||
| GC | 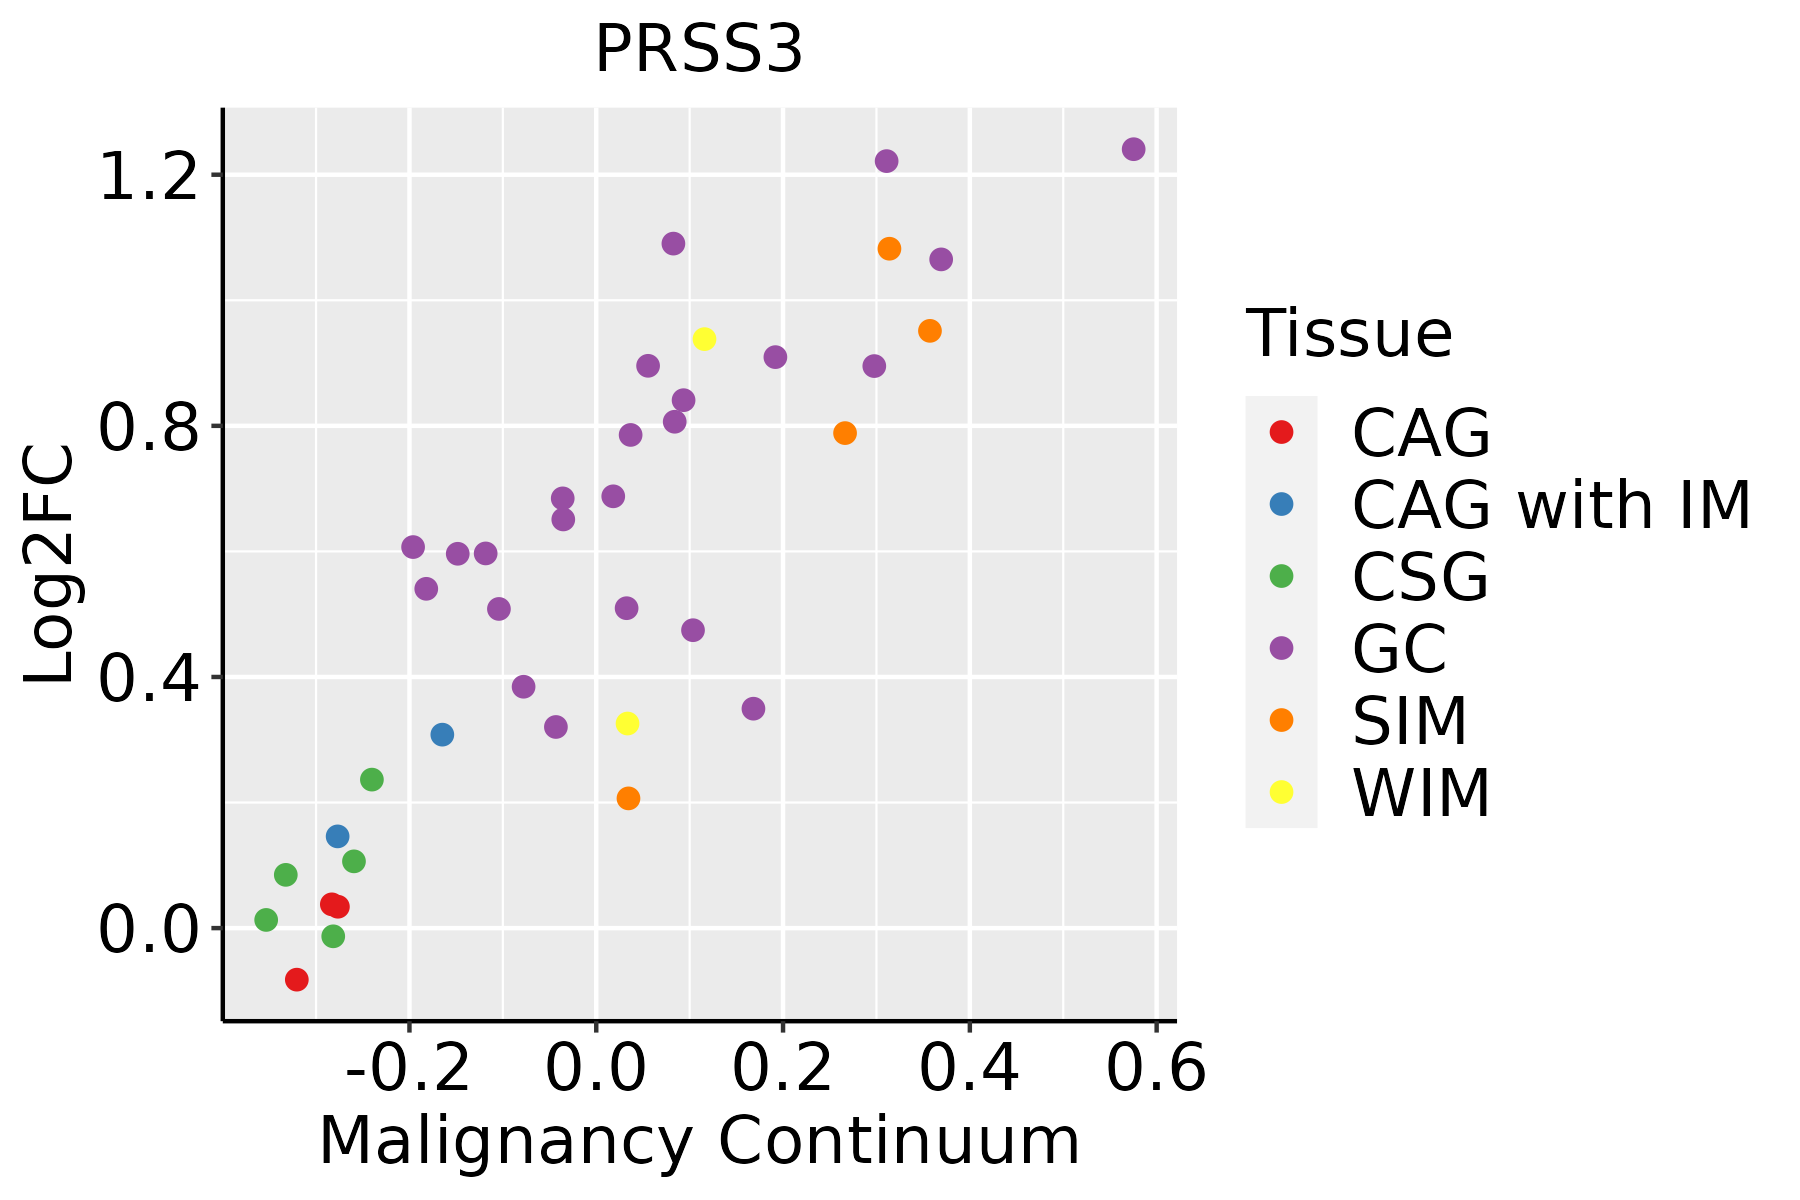 | CAG: Chronic atrophic gastritis |
| CAG with IM: Chronic atrophic gastritis with intestinal metaplasia | ||
| CSG: Chronic superficial gastritis | ||
| GC: Gastric cancer | ||
| SIM: Severe intestinal metaplasia | ||
| WIM: Wild intestinal metaplasia | ||
| Skin | 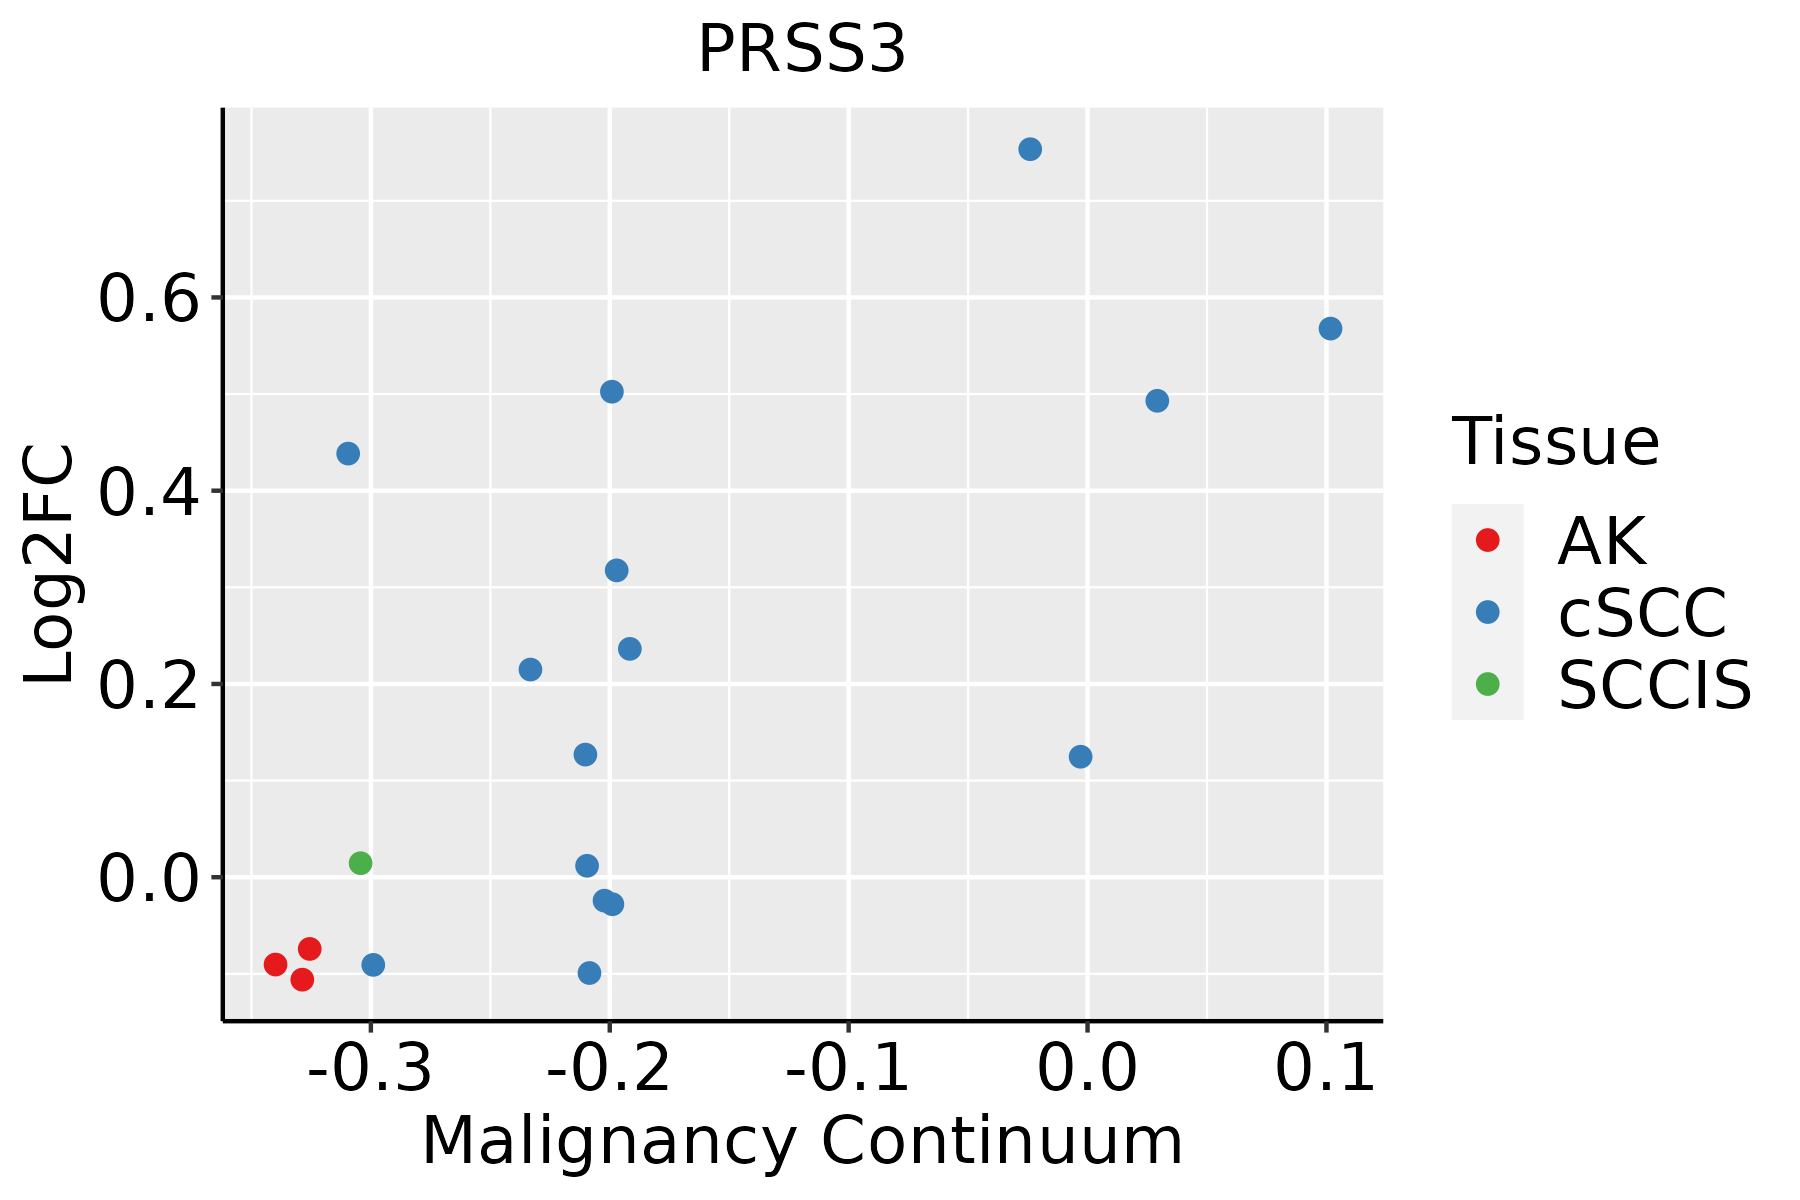 | AK: Actinic keratosis |
| cSCC: Cutaneous squamous cell carcinoma | ||
| SCCIS:squamous cell carcinoma in situ |
| ∗log2FC in expression of this searched gene in stem-like cells from each diseased tissue sample relative to stem-like cells in normal samples in each tissue plotted against the malignancy continuum. Samples are colored based on if they are from different disease stage. |
Top |
Malignant transformation related pathway analysis |
| Find out the enriched GO biological processes and KEGG pathways involved in transition from healthy to precancer to cancer |
| Tissue | Disease Stage | Enriched GO biological Processes |
| Colorectum | AD |  |
| Colorectum | SER |  |
| Colorectum | MSS |  |
| Colorectum | MSI-H |  |
| Colorectum | FAP |  |
| ∗Top 15 enriched GO BP terms are showed in the bar plot of each disease state in each tissue. Each row represents a significant GO biological process which is colored according to the -log10(p.adjust). |
| Page: 1 2 3 4 5 6 7 8 9 |
| GO ID | Tissue | Disease Stage | Description | Gene Ratio | Bg Ratio | pvalue | p.adjust | Count |
| GO:0001667 | Colorectum | AD | ameboidal-type cell migration | 137/3918 | 475/18723 | 2.17e-05 | 4.33e-04 | 137 |
| GO:0090132 | Colorectum | AD | epithelium migration | 105/3918 | 360/18723 | 1.18e-04 | 1.73e-03 | 105 |
| GO:0010631 | Colorectum | AD | epithelial cell migration | 104/3918 | 357/18723 | 1.33e-04 | 1.90e-03 | 104 |
| GO:0090130 | Colorectum | AD | tissue migration | 105/3918 | 365/18723 | 2.10e-04 | 2.77e-03 | 105 |
| GO:0051604 | Colorectum | AD | protein maturation | 85/3918 | 294/18723 | 6.73e-04 | 6.91e-03 | 85 |
| GO:0043542 | Colorectum | AD | endothelial cell migration | 78/3918 | 279/18723 | 2.97e-03 | 2.22e-02 | 78 |
| GO:0016485 | Colorectum | AD | protein processing | 63/3918 | 225/18723 | 6.77e-03 | 4.19e-02 | 63 |
| GO:00516041 | Colorectum | SER | protein maturation | 73/2897 | 294/18723 | 1.82e-05 | 5.38e-04 | 73 |
| GO:00016671 | Colorectum | SER | ameboidal-type cell migration | 105/2897 | 475/18723 | 6.97e-05 | 1.59e-03 | 105 |
| GO:00901321 | Colorectum | SER | epithelium migration | 82/2897 | 360/18723 | 1.50e-04 | 2.93e-03 | 82 |
| GO:00106311 | Colorectum | SER | epithelial cell migration | 81/2897 | 357/18723 | 1.87e-04 | 3.44e-03 | 81 |
| GO:00901301 | Colorectum | SER | tissue migration | 82/2897 | 365/18723 | 2.40e-04 | 4.12e-03 | 82 |
| GO:00164851 | Colorectum | SER | protein processing | 55/2897 | 225/18723 | 2.84e-04 | 4.67e-03 | 55 |
| GO:00435421 | Colorectum | SER | endothelial cell migration | 61/2897 | 279/18723 | 2.76e-03 | 2.47e-02 | 61 |
| GO:00016672 | Colorectum | MSS | ameboidal-type cell migration | 120/3467 | 475/18723 | 1.37e-04 | 2.05e-03 | 120 |
| GO:00901322 | Colorectum | MSS | epithelium migration | 93/3467 | 360/18723 | 3.30e-04 | 4.24e-03 | 93 |
| GO:00106312 | Colorectum | MSS | epithelial cell migration | 92/3467 | 357/18723 | 3.87e-04 | 4.86e-03 | 92 |
| GO:00901302 | Colorectum | MSS | tissue migration | 93/3467 | 365/18723 | 5.42e-04 | 6.06e-03 | 93 |
| GO:00516042 | Colorectum | MSS | protein maturation | 75/3467 | 294/18723 | 1.70e-03 | 1.53e-02 | 75 |
| GO:00435422 | Colorectum | MSS | endothelial cell migration | 70/3467 | 279/18723 | 3.69e-03 | 2.71e-02 | 70 |
| Page: 1 2 3 4 |
| Pathway ID | Tissue | Disease Stage | Description | Gene Ratio | Bg Ratio | pvalue | p.adjust | qvalue | Count |
| hsa04972 | Colorectum | AD | Pancreatic secretion | 36/2092 | 102/8465 | 1.06e-02 | 3.98e-02 | 2.54e-02 | 36 |
| hsa049721 | Colorectum | AD | Pancreatic secretion | 36/2092 | 102/8465 | 1.06e-02 | 3.98e-02 | 2.54e-02 | 36 |
| hsa049722 | Colorectum | SER | Pancreatic secretion | 30/1580 | 102/8465 | 5.41e-03 | 3.28e-02 | 2.38e-02 | 30 |
| hsa049723 | Colorectum | SER | Pancreatic secretion | 30/1580 | 102/8465 | 5.41e-03 | 3.28e-02 | 2.38e-02 | 30 |
| hsa049724 | Colorectum | MSS | Pancreatic secretion | 33/1875 | 102/8465 | 1.09e-02 | 3.75e-02 | 2.30e-02 | 33 |
| hsa049725 | Colorectum | MSS | Pancreatic secretion | 33/1875 | 102/8465 | 1.09e-02 | 3.75e-02 | 2.30e-02 | 33 |
| hsa049726 | Colorectum | FAP | Pancreatic secretion | 34/1404 | 102/8465 | 2.43e-05 | 2.78e-04 | 1.69e-04 | 34 |
| hsa049727 | Colorectum | FAP | Pancreatic secretion | 34/1404 | 102/8465 | 2.43e-05 | 2.78e-04 | 1.69e-04 | 34 |
| hsa049728 | Colorectum | CRC | Pancreatic secretion | 32/1091 | 102/8465 | 7.86e-07 | 4.37e-05 | 2.96e-05 | 32 |
| hsa049729 | Colorectum | CRC | Pancreatic secretion | 32/1091 | 102/8465 | 7.86e-07 | 4.37e-05 | 2.96e-05 | 32 |
| hsa0516425 | Esophagus | ESCC | Influenza A | 122/4205 | 171/8465 | 5.01e-09 | 4.79e-08 | 2.45e-08 | 122 |
| hsa0516435 | Esophagus | ESCC | Influenza A | 122/4205 | 171/8465 | 5.01e-09 | 4.79e-08 | 2.45e-08 | 122 |
| hsa05164 | Stomach | GC | Influenza A | 27/708 | 171/8465 | 9.20e-04 | 7.01e-03 | 4.94e-03 | 27 |
| hsa051641 | Stomach | GC | Influenza A | 27/708 | 171/8465 | 9.20e-04 | 7.01e-03 | 4.94e-03 | 27 |
| hsa051642 | Stomach | CAG with IM | Influenza A | 26/640 | 171/8465 | 4.49e-04 | 4.08e-03 | 2.87e-03 | 26 |
| hsa051643 | Stomach | CAG with IM | Influenza A | 26/640 | 171/8465 | 4.49e-04 | 4.08e-03 | 2.87e-03 | 26 |
| hsa051644 | Stomach | CSG | Influenza A | 26/633 | 171/8465 | 3.79e-04 | 3.33e-03 | 2.40e-03 | 26 |
| hsa051645 | Stomach | CSG | Influenza A | 26/633 | 171/8465 | 3.79e-04 | 3.33e-03 | 2.40e-03 | 26 |
| hsa051646 | Stomach | WIM | Influenza A | 13/284 | 171/8465 | 4.89e-03 | 3.26e-02 | 2.60e-02 | 13 |
| hsa051647 | Stomach | WIM | Influenza A | 13/284 | 171/8465 | 4.89e-03 | 3.26e-02 | 2.60e-02 | 13 |
| Page: 1 2 |
Top |
Cell-cell communication analysis |
| Identification of potential cell-cell interactions between two cell types and their ligand-receptor pairs for different disease states |
| Ligand | Receptor | LRpair | Pathway | Tissue | Disease Stage |
| PRSS3 | F2R | PRSS3_F2R | PARs | Cervix | CC |
| PRSS3 | PARD3 | PRSS3_PARD3 | PARs | Cervix | CC |
| PRSS3 | F2R | PRSS3_F2R | PARs | CRC | AD |
| PRSS3 | F2RL3 | PRSS3_F2RL3 | PARs | CRC | AD |
| PRSS3 | PARD3 | PRSS3_PARD3 | PARs | CRC | AD |
| PRSS3 | PARD3 | PRSS3_PARD3 | PARs | CRC | ADJ |
| PRSS3 | F2R | PRSS3_F2R | PARs | CRC | CRC |
| PRSS3 | PARD3 | PRSS3_PARD3 | PARs | CRC | CRC |
| PRSS3 | PARD3 | PRSS3_PARD3 | PARs | CRC | Healthy |
| PRSS3 | F2R | PRSS3_F2R | PARs | CRC | MSI-H |
| PRSS3 | PARD3 | PRSS3_PARD3 | PARs | CRC | MSI-H |
| PRSS3 | PARD3 | PRSS3_PARD3 | PARs | CRC | MSS |
| PRSS3 | F2R | PRSS3_F2R | PARs | Esophagus | ADJ |
| PRSS3 | PARD3 | PRSS3_PARD3 | PARs | Esophagus | ADJ |
| PRSS3 | F2R | PRSS3_F2R | PARs | GC | ADJ |
| PRSS3 | PARD3 | PRSS3_PARD3 | PARs | GC | ADJ |
| PRSS3 | F2R | PRSS3_F2R | PARs | GC | GC |
| PRSS3 | PARD3 | PRSS3_PARD3 | PARs | GC | GC |
| PRSS3 | F2R | PRSS3_F2R | PARs | HNSCC | ADJ |
| PRSS3 | PARD3 | PRSS3_PARD3 | PARs | HNSCC | ADJ |
| Page: 1 2 |
Top |
Single-cell gene regulatory network inference analysis |
| Find out the significant the regulons (TFs) and the target genes of each regulon across cell types for different disease states |
| TF | Cell Type | Tissue | Disease Stage | Target Gene | RSS | Regulon Activity |
| ∗The dot plots of a searched regulon are shown for all cell subpopulations in each disease state of each tissue based on the regulon specific score inferred using pySCENIC and by calculating the average expression. |
| Page: 1 |
Top |
Somatic mutation of malignant transformation related genes |
| Annotation of somatic variants for genes involved in malignant transformation |
| Hugo Symbol | Variant Class | Variant Classification | dbSNP RS | HGVSc | HGVSp | HGVSp Short | SWISSPROT | BIOTYPE | SIFT | PolyPhen | Tumor Sample Barcode | Tissue | Histology | Sex | Age | Stage | Therapy Types | Drugs | Outcome |
| PRSS3 | SNV | Missense_Mutation | c.750G>T | p.Lys250Asn | p.K250N | P35030 | protein_coding | deleterious(0) | probably_damaging(0.996) | TCGA-AO-A128-01 | Breast | breast invasive carcinoma | Female | <65 | I/II | Chemotherapy | doxorubicin | SD | |
| PRSS3 | SNV | Missense_Mutation | c.504N>G | p.Ile168Met | p.I168M | P35030 | protein_coding | deleterious(0.04) | probably_damaging(0.968) | TCGA-E9-A1R7-01 | Breast | breast invasive carcinoma | Female | <65 | I/II | Hormone Therapy | fareston | SD | |
| PRSS3 | SNV | Missense_Mutation | c.490N>A | p.Asp164Asn | p.D164N | P35030 | protein_coding | deleterious(0.02) | probably_damaging(1) | TCGA-CI-6623-01 | Colorectum | rectum adenocarcinoma | Male | <65 | I/II | Unknown | Unknown | SD | |
| PRSS3 | SNV | Missense_Mutation | c.267N>T | p.Glu89Asp | p.E89D | P35030 | protein_coding | tolerated(0.18) | benign(0.113) | TCGA-F5-6814-01 | Colorectum | rectum adenocarcinoma | Male | <65 | I/II | Unknown | Unknown | SD | |
| PRSS3 | SNV | Missense_Mutation | rs181280420 | c.640N>A | p.Glu214Lys | p.E214K | P35030 | protein_coding | tolerated(0.89) | benign(0.164) | TCGA-AJ-A3EL-01 | Endometrium | uterine corpus endometrioid carcinoma | Female | <65 | I/II | Unknown | Unknown | SD |
| PRSS3 | SNV | Missense_Mutation | rs147576552 | c.901N>A | p.Ala301Thr | p.A301T | P35030 | protein_coding | deleterious(0.04) | benign(0.034) | TCGA-AJ-A3OJ-01 | Endometrium | uterine corpus endometrioid carcinoma | Female | <65 | I/II | Chemotherapy | carboplatin | CR |
| PRSS3 | SNV | Missense_Mutation | novel | c.578G>T | p.Gly193Val | p.G193V | P35030 | protein_coding | deleterious(0) | probably_damaging(0.983) | TCGA-AP-A056-01 | Endometrium | uterine corpus endometrioid carcinoma | Female | <65 | I/II | Unknown | Unknown | SD |
| PRSS3 | SNV | Missense_Mutation | c.637N>T | p.Asp213Tyr | p.D213Y | P35030 | protein_coding | deleterious(0.02) | probably_damaging(0.971) | TCGA-AP-A059-01 | Endometrium | uterine corpus endometrioid carcinoma | Female | >=65 | I/II | Unknown | Unknown | SD | |
| PRSS3 | SNV | Missense_Mutation | novel | c.575C>T | p.Ala192Val | p.A192V | P35030 | protein_coding | tolerated(0.08) | benign(0.063) | TCGA-AP-A1DH-01 | Endometrium | uterine corpus endometrioid carcinoma | Female | <65 | I/II | Unknown | Unknown | SD |
| PRSS3 | SNV | Missense_Mutation | rs147576552 | c.901N>A | p.Ala301Thr | p.A301T | P35030 | protein_coding | deleterious(0.04) | benign(0.034) | TCGA-AX-A2HD-01 | Endometrium | uterine corpus endometrioid carcinoma | Female | >=65 | III/IV | Unknown | Unknown | SD |
| Page: 1 2 |
Top |
Related drugs of malignant transformation related genes |
| Identification of chemicals and drugs interact with genes involved in malignant transfromation |
| (DGIdb 4.0) |
| Entrez ID | Symbol | Category | Interaction Types | Drug Claim Name | Drug Name | PMIDs |
| 5646 | PRSS3 | ENZYME, PROTEASE, DRUGGABLE GENOME | CYANOPEPTOLIN SS | CYANOPEPTOLIN SS | ||
| 5646 | PRSS3 | ENZYME, PROTEASE, DRUGGABLE GENOME | CYANOPEPTOLIN S | CYANOPEPTOLIN S | ||
| 5646 | PRSS3 | ENZYME, PROTEASE, DRUGGABLE GENOME | DERMOLASTIN | |||
| 5646 | PRSS3 | ENZYME, PROTEASE, DRUGGABLE GENOME | inhibitor | 315661094 | ||
| 5646 | PRSS3 | ENZYME, PROTEASE, DRUGGABLE GENOME | BORTEZOMIB | BORTEZOMIB | 20875739 |
| Page: 1 |

Copyright 2023-Present -The University of Texas Health Science Center at Houston |