
|
|||||
|
 | |
| |
| |
| |
| |
| |
|
Gene: PRSS22 |
Gene summary for PRSS22 |
| Gene information | Species | Human | Gene symbol | PRSS22 | Gene ID | 64063 |
| Gene name | serine protease 22 | |
| Gene Alias | BSSP-4 | |
| Cytomap | 16p13.3 | |
| Gene Type | protein-coding | GO ID | GO:0006508 | UniProtAcc | Q9GZN4 |
Top |
Malignant transformation analysis |
| Identification of the aberrant gene expression in precancerous and cancerous lesions by comparing the gene expression of stem-like cells in diseased tissues with normal stem cells |
| Entrez ID | Symbol | Replicates | Species | Organ | Tissue | Adj P-value | Log2FC | Malignancy |
| 64063 | PRSS22 | sample3 | Human | Cervix | CC | 1.83e-11 | 3.61e-01 | 0.1387 |
| 64063 | PRSS22 | H2 | Human | Cervix | HSIL_HPV | 1.98e-29 | 8.29e-01 | 0.0632 |
| 64063 | PRSS22 | L1 | Human | Cervix | CC | 4.26e-03 | 4.66e-01 | 0.0802 |
| 64063 | PRSS22 | T1 | Human | Cervix | CC | 4.07e-02 | 3.38e-01 | 0.0918 |
| 64063 | PRSS22 | T3 | Human | Cervix | CC | 5.27e-08 | 3.37e-01 | 0.1389 |
| 64063 | PRSS22 | HTA11_411_2000001011 | Human | Colorectum | SER | 1.99e-03 | 6.09e-01 | -0.2602 |
| 64063 | PRSS22 | HTA11_99999971662_82457 | Human | Colorectum | MSS | 1.36e-02 | 2.00e-01 | 0.3859 |
| 64063 | PRSS22 | HTA11_99999973899_84307 | Human | Colorectum | MSS | 2.36e-03 | 2.60e-01 | 0.2585 |
| 64063 | PRSS22 | HTA11_99999974143_84620 | Human | Colorectum | MSS | 1.03e-14 | 3.39e-01 | 0.3005 |
| 64063 | PRSS22 | LZE4T | Human | Esophagus | ESCC | 1.70e-02 | -1.78e-02 | 0.0811 |
| 64063 | PRSS22 | LZE5T | Human | Esophagus | ESCC | 1.98e-10 | 1.12e+00 | 0.0514 |
| 64063 | PRSS22 | LZE8T | Human | Esophagus | ESCC | 5.94e-12 | 6.08e-01 | 0.067 |
| 64063 | PRSS22 | LZE22T | Human | Esophagus | ESCC | 8.43e-11 | 1.79e+00 | 0.068 |
| 64063 | PRSS22 | LZE24T | Human | Esophagus | ESCC | 1.83e-20 | 1.77e+00 | 0.0596 |
| 64063 | PRSS22 | P1T-E | Human | Esophagus | ESCC | 1.84e-13 | 3.36e+00 | 0.0875 |
| 64063 | PRSS22 | P2T-E | Human | Esophagus | ESCC | 3.83e-20 | 5.90e-01 | 0.1177 |
| 64063 | PRSS22 | P4T-E | Human | Esophagus | ESCC | 1.59e-04 | 2.95e-01 | 0.1323 |
| 64063 | PRSS22 | P5T-E | Human | Esophagus | ESCC | 3.14e-16 | 3.56e-01 | 0.1327 |
| 64063 | PRSS22 | P8T-E | Human | Esophagus | ESCC | 5.24e-83 | 2.01e+00 | 0.0889 |
| 64063 | PRSS22 | P9T-E | Human | Esophagus | ESCC | 1.62e-05 | 2.98e-03 | 0.1131 |
| Page: 1 2 3 4 5 |
| Tissue | Expression Dynamics | Abbreviation |
| Cervix | 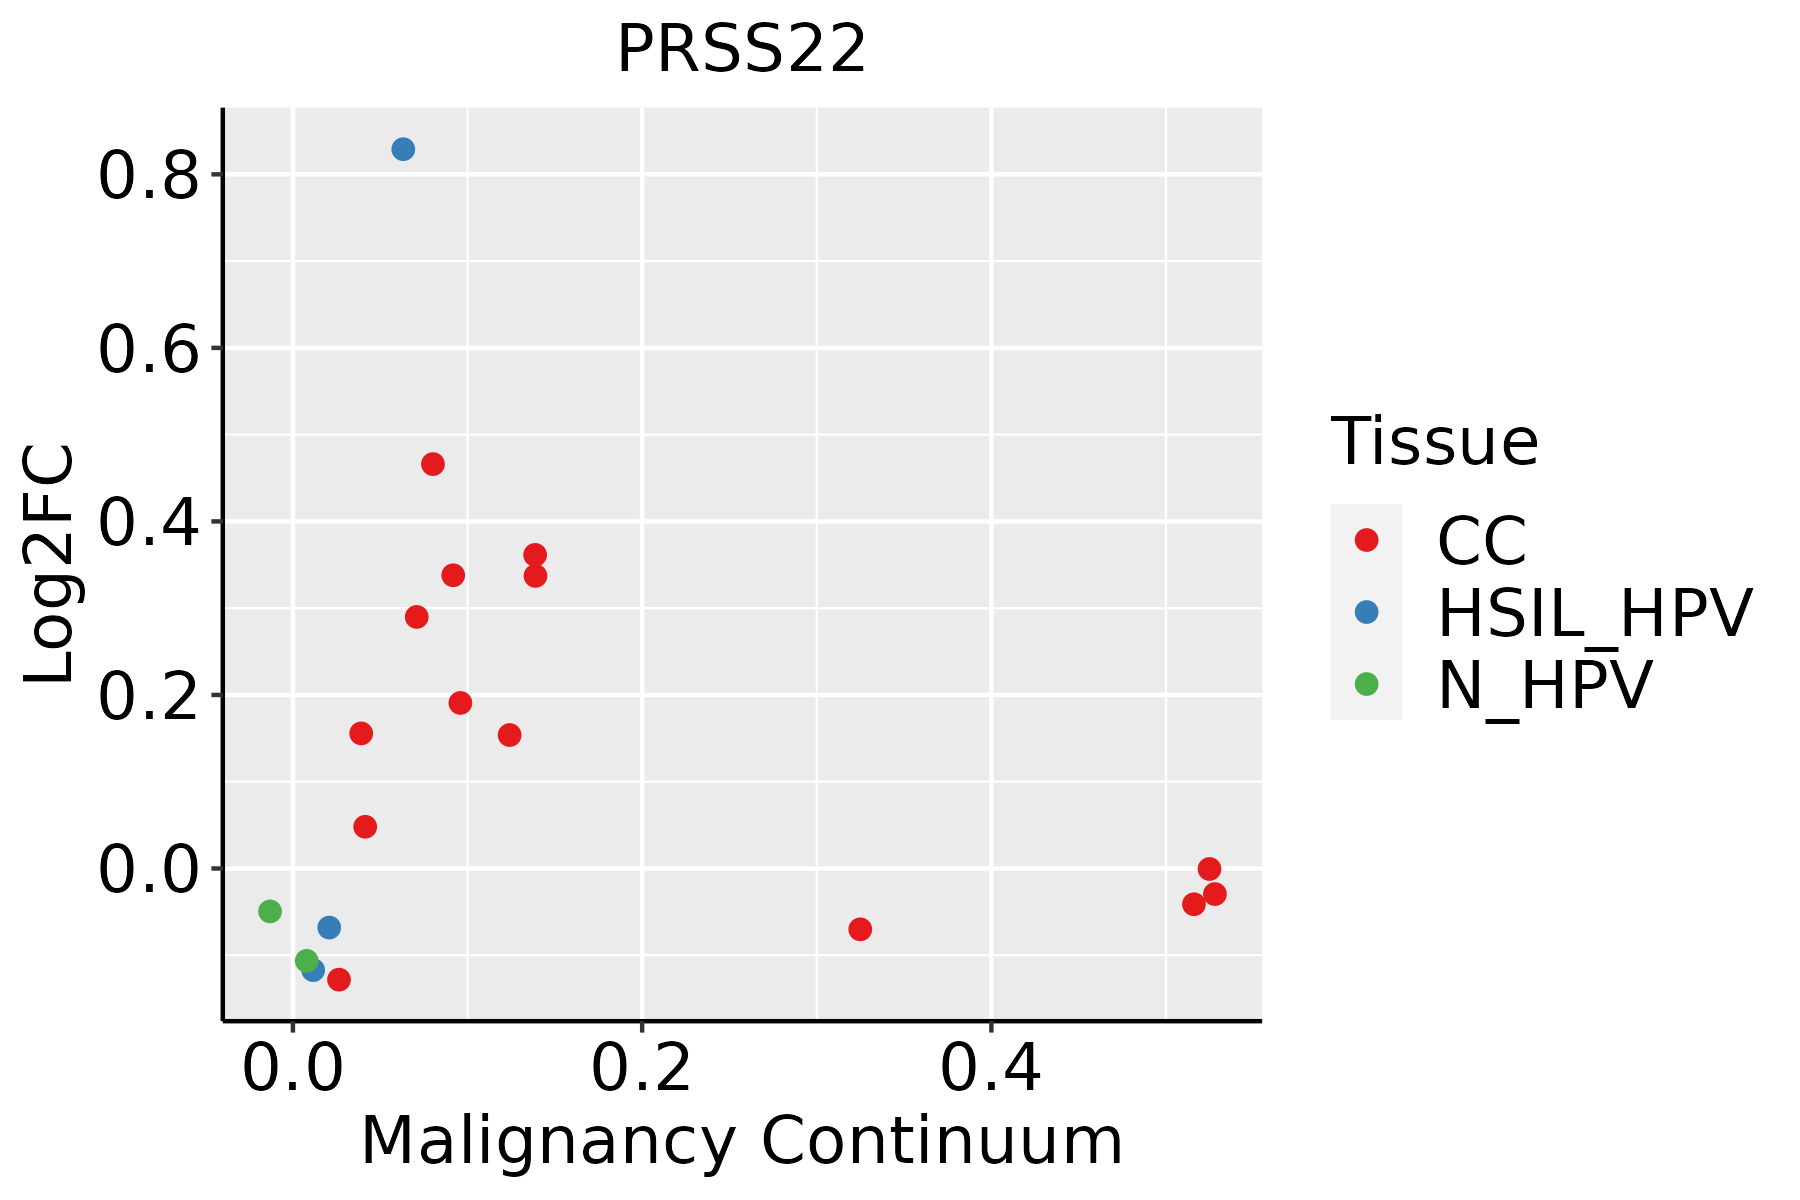 | CC: Cervix cancer |
| HSIL_HPV: HPV-infected high-grade squamous intraepithelial lesions | ||
| N_HPV: HPV-infected normal cervix | ||
| Colorectum (GSE201348) |  | FAP: Familial adenomatous polyposis |
| CRC: Colorectal cancer | ||
| Colorectum (HTA11) |  | AD: Adenomas |
| SER: Sessile serrated lesions | ||
| MSI-H: Microsatellite-high colorectal cancer | ||
| MSS: Microsatellite stable colorectal cancer | ||
| Esophagus | 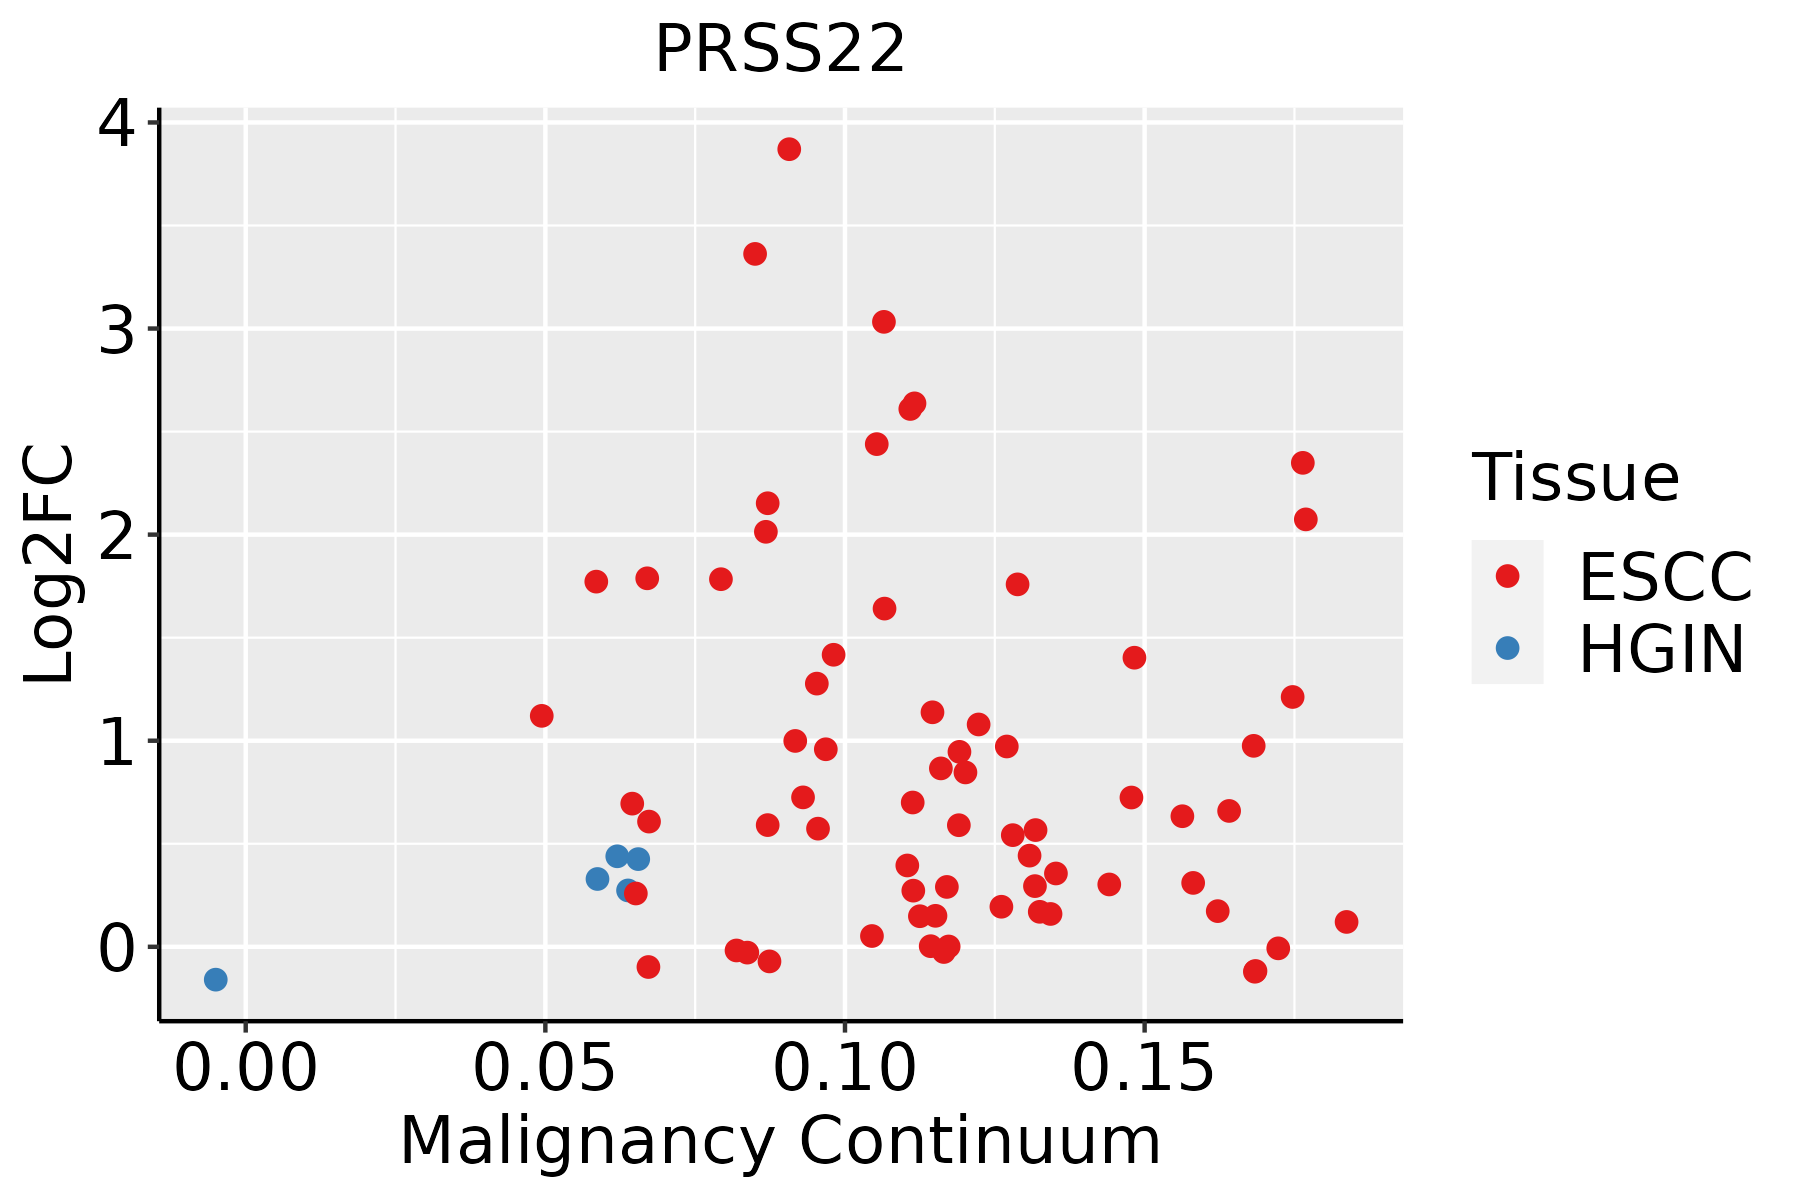 | ESCC: Esophageal squamous cell carcinoma |
| HGIN: High-grade intraepithelial neoplasias | ||
| LGIN: Low-grade intraepithelial neoplasias | ||
| Oral Cavity |  | EOLP: Erosive Oral lichen planus |
| LP: leukoplakia | ||
| NEOLP: Non-erosive oral lichen planus | ||
| OSCC: Oral squamous cell carcinoma | ||
| Prostate |  | BPH: Benign Prostatic Hyperplasia |
| Thyroid | 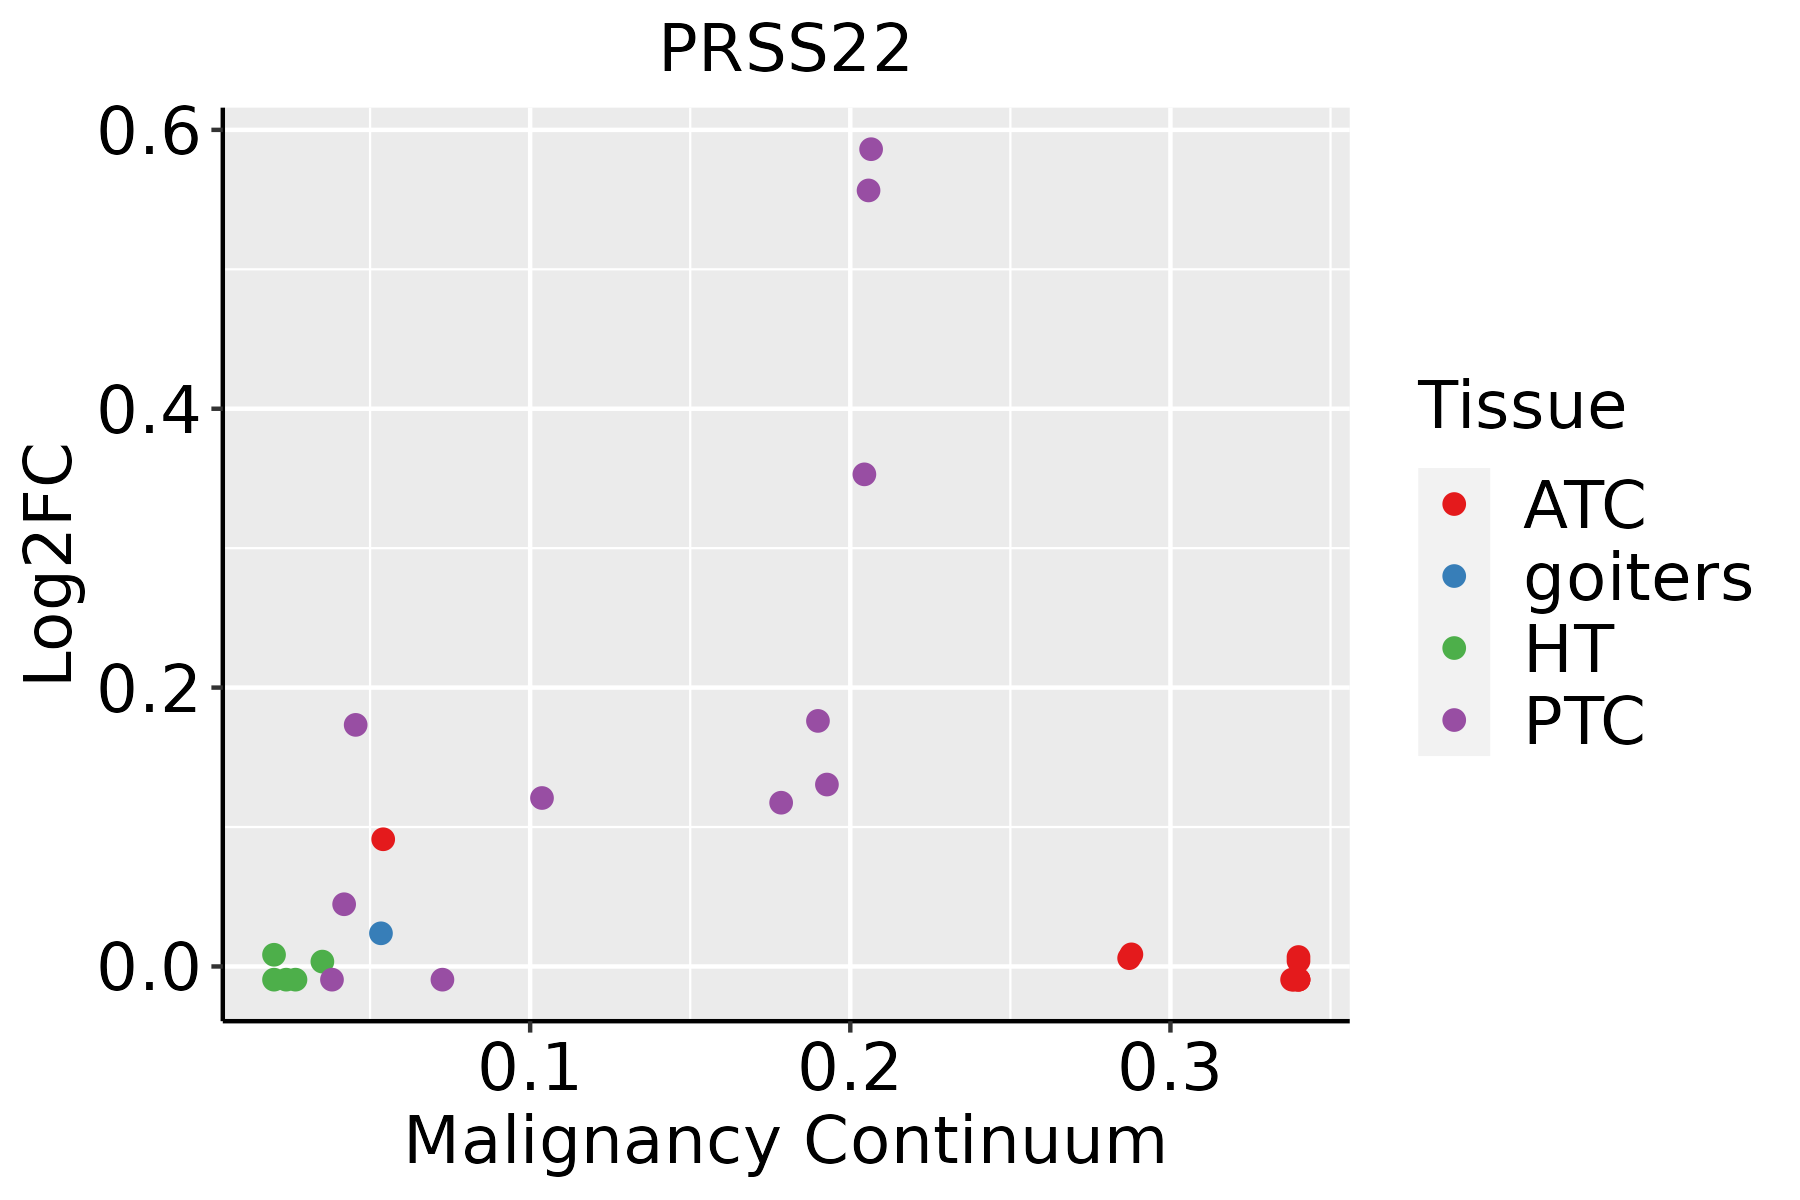 | ATC: Anaplastic thyroid cancer |
| HT: Hashimoto's thyroiditis | ||
| PTC: Papillary thyroid cancer |
| ∗log2FC in expression of this searched gene in stem-like cells from each diseased tissue sample relative to stem-like cells in normal samples in each tissue plotted against the malignancy continuum. Samples are colored based on if they are from different disease stage. |
Top |
Malignant transformation related pathway analysis |
| Find out the enriched GO biological processes and KEGG pathways involved in transition from healthy to precancer to cancer |
| Tissue | Disease Stage | Enriched GO biological Processes |
| Colorectum | AD |  |
| Colorectum | SER |  |
| Colorectum | MSS |  |
| Colorectum | MSI-H |  |
| Colorectum | FAP |  |
| ∗Top 15 enriched GO BP terms are showed in the bar plot of each disease state in each tissue. Each row represents a significant GO biological process which is colored according to the -log10(p.adjust). |
| Page: 1 2 3 4 5 6 7 8 9 |
| GO ID | Tissue | Disease Stage | Description | Gene Ratio | Bg Ratio | pvalue | p.adjust | Count |
| GO:005254710 | Cervix | CC | regulation of peptidase activity | 112/2311 | 461/18723 | 6.70e-13 | 3.08e-10 | 112 |
| GO:004586210 | Cervix | CC | positive regulation of proteolysis | 95/2311 | 372/18723 | 1.84e-12 | 6.86e-10 | 95 |
| GO:001095210 | Cervix | CC | positive regulation of peptidase activity | 54/2311 | 197/18723 | 8.06e-09 | 6.99e-07 | 54 |
| GO:005254715 | Cervix | HSIL_HPV | regulation of peptidase activity | 52/737 | 461/18723 | 8.35e-12 | 6.81e-09 | 52 |
| GO:001095215 | Cervix | HSIL_HPV | positive regulation of peptidase activity | 23/737 | 197/18723 | 3.25e-06 | 1.34e-04 | 23 |
| GO:004586215 | Cervix | HSIL_HPV | positive regulation of proteolysis | 33/737 | 372/18723 | 1.25e-05 | 4.05e-04 | 33 |
| GO:00458621 | Colorectum | SER | positive regulation of proteolysis | 106/2897 | 372/18723 | 8.40e-11 | 1.20e-08 | 106 |
| GO:00525471 | Colorectum | SER | regulation of peptidase activity | 114/2897 | 461/18723 | 1.18e-07 | 7.17e-06 | 114 |
| GO:00109521 | Colorectum | SER | positive regulation of peptidase activity | 55/2897 | 197/18723 | 5.44e-06 | 2.00e-04 | 55 |
| GO:00458622 | Colorectum | MSS | positive regulation of proteolysis | 119/3467 | 372/18723 | 2.14e-10 | 2.09e-08 | 119 |
| GO:00525472 | Colorectum | MSS | regulation of peptidase activity | 130/3467 | 461/18723 | 1.81e-07 | 8.13e-06 | 130 |
| GO:00109522 | Colorectum | MSS | positive regulation of peptidase activity | 63/3467 | 197/18723 | 3.65e-06 | 1.06e-04 | 63 |
| GO:0045862111 | Esophagus | ESCC | positive regulation of proteolysis | 256/8552 | 372/18723 | 7.88e-20 | 9.43e-18 | 256 |
| GO:0010952111 | Esophagus | ESCC | positive regulation of peptidase activity | 133/8552 | 197/18723 | 4.31e-10 | 1.14e-08 | 133 |
| GO:0052547111 | Esophagus | ESCC | regulation of peptidase activity | 275/8552 | 461/18723 | 7.54e-10 | 1.88e-08 | 275 |
| GO:004586220 | Oral cavity | OSCC | positive regulation of proteolysis | 236/7305 | 372/18723 | 6.53e-22 | 1.38e-19 | 236 |
| GO:005254720 | Oral cavity | OSCC | regulation of peptidase activity | 255/7305 | 461/18723 | 5.78e-13 | 2.75e-11 | 255 |
| GO:001095220 | Oral cavity | OSCC | positive regulation of peptidase activity | 123/7305 | 197/18723 | 2.12e-11 | 7.21e-10 | 123 |
| GO:0045862110 | Oral cavity | LP | positive regulation of proteolysis | 165/4623 | 372/18723 | 5.40e-17 | 8.46e-15 | 165 |
| GO:0052547110 | Oral cavity | LP | regulation of peptidase activity | 177/4623 | 461/18723 | 3.01e-11 | 2.00e-09 | 177 |
| Page: 1 2 |
| Pathway ID | Tissue | Disease Stage | Description | Gene Ratio | Bg Ratio | pvalue | p.adjust | qvalue | Count |
| Page: 1 |
Top |
Cell-cell communication analysis |
| Identification of potential cell-cell interactions between two cell types and their ligand-receptor pairs for different disease states |
| Ligand | Receptor | LRpair | Pathway | Tissue | Disease Stage |
| Page: 1 |
Top |
Single-cell gene regulatory network inference analysis |
| Find out the significant the regulons (TFs) and the target genes of each regulon across cell types for different disease states |
| TF | Cell Type | Tissue | Disease Stage | Target Gene | RSS | Regulon Activity |
| ∗The dot plots of a searched regulon are shown for all cell subpopulations in each disease state of each tissue based on the regulon specific score inferred using pySCENIC and by calculating the average expression. |
| Page: 1 |
Top |
Somatic mutation of malignant transformation related genes |
| Annotation of somatic variants for genes involved in malignant transformation |
| Hugo Symbol | Variant Class | Variant Classification | dbSNP RS | HGVSc | HGVSp | HGVSp Short | SWISSPROT | BIOTYPE | SIFT | PolyPhen | Tumor Sample Barcode | Tissue | Histology | Sex | Age | Stage | Therapy Types | Drugs | Outcome |
| PRSS22 | SNV | Missense_Mutation | c.700N>C | p.Glu234Gln | p.E234Q | Q9GZN4 | protein_coding | tolerated(0.27) | benign(0.023) | TCGA-AO-A0JD-01 | Breast | breast invasive carcinoma | Female | <65 | III/IV | Chemotherapy | cyclophosphamide | SD | |
| PRSS22 | SNV | Missense_Mutation | novel | c.214N>C | p.Thr72Pro | p.T72P | Q9GZN4 | protein_coding | deleterious(0.03) | possibly_damaging(0.8) | TCGA-BH-A208-01 | Breast | breast invasive carcinoma | Female | <65 | I/II | Unknown | Unknown | SD |
| PRSS22 | SNV | Missense_Mutation | novel | c.568C>A | p.Pro190Thr | p.P190T | Q9GZN4 | protein_coding | deleterious(0) | benign(0.272) | TCGA-2W-A8YY-01 | Cervix | cervical & endocervical cancer | Female | <65 | I/II | Chemotherapy | cisplatin | CR |
| PRSS22 | SNV | Missense_Mutation | novel | c.233C>T | p.Ser78Phe | p.S78F | Q9GZN4 | protein_coding | deleterious(0) | possibly_damaging(0.899) | TCGA-VS-A8Q8-01 | Cervix | cervical & endocervical cancer | Female | <65 | I/II | Unknown | Unknown | PD |
| PRSS22 | SNV | Missense_Mutation | c.685G>T | p.Gly229Cys | p.G229C | Q9GZN4 | protein_coding | deleterious(0) | probably_damaging(1) | TCGA-AA-3845-01 | Colorectum | colon adenocarcinoma | Female | >=65 | I/II | Unknown | Unknown | PD | |
| PRSS22 | SNV | Missense_Mutation | novel | c.669N>T | p.Glu223Asp | p.E223D | Q9GZN4 | protein_coding | tolerated(0.84) | possibly_damaging(0.535) | TCGA-AG-A002-01 | Colorectum | rectum adenocarcinoma | Male | <65 | I/II | Unknown | Unknown | SD |
| PRSS22 | SNV | Missense_Mutation | c.347N>A | p.Ser116Tyr | p.S116Y | Q9GZN4 | protein_coding | deleterious(0) | benign(0.382) | TCGA-A5-A0G2-01 | Endometrium | uterine corpus endometrioid carcinoma | Female | <65 | III/IV | Unknown | Unknown | SD | |
| PRSS22 | SNV | Missense_Mutation | rs374950071 | c.640C>T | p.Arg214Trp | p.R214W | Q9GZN4 | protein_coding | deleterious(0.03) | benign(0.013) | TCGA-AJ-A8CT-01 | Endometrium | uterine corpus endometrioid carcinoma | Female | <65 | I/II | Unknown | Unknown | SD |
| PRSS22 | SNV | Missense_Mutation | novel | c.703N>T | p.Arg235Trp | p.R235W | Q9GZN4 | protein_coding | deleterious(0) | probably_damaging(0.913) | TCGA-AP-A0LM-01 | Endometrium | uterine corpus endometrioid carcinoma | Female | <65 | III/IV | Chemotherapy | cisplatin | SD |
| PRSS22 | SNV | Missense_Mutation | novel | c.277N>G | p.Lys93Glu | p.K93E | Q9GZN4 | protein_coding | tolerated(0.16) | possibly_damaging(0.612) | TCGA-AX-A3G8-01 | Endometrium | uterine corpus endometrioid carcinoma | Female | >=65 | I/II | Unknown | Unknown | SD |
| Page: 1 2 3 |
Top |
Related drugs of malignant transformation related genes |
| Identification of chemicals and drugs interact with genes involved in malignant transfromation |
| (DGIdb 4.0) |
| Entrez ID | Symbol | Category | Interaction Types | Drug Claim Name | Drug Name | PMIDs |
| Page: 1 |

Copyright 2023-Present -The University of Texas Health Science Center at Houston |