
|
|||||
|
 | |
| |
| |
| |
| |
| |
|
Gene: PRSS21 |
Gene summary for PRSS21 |
| Gene information | Species | Human | Gene symbol | PRSS21 | Gene ID | 10942 |
| Gene name | serine protease 21 | |
| Gene Alias | ESP-1 | |
| Cytomap | 16p13.3 | |
| Gene Type | protein-coding | GO ID | GO:0000003 | UniProtAcc | Q9Y6M0 |
Top |
Malignant transformation analysis |
| Identification of the aberrant gene expression in precancerous and cancerous lesions by comparing the gene expression of stem-like cells in diseased tissues with normal stem cells |
| Entrez ID | Symbol | Replicates | Species | Organ | Tissue | Adj P-value | Log2FC | Malignancy |
| 10942 | PRSS21 | GSM4909281 | Human | Breast | IDC | 3.22e-36 | 6.80e-01 | 0.21 |
| 10942 | PRSS21 | GSM4909286 | Human | Breast | IDC | 1.01e-35 | 5.25e-01 | 0.1081 |
| 10942 | PRSS21 | DCIS2 | Human | Breast | DCIS | 1.81e-02 | 3.40e-02 | 0.0085 |
| 10942 | PRSS21 | LZE2T | Human | Esophagus | ESCC | 1.79e-08 | 1.19e+00 | 0.082 |
| 10942 | PRSS21 | LZE4T | Human | Esophagus | ESCC | 8.19e-11 | 2.98e-01 | 0.0811 |
| 10942 | PRSS21 | LZE8T | Human | Esophagus | ESCC | 2.93e-31 | 1.13e+00 | 0.067 |
| 10942 | PRSS21 | LZE22T | Human | Esophagus | ESCC | 1.01e-06 | 5.10e-01 | 0.068 |
| 10942 | PRSS21 | LZE21T | Human | Esophagus | ESCC | 4.66e-02 | 3.37e-01 | 0.0655 |
| 10942 | PRSS21 | P2T-E | Human | Esophagus | ESCC | 2.01e-101 | 1.89e+00 | 0.1177 |
| 10942 | PRSS21 | P4T-E | Human | Esophagus | ESCC | 4.15e-63 | 1.91e+00 | 0.1323 |
| 10942 | PRSS21 | P5T-E | Human | Esophagus | ESCC | 1.94e-36 | 9.13e-01 | 0.1327 |
| 10942 | PRSS21 | P8T-E | Human | Esophagus | ESCC | 1.22e-60 | 1.30e+00 | 0.0889 |
| 10942 | PRSS21 | P9T-E | Human | Esophagus | ESCC | 7.86e-10 | 2.74e-01 | 0.1131 |
| 10942 | PRSS21 | P10T-E | Human | Esophagus | ESCC | 1.33e-13 | 2.88e-01 | 0.116 |
| 10942 | PRSS21 | P12T-E | Human | Esophagus | ESCC | 2.02e-54 | 1.30e+00 | 0.1122 |
| 10942 | PRSS21 | P15T-E | Human | Esophagus | ESCC | 2.00e-68 | 1.79e+00 | 0.1149 |
| 10942 | PRSS21 | P16T-E | Human | Esophagus | ESCC | 1.45e-65 | 1.54e+00 | 0.1153 |
| 10942 | PRSS21 | P19T-E | Human | Esophagus | ESCC | 1.28e-09 | 1.24e+00 | 0.1662 |
| 10942 | PRSS21 | P21T-E | Human | Esophagus | ESCC | 2.48e-18 | 4.53e-01 | 0.1617 |
| 10942 | PRSS21 | P22T-E | Human | Esophagus | ESCC | 1.77e-44 | 1.00e+00 | 0.1236 |
| Page: 1 2 3 4 |
| Tissue | Expression Dynamics | Abbreviation |
| Breast | 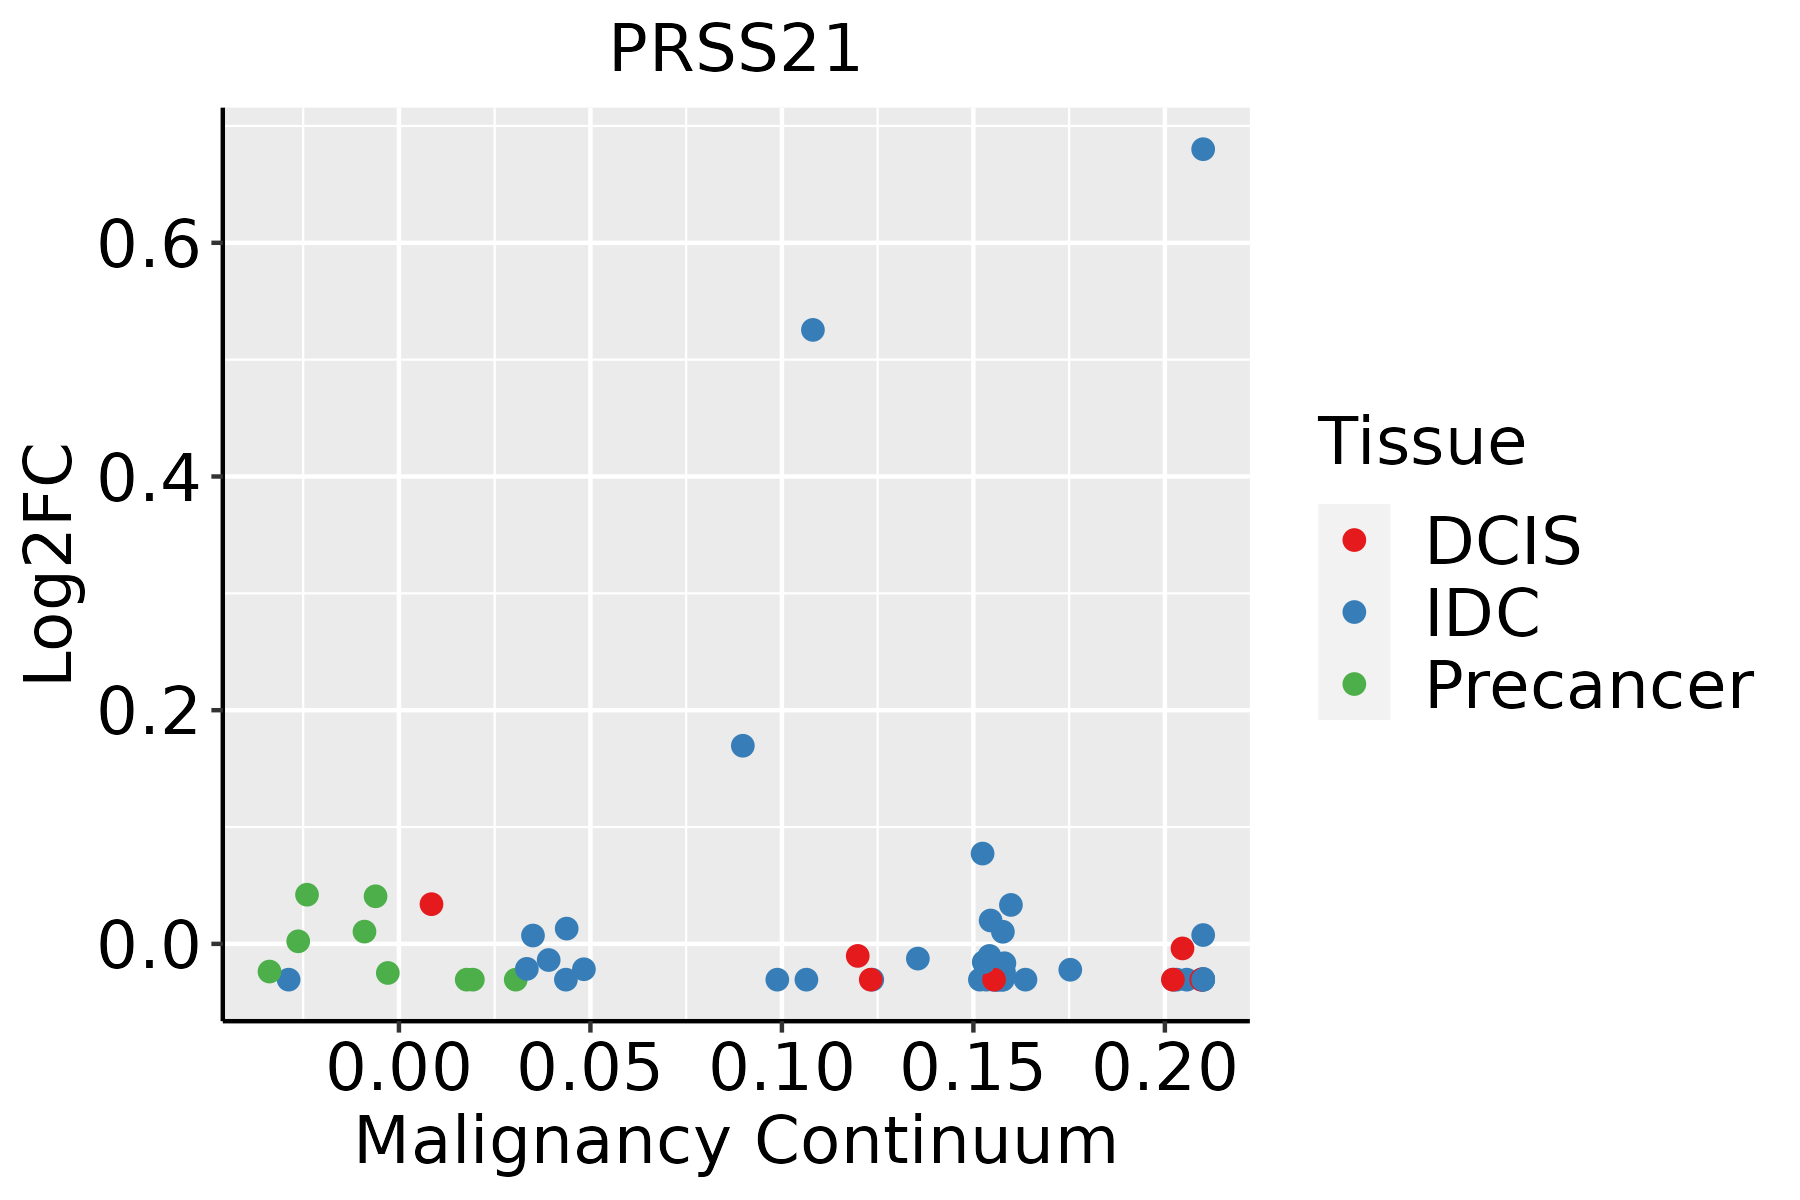 | IDC: Invasive ductal carcinoma |
| DCIS: Ductal carcinoma in situ | ||
| Precancer(BRCA1-mut): Precancerous lesion from BRCA1 mutation carriers | ||
| Esophagus | 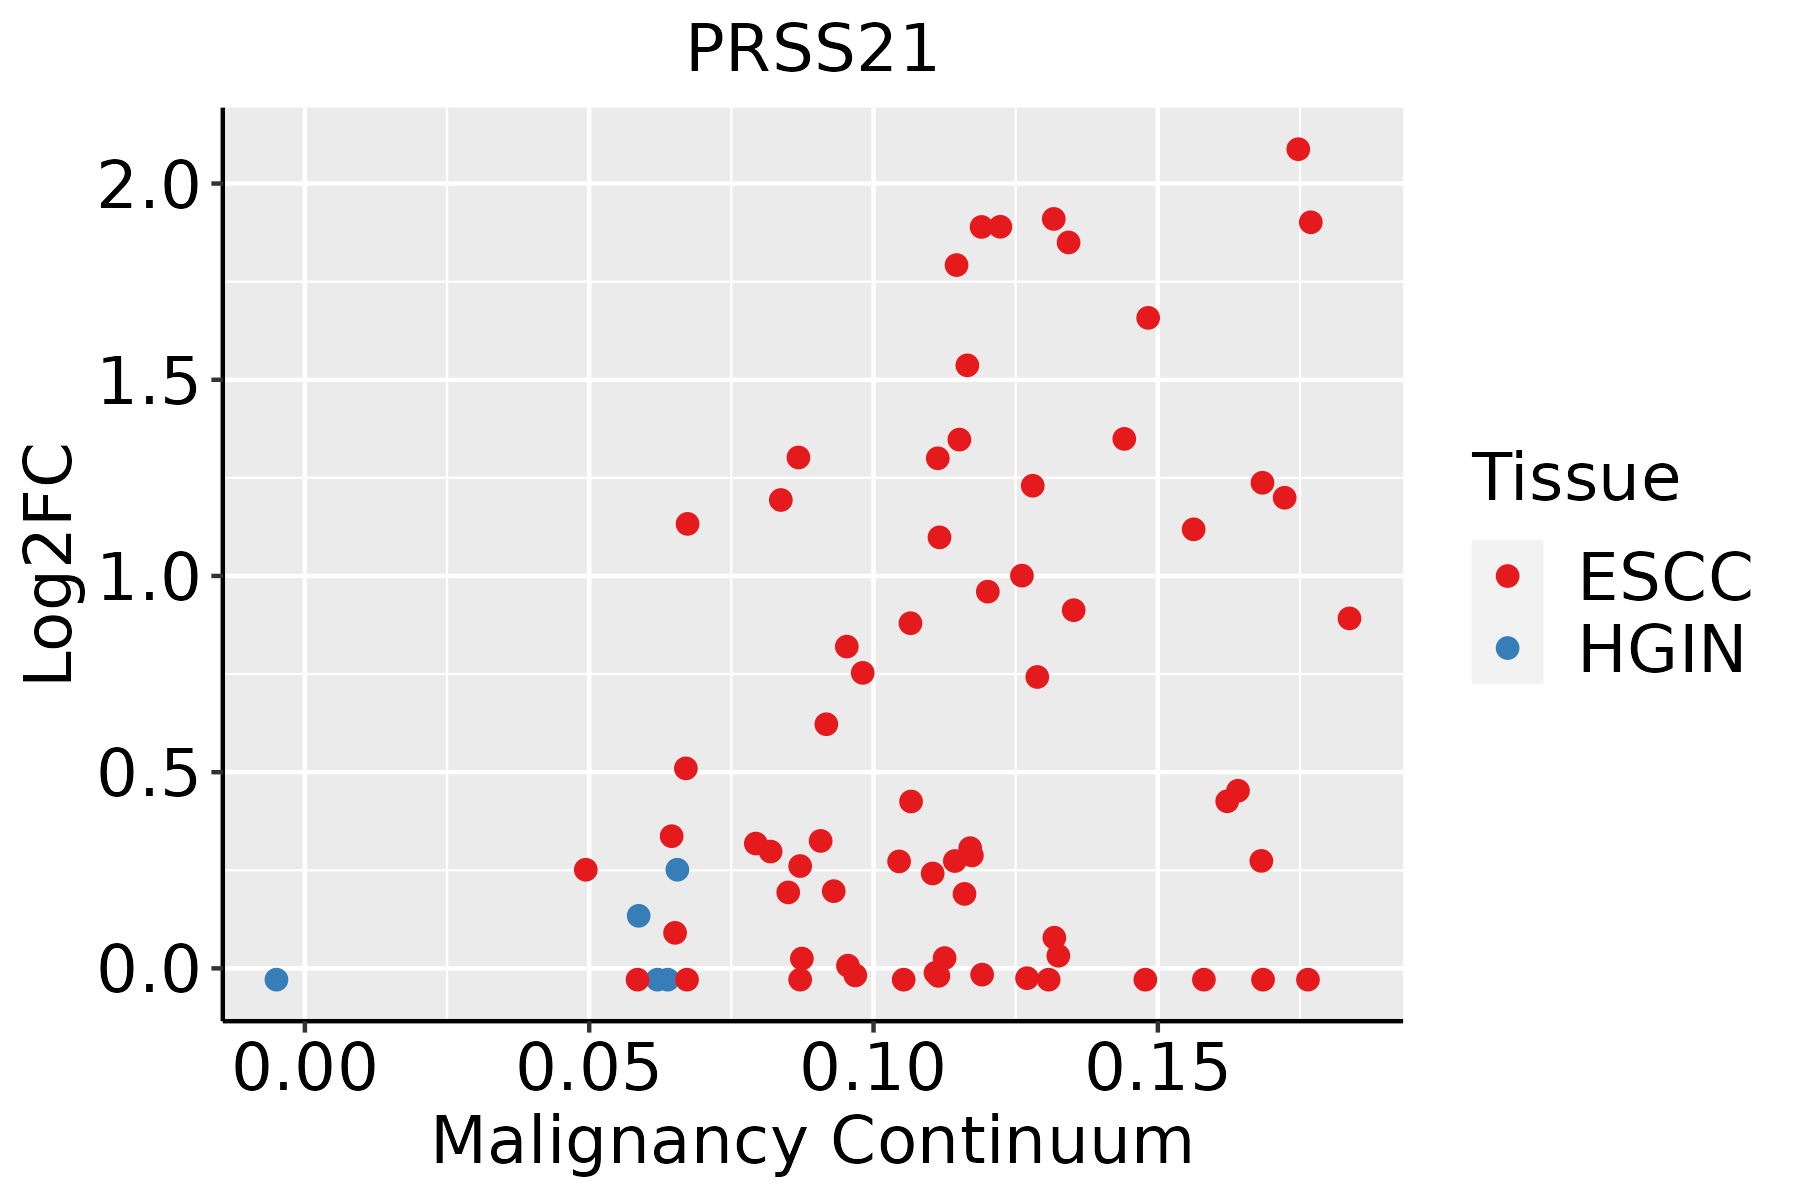 | ESCC: Esophageal squamous cell carcinoma |
| HGIN: High-grade intraepithelial neoplasias | ||
| LGIN: Low-grade intraepithelial neoplasias | ||
| Liver | 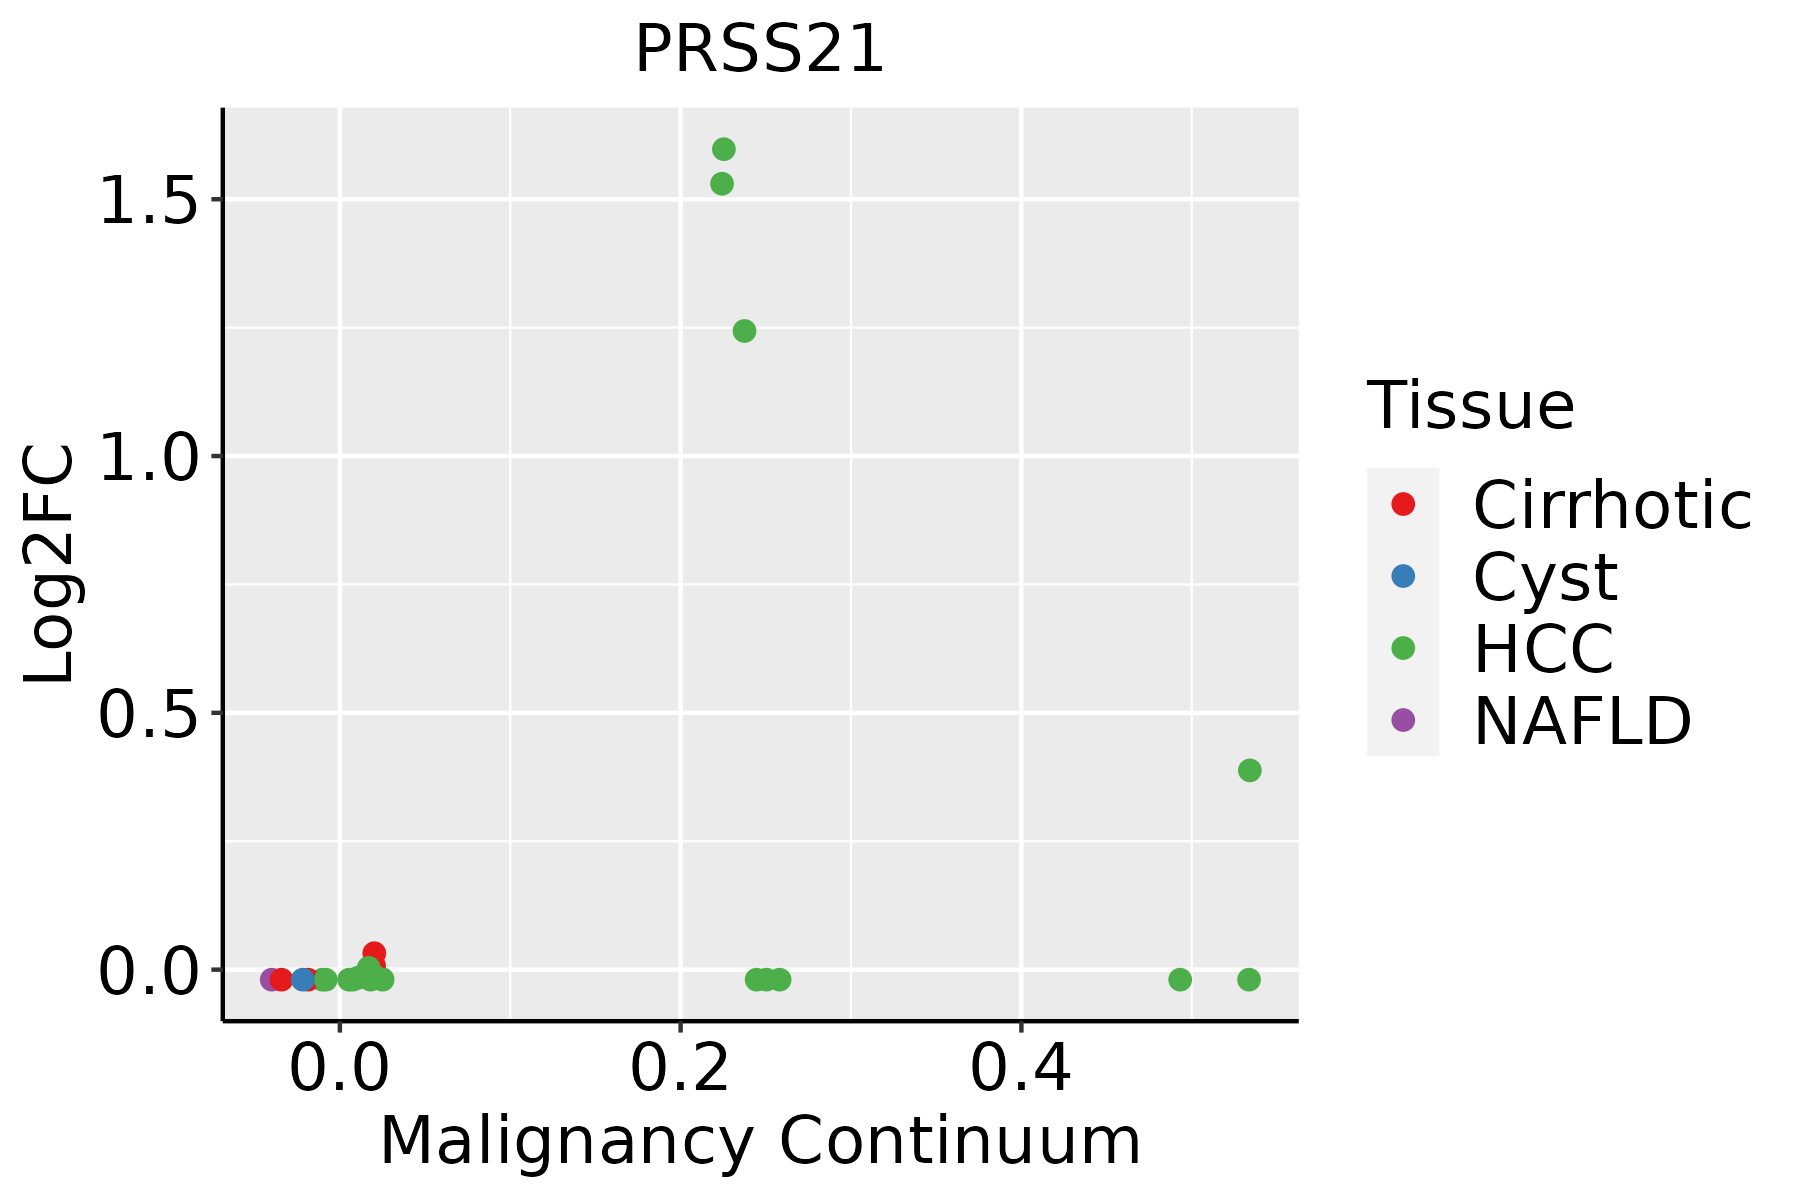 | HCC: Hepatocellular carcinoma |
| NAFLD: Non-alcoholic fatty liver disease | ||
| Oral Cavity | 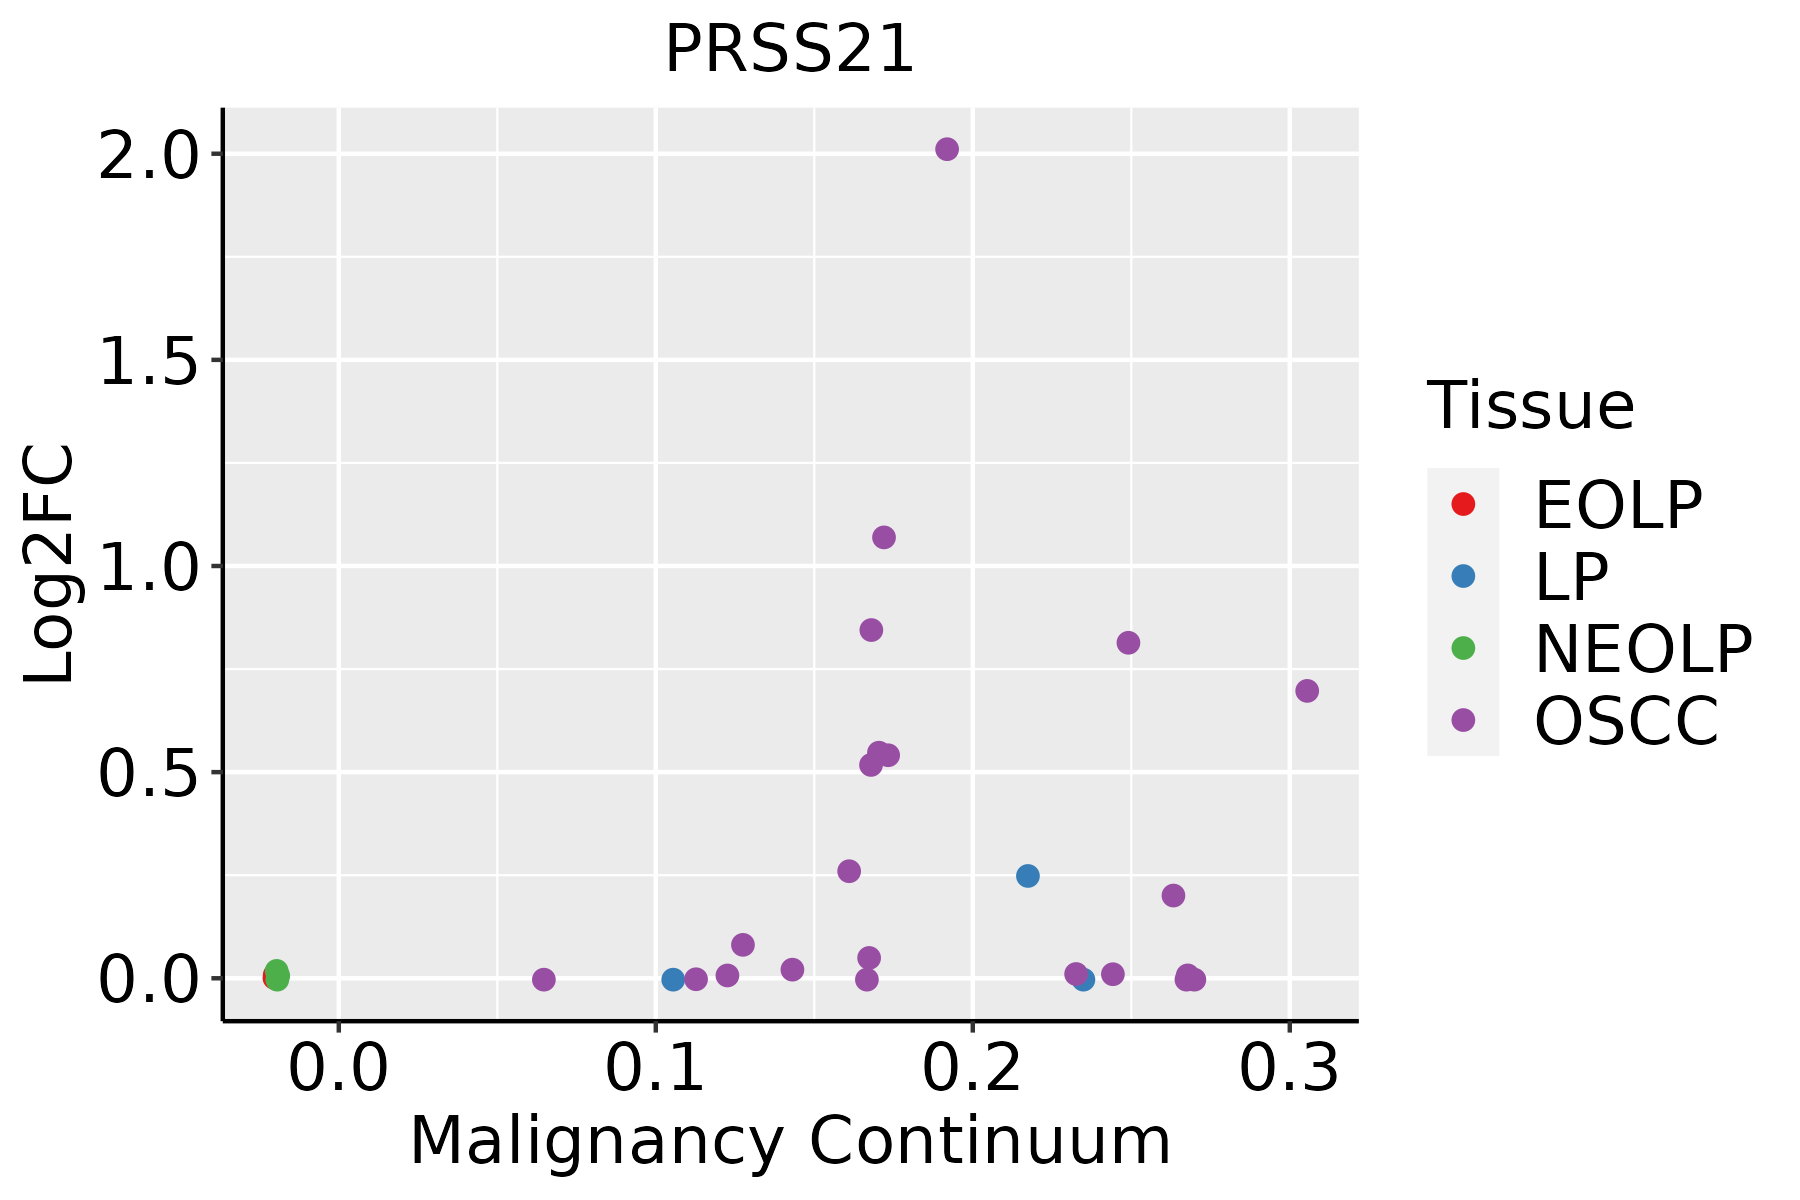 | EOLP: Erosive Oral lichen planus |
| LP: leukoplakia | ||
| NEOLP: Non-erosive oral lichen planus | ||
| OSCC: Oral squamous cell carcinoma | ||
| Prostate |  | BPH: Benign Prostatic Hyperplasia |
| ∗log2FC in expression of this searched gene in stem-like cells from each diseased tissue sample relative to stem-like cells in normal samples in each tissue plotted against the malignancy continuum. Samples are colored based on if they are from different disease stage. |
Top |
Malignant transformation related pathway analysis |
| Find out the enriched GO biological processes and KEGG pathways involved in transition from healthy to precancer to cancer |
| Tissue | Disease Stage | Enriched GO biological Processes |
| Colorectum | AD |  |
| Colorectum | SER |  |
| Colorectum | MSS |  |
| Colorectum | MSI-H |  |
| Colorectum | FAP |  |
| ∗Top 15 enriched GO BP terms are showed in the bar plot of each disease state in each tissue. Each row represents a significant GO biological process which is colored according to the -log10(p.adjust). |
| Page: 1 2 3 4 5 6 7 8 9 |
| GO ID | Tissue | Disease Stage | Description | Gene Ratio | Bg Ratio | pvalue | p.adjust | Count |
| Page: 1 |
| Pathway ID | Tissue | Disease Stage | Description | Gene Ratio | Bg Ratio | pvalue | p.adjust | qvalue | Count |
| Page: 1 |
Top |
Cell-cell communication analysis |
| Identification of potential cell-cell interactions between two cell types and their ligand-receptor pairs for different disease states |
| Ligand | Receptor | LRpair | Pathway | Tissue | Disease Stage |
| Page: 1 |
Top |
Single-cell gene regulatory network inference analysis |
| Find out the significant the regulons (TFs) and the target genes of each regulon across cell types for different disease states |
| TF | Cell Type | Tissue | Disease Stage | Target Gene | RSS | Regulon Activity |
| ∗The dot plots of a searched regulon are shown for all cell subpopulations in each disease state of each tissue based on the regulon specific score inferred using pySCENIC and by calculating the average expression. |
| Page: 1 |
Top |
Somatic mutation of malignant transformation related genes |
| Annotation of somatic variants for genes involved in malignant transformation |
| Hugo Symbol | Variant Class | Variant Classification | dbSNP RS | HGVSc | HGVSp | HGVSp Short | SWISSPROT | BIOTYPE | SIFT | PolyPhen | Tumor Sample Barcode | Tissue | Histology | Sex | Age | Stage | Therapy Types | Drugs | Outcome |
| PRSS21 | SNV | Missense_Mutation | c.547N>A | p.Glu183Lys | p.E183K | Q9Y6M0 | protein_coding | tolerated(1) | benign(0.013) | TCGA-AC-A23H-01 | Breast | breast invasive carcinoma | Female | >=65 | I/II | Unknown | Unknown | PD | |
| PRSS21 | SNV | Missense_Mutation | rs758627036 | c.938C>A | p.Pro313Gln | p.P313Q | Q9Y6M0 | protein_coding | deleterious_low_confidence(0) | benign(0.099) | TCGA-D8-A1XQ-01 | Breast | breast invasive carcinoma | Female | >=65 | I/II | Unknown | Unknown | SD |
| PRSS21 | SNV | Missense_Mutation | rs771479192 | c.731N>A | p.Cys244Tyr | p.C244Y | Q9Y6M0 | protein_coding | deleterious(0) | probably_damaging(1) | TCGA-A6-5661-01 | Colorectum | colon adenocarcinoma | Female | >=65 | I/II | Unknown | Unknown | SD |
| PRSS21 | SNV | Missense_Mutation | c.908C>T | p.Pro303Leu | p.P303L | Q9Y6M0 | protein_coding | tolerated(0.09) | benign(0) | TCGA-A6-6140-01 | Colorectum | colon adenocarcinoma | Male | <65 | I/II | Chemotherapy | oxaliplatin | SD | |
| PRSS21 | SNV | Missense_Mutation | c.523G>T | p.Gly175Cys | p.G175C | Q9Y6M0 | protein_coding | deleterious(0) | probably_damaging(1) | TCGA-AA-3947-01 | Colorectum | colon adenocarcinoma | Female | <65 | I/II | Unknown | Unknown | SD | |
| PRSS21 | SNV | Missense_Mutation | rs758722702 | c.385N>T | p.Arg129Cys | p.R129C | Q9Y6M0 | protein_coding | tolerated(0.09) | possibly_damaging(0.862) | TCGA-AZ-4313-01 | Colorectum | colon adenocarcinoma | Female | <65 | I/II | Unknown | Unknown | SD |
| PRSS21 | SNV | Missense_Mutation | c.151N>A | p.Gly51Arg | p.G51R | Q9Y6M0 | protein_coding | deleterious(0.02) | probably_damaging(0.988) | TCGA-D5-6540-01 | Colorectum | colon adenocarcinoma | Male | >=65 | I/II | Unknown | Unknown | SD | |
| PRSS21 | SNV | Missense_Mutation | novel | c.571N>A | p.Leu191Ile | p.L191I | Q9Y6M0 | protein_coding | deleterious(0) | probably_damaging(0.989) | TCGA-A5-A0G1-01 | Endometrium | uterine corpus endometrioid carcinoma | Female | >=65 | I/II | Unknown | Unknown | SD |
| PRSS21 | SNV | Missense_Mutation | rs766212468 | c.766N>A | p.Val256Met | p.V256M | Q9Y6M0 | protein_coding | deleterious(0) | probably_damaging(1) | TCGA-AP-A059-01 | Endometrium | uterine corpus endometrioid carcinoma | Female | >=65 | I/II | Unknown | Unknown | SD |
| PRSS21 | SNV | Missense_Mutation | c.332N>A | p.Ser111Asn | p.S111N | Q9Y6M0 | protein_coding | tolerated(1) | benign(0.007) | TCGA-AP-A0LM-01 | Endometrium | uterine corpus endometrioid carcinoma | Female | <65 | III/IV | Chemotherapy | cisplatin | SD |
| Page: 1 2 3 |
Top |
Related drugs of malignant transformation related genes |
| Identification of chemicals and drugs interact with genes involved in malignant transfromation |
| (DGIdb 4.0) |
| Entrez ID | Symbol | Category | Interaction Types | Drug Claim Name | Drug Name | PMIDs |
| Page: 1 |

Copyright 2023-Present -The University of Texas Health Science Center at Houston |