
|
|||||
|
 | |
| |
| |
| |
| |
| |
|
Gene: PRSS16 |
Gene summary for PRSS16 |
| Gene information | Species | Human | Gene symbol | PRSS16 | Gene ID | 10279 |
| Gene name | serine protease 16 | |
| Gene Alias | TSSP | |
| Cytomap | 6p22.1 | |
| Gene Type | protein-coding | GO ID | GO:0006508 | UniProtAcc | Q9NQE7 |
Top |
Malignant transformation analysis |
| Identification of the aberrant gene expression in precancerous and cancerous lesions by comparing the gene expression of stem-like cells in diseased tissues with normal stem cells |
| Entrez ID | Symbol | Replicates | Species | Organ | Tissue | Adj P-value | Log2FC | Malignancy |
| 10279 | PRSS16 | LZE7T | Human | Esophagus | ESCC | 2.71e-03 | 2.06e-01 | 0.0667 |
| 10279 | PRSS16 | LZE22T | Human | Esophagus | ESCC | 5.36e-03 | 2.19e-01 | 0.068 |
| 10279 | PRSS16 | LZE24T | Human | Esophagus | ESCC | 4.12e-06 | 8.16e-02 | 0.0596 |
| 10279 | PRSS16 | P1T-E | Human | Esophagus | ESCC | 1.76e-06 | 3.21e-01 | 0.0875 |
| 10279 | PRSS16 | P2T-E | Human | Esophagus | ESCC | 7.09e-11 | 2.36e-01 | 0.1177 |
| 10279 | PRSS16 | P4T-E | Human | Esophagus | ESCC | 1.64e-06 | 1.61e-01 | 0.1323 |
| 10279 | PRSS16 | P5T-E | Human | Esophagus | ESCC | 3.63e-03 | 2.59e-02 | 0.1327 |
| 10279 | PRSS16 | P8T-E | Human | Esophagus | ESCC | 3.06e-05 | 1.59e-01 | 0.0889 |
| 10279 | PRSS16 | P9T-E | Human | Esophagus | ESCC | 1.76e-02 | 1.08e-01 | 0.1131 |
| 10279 | PRSS16 | P10T-E | Human | Esophagus | ESCC | 1.07e-07 | 1.31e-01 | 0.116 |
| 10279 | PRSS16 | P11T-E | Human | Esophagus | ESCC | 1.63e-03 | 1.76e-01 | 0.1426 |
| 10279 | PRSS16 | P12T-E | Human | Esophagus | ESCC | 1.02e-08 | 9.73e-02 | 0.1122 |
| 10279 | PRSS16 | P15T-E | Human | Esophagus | ESCC | 1.91e-05 | 5.60e-02 | 0.1149 |
| 10279 | PRSS16 | P16T-E | Human | Esophagus | ESCC | 1.42e-08 | 1.17e-01 | 0.1153 |
| 10279 | PRSS16 | P17T-E | Human | Esophagus | ESCC | 1.57e-08 | 3.82e-01 | 0.1278 |
| 10279 | PRSS16 | P21T-E | Human | Esophagus | ESCC | 1.19e-05 | 1.39e-01 | 0.1617 |
| 10279 | PRSS16 | P22T-E | Human | Esophagus | ESCC | 1.33e-17 | 3.11e-01 | 0.1236 |
| 10279 | PRSS16 | P23T-E | Human | Esophagus | ESCC | 1.66e-09 | 1.39e-01 | 0.108 |
| 10279 | PRSS16 | P24T-E | Human | Esophagus | ESCC | 1.24e-07 | 1.05e-01 | 0.1287 |
| 10279 | PRSS16 | P26T-E | Human | Esophagus | ESCC | 2.45e-09 | 8.13e-02 | 0.1276 |
| Page: 1 2 3 4 |
| Tissue | Expression Dynamics | Abbreviation |
| Esophagus | 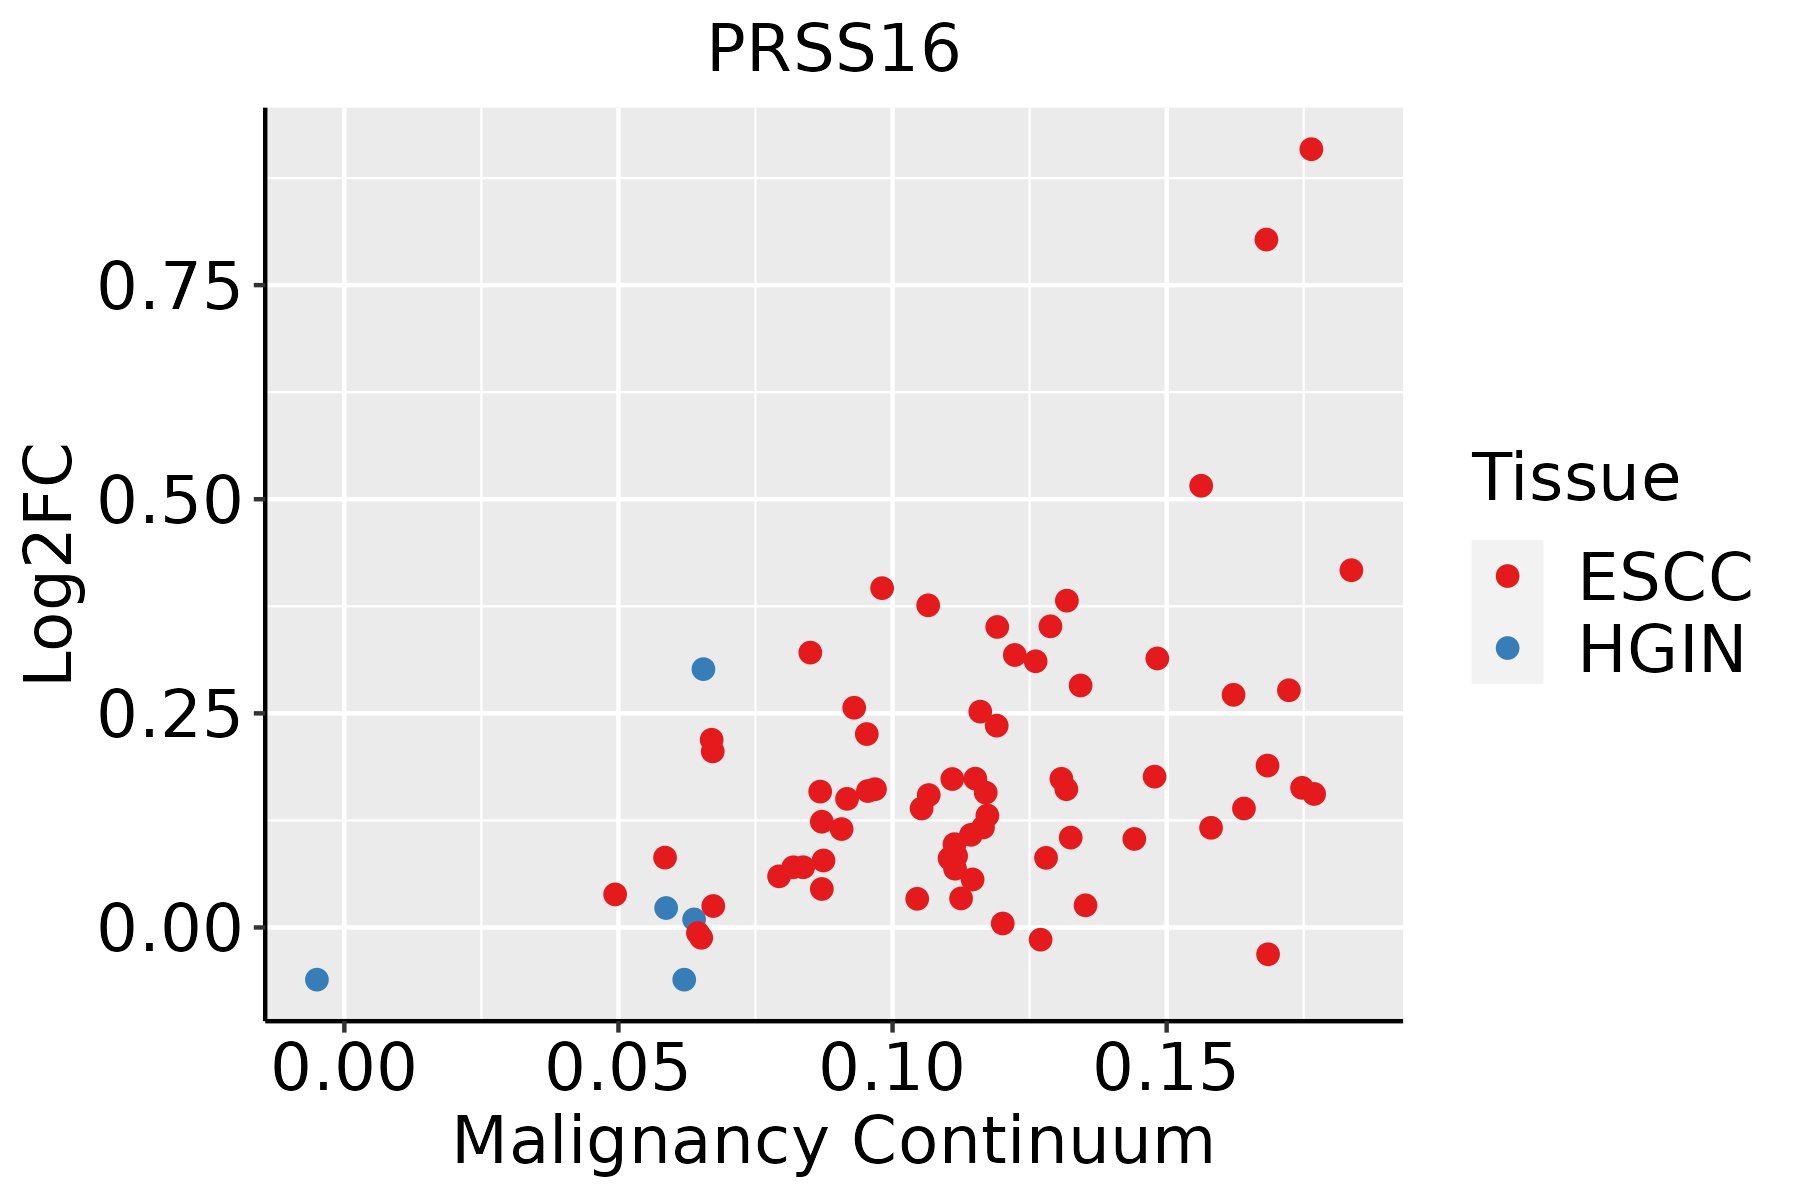 | ESCC: Esophageal squamous cell carcinoma |
| HGIN: High-grade intraepithelial neoplasias | ||
| LGIN: Low-grade intraepithelial neoplasias | ||
| Oral Cavity | 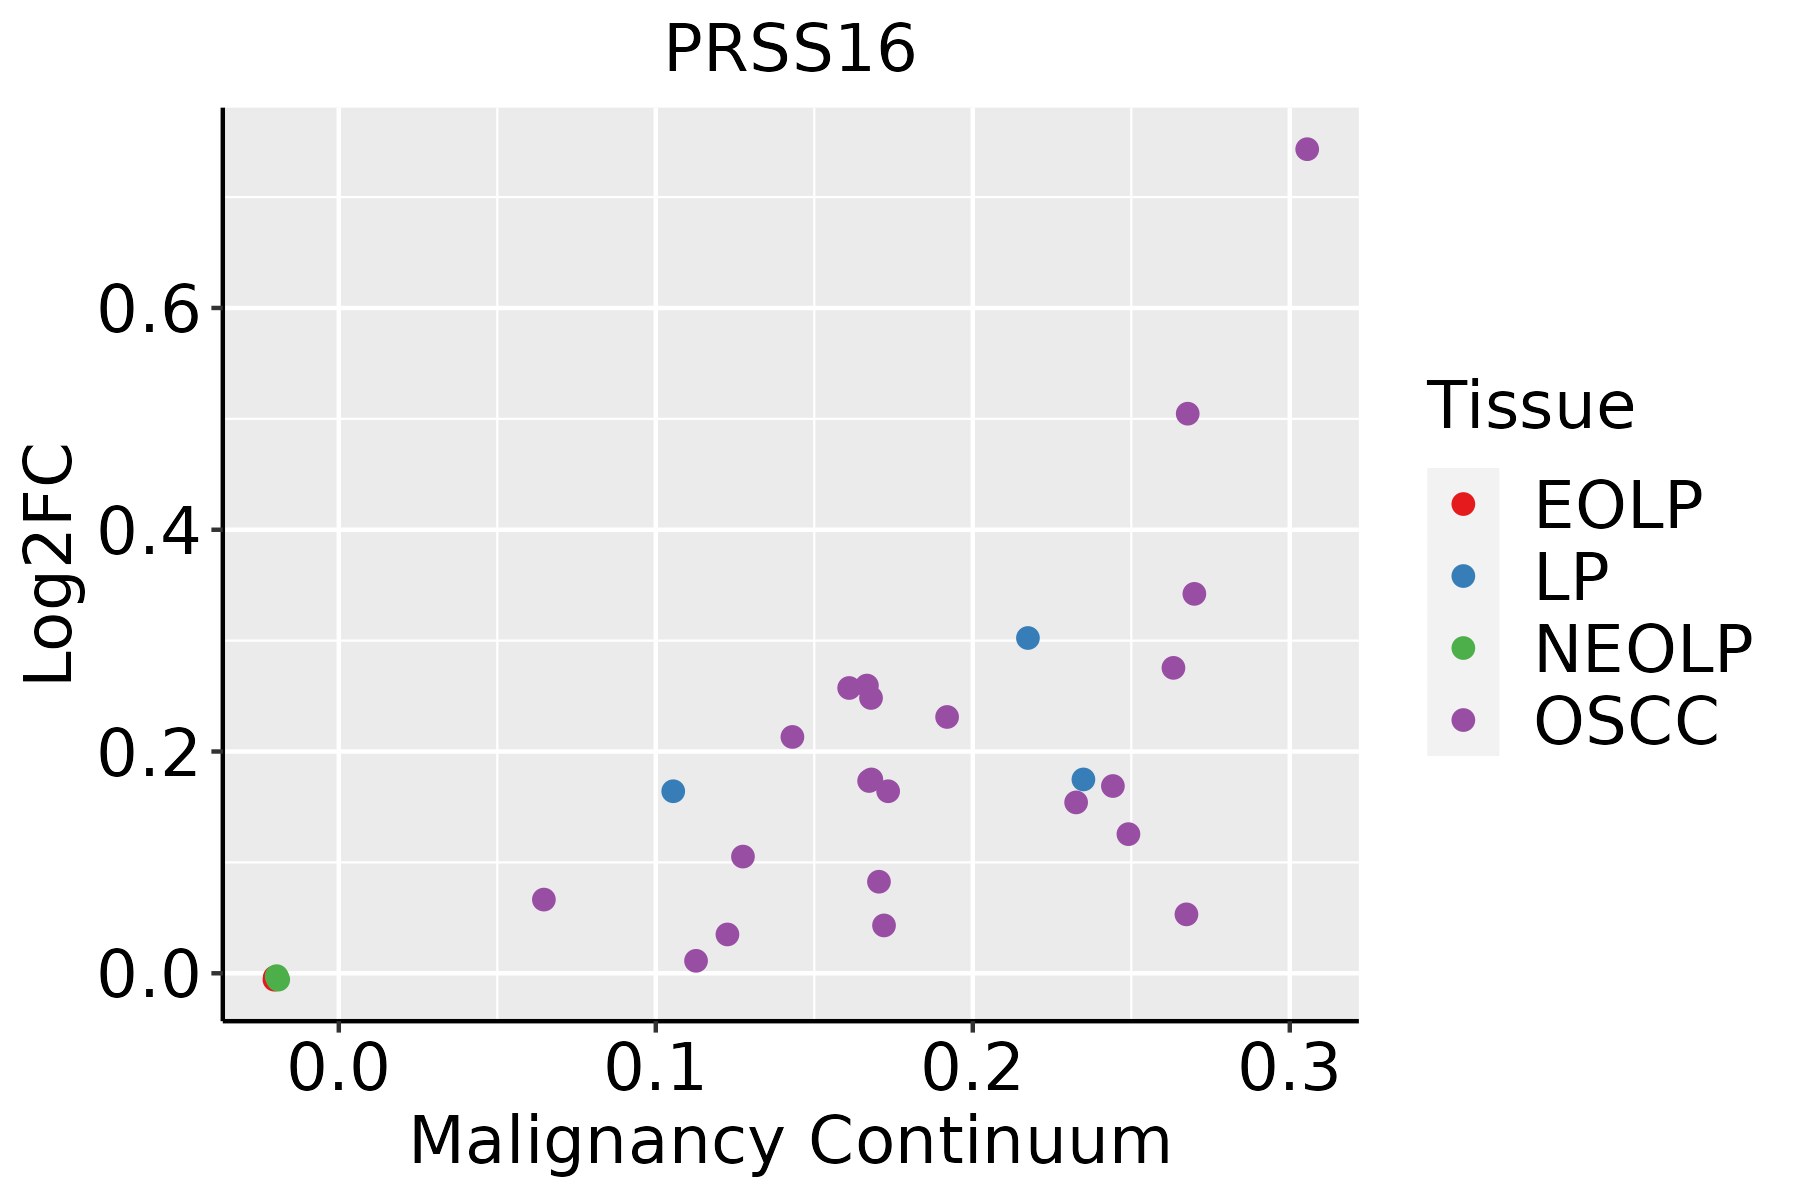 | EOLP: Erosive Oral lichen planus |
| LP: leukoplakia | ||
| NEOLP: Non-erosive oral lichen planus | ||
| OSCC: Oral squamous cell carcinoma |
| ∗log2FC in expression of this searched gene in stem-like cells from each diseased tissue sample relative to stem-like cells in normal samples in each tissue plotted against the malignancy continuum. Samples are colored based on if they are from different disease stage. |
Top |
Malignant transformation related pathway analysis |
| Find out the enriched GO biological processes and KEGG pathways involved in transition from healthy to precancer to cancer |
| Tissue | Disease Stage | Enriched GO biological Processes |
| Colorectum | AD |  |
| Colorectum | SER |  |
| Colorectum | MSS |  |
| Colorectum | MSI-H |  |
| Colorectum | FAP |  |
| ∗Top 15 enriched GO BP terms are showed in the bar plot of each disease state in each tissue. Each row represents a significant GO biological process which is colored according to the -log10(p.adjust). |
| Page: 1 2 3 4 5 6 7 8 9 |
| GO ID | Tissue | Disease Stage | Description | Gene Ratio | Bg Ratio | pvalue | p.adjust | Count |
| Page: 1 |
| Pathway ID | Tissue | Disease Stage | Description | Gene Ratio | Bg Ratio | pvalue | p.adjust | qvalue | Count |
| Page: 1 |
Top |
Cell-cell communication analysis |
| Identification of potential cell-cell interactions between two cell types and their ligand-receptor pairs for different disease states |
| Ligand | Receptor | LRpair | Pathway | Tissue | Disease Stage |
| Page: 1 |
Top |
Single-cell gene regulatory network inference analysis |
| Find out the significant the regulons (TFs) and the target genes of each regulon across cell types for different disease states |
| TF | Cell Type | Tissue | Disease Stage | Target Gene | RSS | Regulon Activity |
| ∗The dot plots of a searched regulon are shown for all cell subpopulations in each disease state of each tissue based on the regulon specific score inferred using pySCENIC and by calculating the average expression. |
| Page: 1 |
Top |
Somatic mutation of malignant transformation related genes |
| Annotation of somatic variants for genes involved in malignant transformation |
| Hugo Symbol | Variant Class | Variant Classification | dbSNP RS | HGVSc | HGVSp | HGVSp Short | SWISSPROT | BIOTYPE | SIFT | PolyPhen | Tumor Sample Barcode | Tissue | Histology | Sex | Age | Stage | Therapy Types | Drugs | Outcome |
| PRSS16 | SNV | Missense_Mutation | novel | c.1379C>A | p.Ser460Tyr | p.S460Y | Q9NQE7 | protein_coding | deleterious(0.01) | benign(0.055) | TCGA-AN-A046-01 | Breast | breast invasive carcinoma | Female | >=65 | I/II | Unknown | Unknown | SD |
| PRSS16 | insertion | Frame_Shift_Ins | novel | c.1312_1313insCTATCACTGTCAGGGGACTGTGTGAGTCTGTCTGCCAGGACTGT | p.Lys438ThrfsTer30 | p.K438Tfs*30 | Q9NQE7 | protein_coding | TCGA-B6-A0RE-01 | Breast | breast invasive carcinoma | Female | <65 | I/II | Unknown | Unknown | SD | ||
| PRSS16 | insertion | Nonsense_Mutation | novel | c.214_215insCTGCTGAAAGGTGATGGATTTAAGGC | p.Asp73AlafsTer4 | p.D73Afs*4 | Q9NQE7 | protein_coding | TCGA-BH-A0H7-01 | Breast | breast invasive carcinoma | Female | >=65 | III/IV | Chemotherapy | doxorubicin | SD | ||
| PRSS16 | SNV | Missense_Mutation | novel | c.640G>T | p.Ala214Ser | p.A214S | Q9NQE7 | protein_coding | deleterious(0.01) | probably_damaging(0.917) | TCGA-2W-A8YY-01 | Cervix | cervical & endocervical cancer | Female | <65 | I/II | Chemotherapy | cisplatin | CR |
| PRSS16 | SNV | Missense_Mutation | novel | c.658G>A | p.Glu220Lys | p.E220K | Q9NQE7 | protein_coding | tolerated(0.67) | benign(0.011) | TCGA-C5-A2LZ-01 | Cervix | cervical & endocervical cancer | Female | >=65 | III/IV | Unknown | Unknown | PD |
| PRSS16 | SNV | Missense_Mutation | c.218N>G | p.Asp73Gly | p.D73G | Q9NQE7 | protein_coding | deleterious(0.02) | possibly_damaging(0.597) | TCGA-AA-3510-01 | Colorectum | colon adenocarcinoma | Male | >=65 | I/II | Unknown | Unknown | SD | |
| PRSS16 | SNV | Missense_Mutation | novel | c.1069N>A | p.Gln357Lys | p.Q357K | Q9NQE7 | protein_coding | tolerated(0.09) | benign(0.036) | TCGA-AA-3521-01 | Colorectum | colon adenocarcinoma | Male | >=65 | I/II | Unknown | Unknown | SD |
| PRSS16 | SNV | Missense_Mutation | c.395N>T | p.Arg132Ile | p.R132I | Q9NQE7 | protein_coding | deleterious(0) | probably_damaging(1) | TCGA-AA-A010-01 | Colorectum | colon adenocarcinoma | Female | <65 | I/II | Chemotherapy | folinic | CR | |
| PRSS16 | SNV | Missense_Mutation | c.1028N>C | p.Gly343Ala | p.G343A | Q9NQE7 | protein_coding | tolerated(0.14) | possibly_damaging(0.604) | TCGA-F5-6861-01 | Colorectum | rectum adenocarcinoma | Female | <65 | I/II | Unknown | Unknown | SD | |
| PRSS16 | SNV | Missense_Mutation | c.490N>T | p.Arg164Cys | p.R164C | Q9NQE7 | protein_coding | deleterious(0) | probably_damaging(0.947) | TCGA-G5-6572-02 | Colorectum | NA | NA | NA | NA | NA | NA | NA |
| Page: 1 2 3 4 5 6 |
Top |
Related drugs of malignant transformation related genes |
| Identification of chemicals and drugs interact with genes involved in malignant transfromation |
| (DGIdb 4.0) |
| Entrez ID | Symbol | Category | Interaction Types | Drug Claim Name | Drug Name | PMIDs |
| Page: 1 |

Copyright 2023-Present -The University of Texas Health Science Center at Houston |