
|
|||||
|
 | |
| |
| |
| |
| |
| |
|
Gene: PRRT3 |
Gene summary for PRRT3 |
| Gene information | Species | Human | Gene symbol | PRRT3 | Gene ID | 285368 |
| Gene name | proline rich transmembrane protein 3 | |
| Gene Alias | PRRT3 | |
| Cytomap | 3p25.3 | |
| Gene Type | protein-coding | GO ID | GO:0005575 | UniProtAcc | Q5FWE3 |
Top |
Malignant transformation analysis |
| Identification of the aberrant gene expression in precancerous and cancerous lesions by comparing the gene expression of stem-like cells in diseased tissues with normal stem cells |
| Entrez ID | Symbol | Replicates | Species | Organ | Tissue | Adj P-value | Log2FC | Malignancy |
| 285368 | PRRT3 | HCC1_Meng | Human | Liver | HCC | 2.69e-23 | 2.51e-02 | 0.0246 |
| 285368 | PRRT3 | HCC1 | Human | Liver | HCC | 7.48e-20 | 1.63e+00 | 0.5336 |
| 285368 | PRRT3 | HCC2 | Human | Liver | HCC | 9.27e-43 | 2.83e+00 | 0.5341 |
| 285368 | PRRT3 | HCC5 | Human | Liver | HCC | 6.78e-73 | 3.01e+00 | 0.4932 |
| 285368 | PRRT3 | S014 | Human | Liver | HCC | 4.70e-08 | 2.36e-01 | 0.2254 |
| 285368 | PRRT3 | S015 | Human | Liver | HCC | 4.99e-10 | 3.31e-01 | 0.2375 |
| 285368 | PRRT3 | S016 | Human | Liver | HCC | 6.89e-08 | 2.57e-01 | 0.2243 |
| Page: 1 |
| Tissue | Expression Dynamics | Abbreviation |
| Liver | 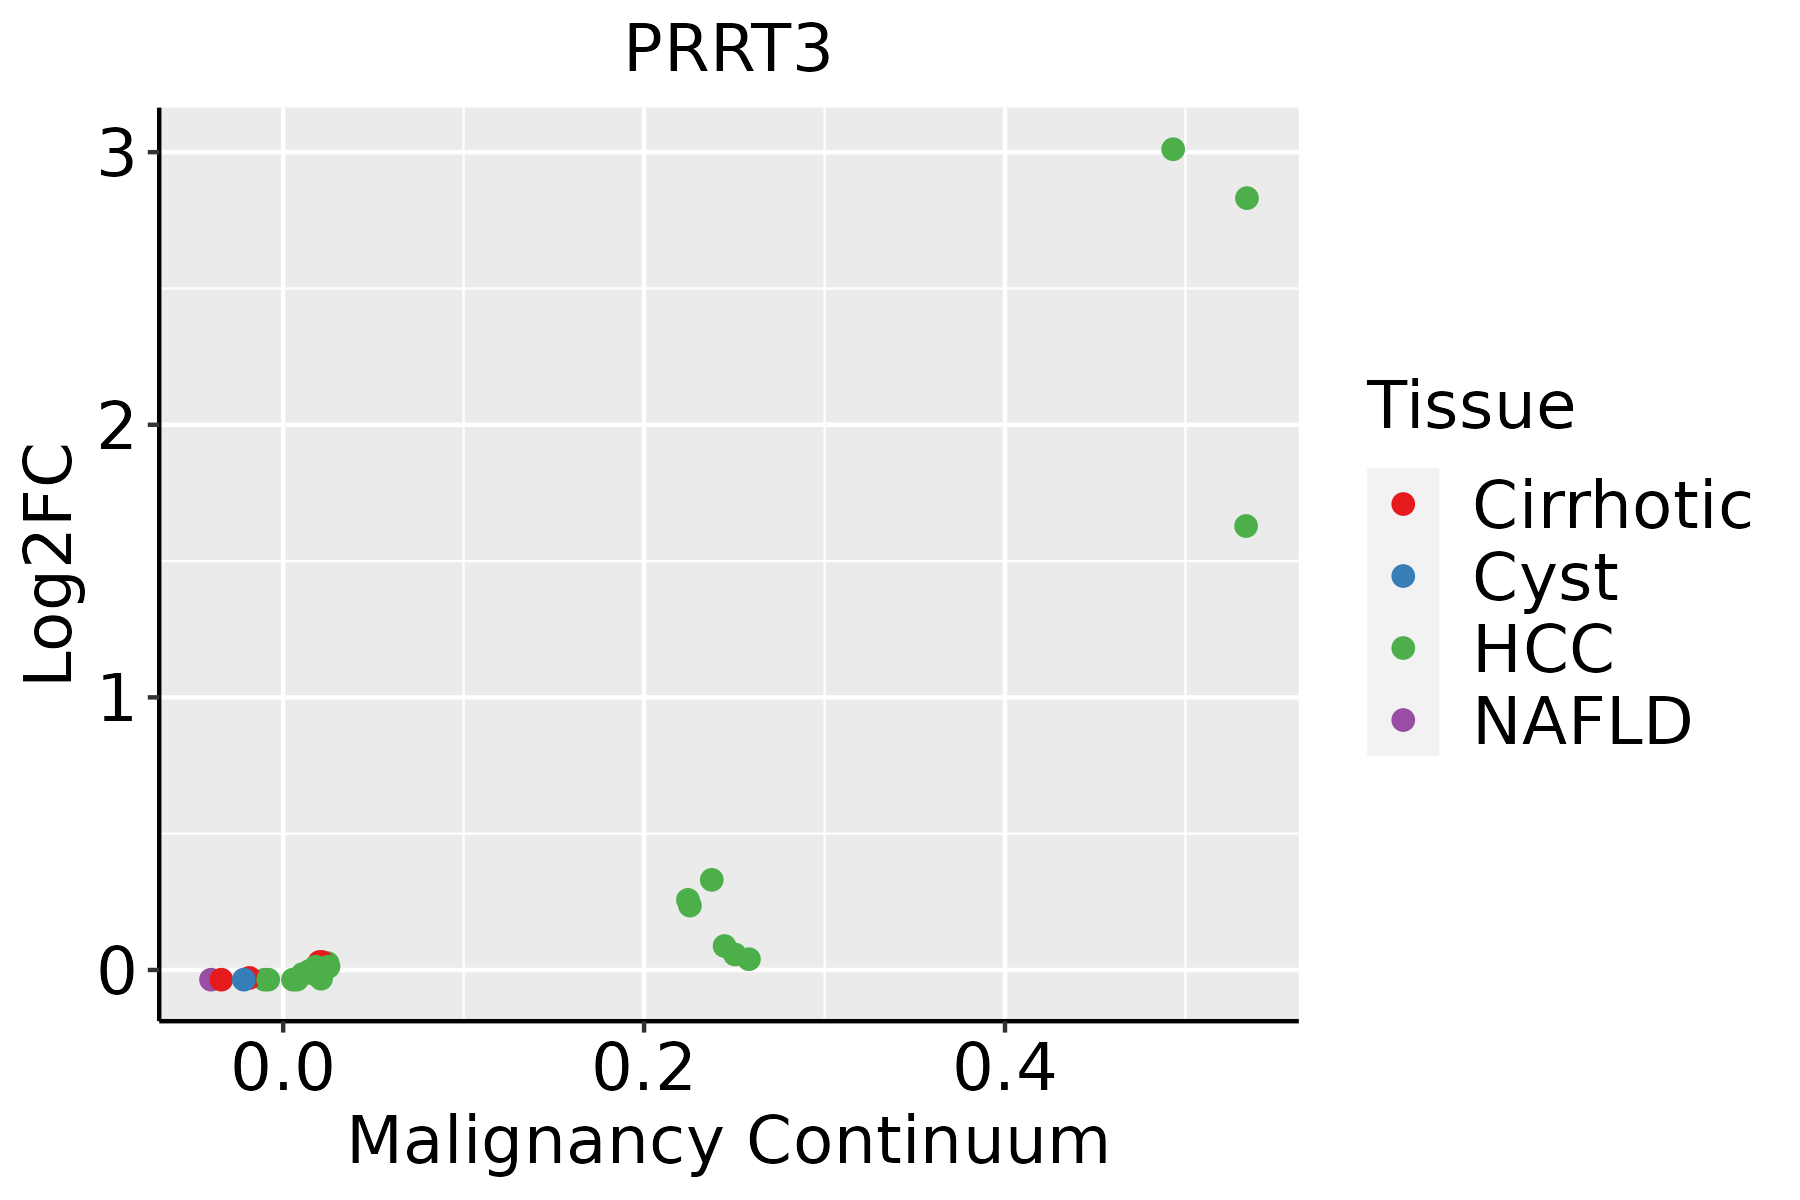 | HCC: Hepatocellular carcinoma |
| NAFLD: Non-alcoholic fatty liver disease |
| ∗log2FC in expression of this searched gene in stem-like cells from each diseased tissue sample relative to stem-like cells in normal samples in each tissue plotted against the malignancy continuum. Samples are colored based on if they are from different disease stage. |
Top |
Malignant transformation related pathway analysis |
| Find out the enriched GO biological processes and KEGG pathways involved in transition from healthy to precancer to cancer |
| Tissue | Disease Stage | Enriched GO biological Processes |
| Colorectum | AD |  |
| Colorectum | SER |  |
| Colorectum | MSS |  |
| Colorectum | MSI-H |  |
| Colorectum | FAP |  |
| ∗Top 15 enriched GO BP terms are showed in the bar plot of each disease state in each tissue. Each row represents a significant GO biological process which is colored according to the -log10(p.adjust). |
| Page: 1 2 3 4 5 6 7 8 9 |
| GO ID | Tissue | Disease Stage | Description | Gene Ratio | Bg Ratio | pvalue | p.adjust | Count |
| Page: 1 |
| Pathway ID | Tissue | Disease Stage | Description | Gene Ratio | Bg Ratio | pvalue | p.adjust | qvalue | Count |
| Page: 1 |
Top |
Cell-cell communication analysis |
| Identification of potential cell-cell interactions between two cell types and their ligand-receptor pairs for different disease states |
| Ligand | Receptor | LRpair | Pathway | Tissue | Disease Stage |
| Page: 1 |
Top |
Single-cell gene regulatory network inference analysis |
| Find out the significant the regulons (TFs) and the target genes of each regulon across cell types for different disease states |
| TF | Cell Type | Tissue | Disease Stage | Target Gene | RSS | Regulon Activity |
| ∗The dot plots of a searched regulon are shown for all cell subpopulations in each disease state of each tissue based on the regulon specific score inferred using pySCENIC and by calculating the average expression. |
| Page: 1 |
Top |
Somatic mutation of malignant transformation related genes |
| Annotation of somatic variants for genes involved in malignant transformation |
| Hugo Symbol | Variant Class | Variant Classification | dbSNP RS | HGVSc | HGVSp | HGVSp Short | SWISSPROT | BIOTYPE | SIFT | PolyPhen | Tumor Sample Barcode | Tissue | Histology | Sex | Age | Stage | Therapy Types | Drugs | Outcome |
| PRRT3 | SNV | Missense_Mutation | novel | c.1840C>A | p.Leu614Met | p.L614M | Q5FWE3 | protein_coding | deleterious(0.04) | probably_damaging(0.989) | TCGA-5L-AAT1-01 | Breast | breast invasive carcinoma | Female | <65 | III/IV | Hormone Therapy | letrozol | SD |
| PRRT3 | SNV | Missense_Mutation | rs569295912 | c.1057N>T | p.Arg353Trp | p.R353W | Q5FWE3 | protein_coding | deleterious(0) | probably_damaging(0.999) | TCGA-A2-A0CW-01 | Breast | breast invasive carcinoma | Female | >=65 | I/II | Hormone Therapy | anastrozole | SD |
| PRRT3 | SNV | Missense_Mutation | novel | c.77N>C | p.Leu26Pro | p.L26P | Q5FWE3 | protein_coding | deleterious_low_confidence(0.02) | possibly_damaging(0.858) | TCGA-A2-A3XT-01 | Breast | breast invasive carcinoma | Female | <65 | I/II | Chemotherapy | cyclophosphamide | PR |
| PRRT3 | SNV | Missense_Mutation | c.988N>A | p.Glu330Lys | p.E330K | Q5FWE3 | protein_coding | tolerated_low_confidence(0.08) | benign(0.169) | TCGA-C8-A12Q-01 | Breast | breast invasive carcinoma | Female | >=65 | III/IV | Unknown | Unknown | PD | |
| PRRT3 | SNV | Missense_Mutation | novel | c.254N>G | p.Glu85Gly | p.E85G | Q5FWE3 | protein_coding | tolerated_low_confidence(0.08) | benign(0) | TCGA-AA-3532-01 | Colorectum | colon adenocarcinoma | Male | <65 | I/II | Unknown | Unknown | SD |
| PRRT3 | SNV | Missense_Mutation | c.853C>T | p.Pro285Ser | p.P285S | Q5FWE3 | protein_coding | deleterious_low_confidence(0) | probably_damaging(0.996) | TCGA-AA-3713-01 | Colorectum | colon adenocarcinoma | Male | >=65 | III/IV | Chemotherapy | 5-fluorouracil | PR | |
| PRRT3 | SNV | Missense_Mutation | c.133N>T | p.Ala45Ser | p.A45S | Q5FWE3 | protein_coding | deleterious_low_confidence(0.04) | benign(0.026) | TCGA-AA-3977-01 | Colorectum | colon adenocarcinoma | Male | >=65 | I/II | Unknown | Unknown | SD | |
| PRRT3 | SNV | Missense_Mutation | rs757482197 | c.232N>A | p.Ala78Thr | p.A78T | Q5FWE3 | protein_coding | tolerated_low_confidence(0.47) | benign(0.001) | TCGA-AZ-6601-01 | Colorectum | colon adenocarcinoma | Male | >=65 | I/II | Unknown | Unknown | PD |
| PRRT3 | SNV | Missense_Mutation | novel | c.1390N>T | p.Arg464Trp | p.R464W | Q5FWE3 | protein_coding | deleterious(0) | probably_damaging(0.985) | TCGA-CA-6717-01 | Colorectum | colon adenocarcinoma | Male | <65 | I/II | Chemotherapy | oxaliplatin | CR |
| PRRT3 | SNV | Missense_Mutation | rs765349938 | c.1246N>T | p.Arg416Cys | p.R416C | Q5FWE3 | protein_coding | deleterious(0) | probably_damaging(0.992) | TCGA-CM-4743-01 | Colorectum | colon adenocarcinoma | Male | >=65 | I/II | Chemotherapy | capecitabine | SD |
| Page: 1 2 3 4 5 |
Top |
Related drugs of malignant transformation related genes |
| Identification of chemicals and drugs interact with genes involved in malignant transfromation |
| (DGIdb 4.0) |
| Entrez ID | Symbol | Category | Interaction Types | Drug Claim Name | Drug Name | PMIDs |
| Page: 1 |

Copyright 2023-Present -The University of Texas Health Science Center at Houston |