
|
|||||
|
 | |
| |
| |
| |
| |
| |
|
Gene: PRRG4 |
Gene summary for PRRG4 |
| Gene information | Species | Human | Gene symbol | PRRG4 | Gene ID | 79056 |
| Gene name | proline rich and Gla domain 4 | |
| Gene Alias | PRGP4 | |
| Cytomap | 11p13 | |
| Gene Type | protein-coding | GO ID | GO:0008150 | UniProtAcc | A0A0S2Z5N9 |
Top |
Malignant transformation analysis |
| Identification of the aberrant gene expression in precancerous and cancerous lesions by comparing the gene expression of stem-like cells in diseased tissues with normal stem cells |
| Entrez ID | Symbol | Replicates | Species | Organ | Tissue | Adj P-value | Log2FC | Malignancy |
| 79056 | PRRG4 | LZE4T | Human | Esophagus | ESCC | 2.00e-14 | 1.18e+00 | 0.0811 |
| 79056 | PRRG4 | LZE7T | Human | Esophagus | ESCC | 5.18e-03 | -8.16e-03 | 0.0667 |
| 79056 | PRRG4 | LZE8T | Human | Esophagus | ESCC | 2.55e-03 | 1.05e-01 | 0.067 |
| 79056 | PRRG4 | LZE20T | Human | Esophagus | ESCC | 2.74e-12 | 4.89e-01 | 0.0662 |
| 79056 | PRRG4 | LZE22T | Human | Esophagus | ESCC | 1.80e-03 | 8.95e-01 | 0.068 |
| 79056 | PRRG4 | LZE24T | Human | Esophagus | ESCC | 1.51e-07 | 6.26e-01 | 0.0596 |
| 79056 | PRRG4 | P2T-E | Human | Esophagus | ESCC | 5.05e-13 | 5.59e-01 | 0.1177 |
| 79056 | PRRG4 | P4T-E | Human | Esophagus | ESCC | 4.86e-18 | 8.22e-01 | 0.1323 |
| 79056 | PRRG4 | P5T-E | Human | Esophagus | ESCC | 2.04e-07 | 2.90e-01 | 0.1327 |
| 79056 | PRRG4 | P8T-E | Human | Esophagus | ESCC | 6.65e-19 | 5.17e-01 | 0.0889 |
| 79056 | PRRG4 | P9T-E | Human | Esophagus | ESCC | 3.36e-21 | 8.66e-01 | 0.1131 |
| 79056 | PRRG4 | P10T-E | Human | Esophagus | ESCC | 8.75e-41 | 9.81e-01 | 0.116 |
| 79056 | PRRG4 | P11T-E | Human | Esophagus | ESCC | 9.54e-16 | 1.94e+00 | 0.1426 |
| 79056 | PRRG4 | P12T-E | Human | Esophagus | ESCC | 3.49e-31 | 8.85e-01 | 0.1122 |
| 79056 | PRRG4 | P15T-E | Human | Esophagus | ESCC | 1.79e-37 | 1.30e+00 | 0.1149 |
| 79056 | PRRG4 | P16T-E | Human | Esophagus | ESCC | 3.90e-05 | -1.09e-01 | 0.1153 |
| 79056 | PRRG4 | P20T-E | Human | Esophagus | ESCC | 3.67e-36 | 1.07e+00 | 0.1124 |
| 79056 | PRRG4 | P21T-E | Human | Esophagus | ESCC | 1.34e-55 | 1.57e+00 | 0.1617 |
| 79056 | PRRG4 | P22T-E | Human | Esophagus | ESCC | 5.77e-47 | 1.10e+00 | 0.1236 |
| 79056 | PRRG4 | P23T-E | Human | Esophagus | ESCC | 2.16e-24 | 1.01e+00 | 0.108 |
| Page: 1 2 3 4 5 6 |
| Tissue | Expression Dynamics | Abbreviation |
| Esophagus | 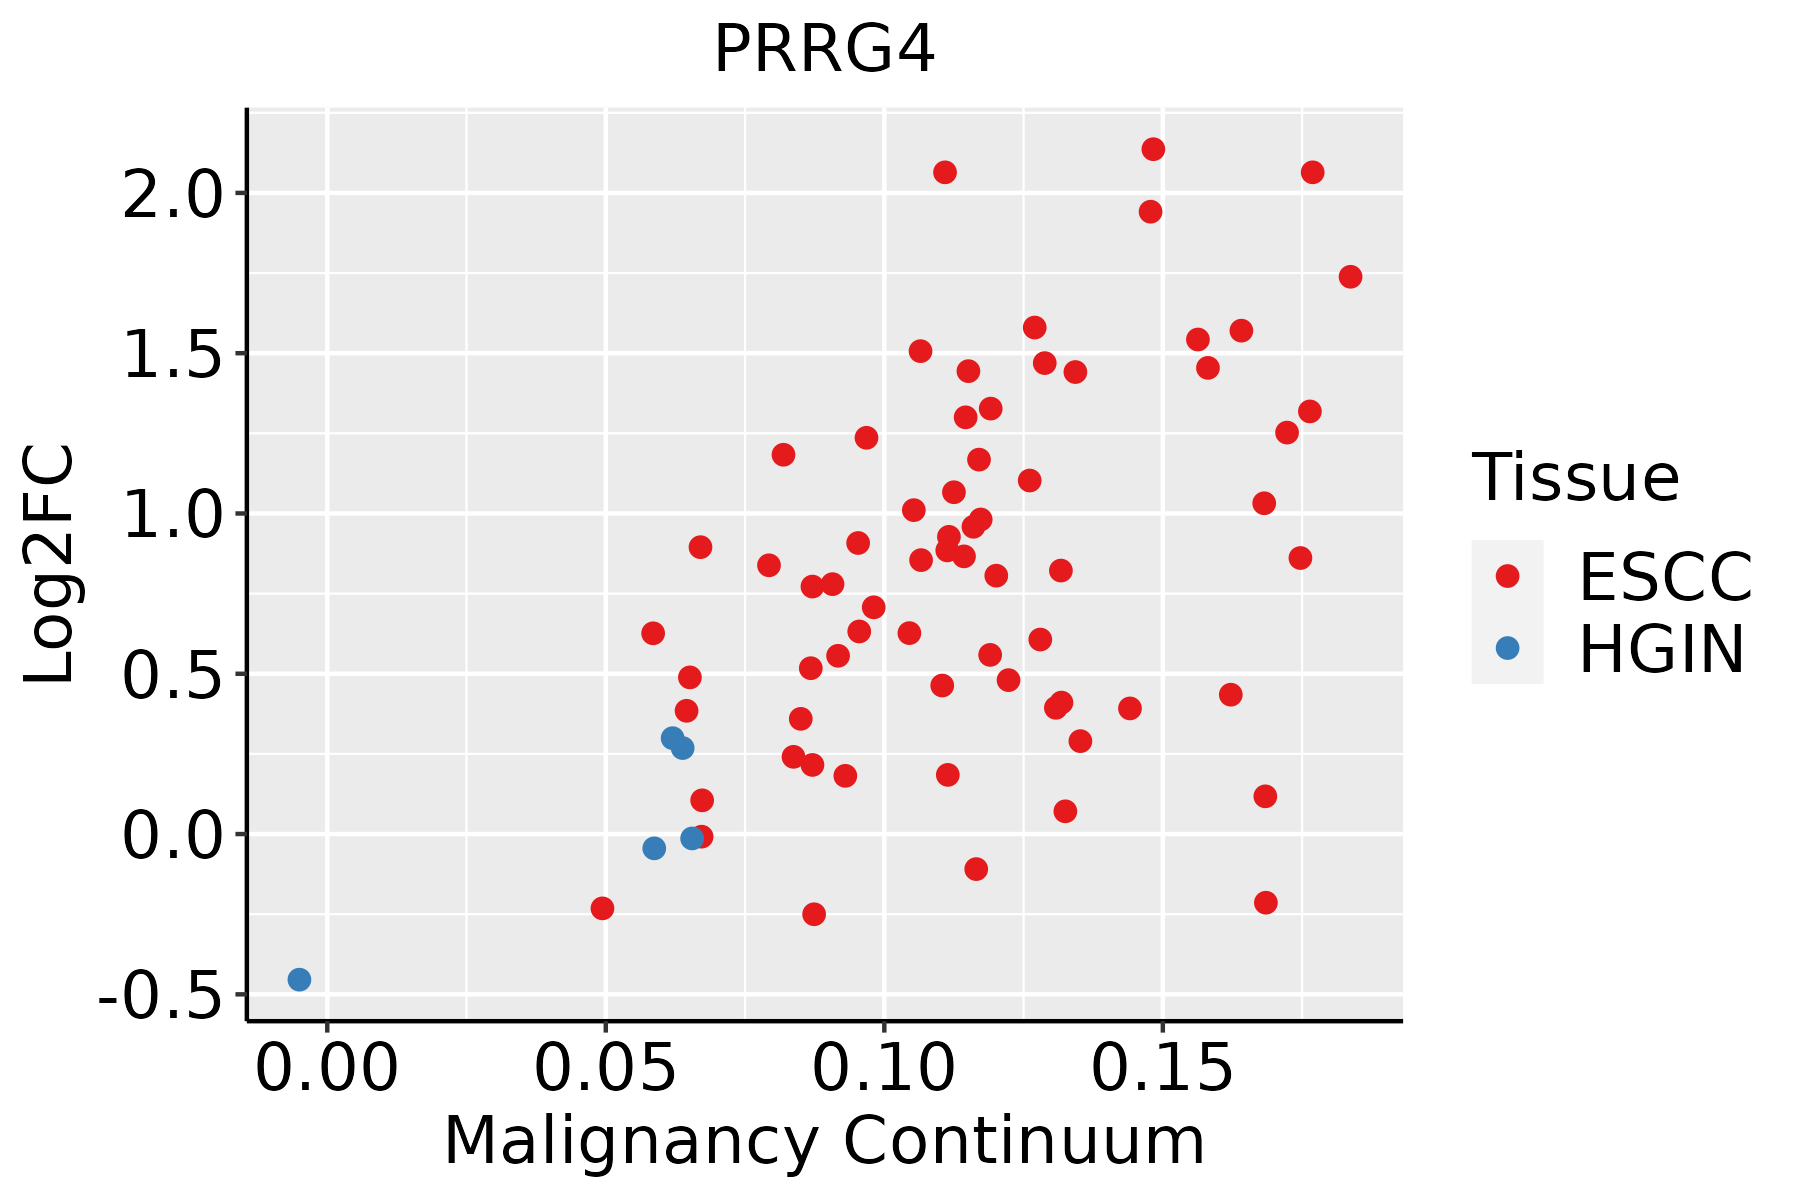 | ESCC: Esophageal squamous cell carcinoma |
| HGIN: High-grade intraepithelial neoplasias | ||
| LGIN: Low-grade intraepithelial neoplasias | ||
| Liver |  | HCC: Hepatocellular carcinoma |
| NAFLD: Non-alcoholic fatty liver disease | ||
| Lung | 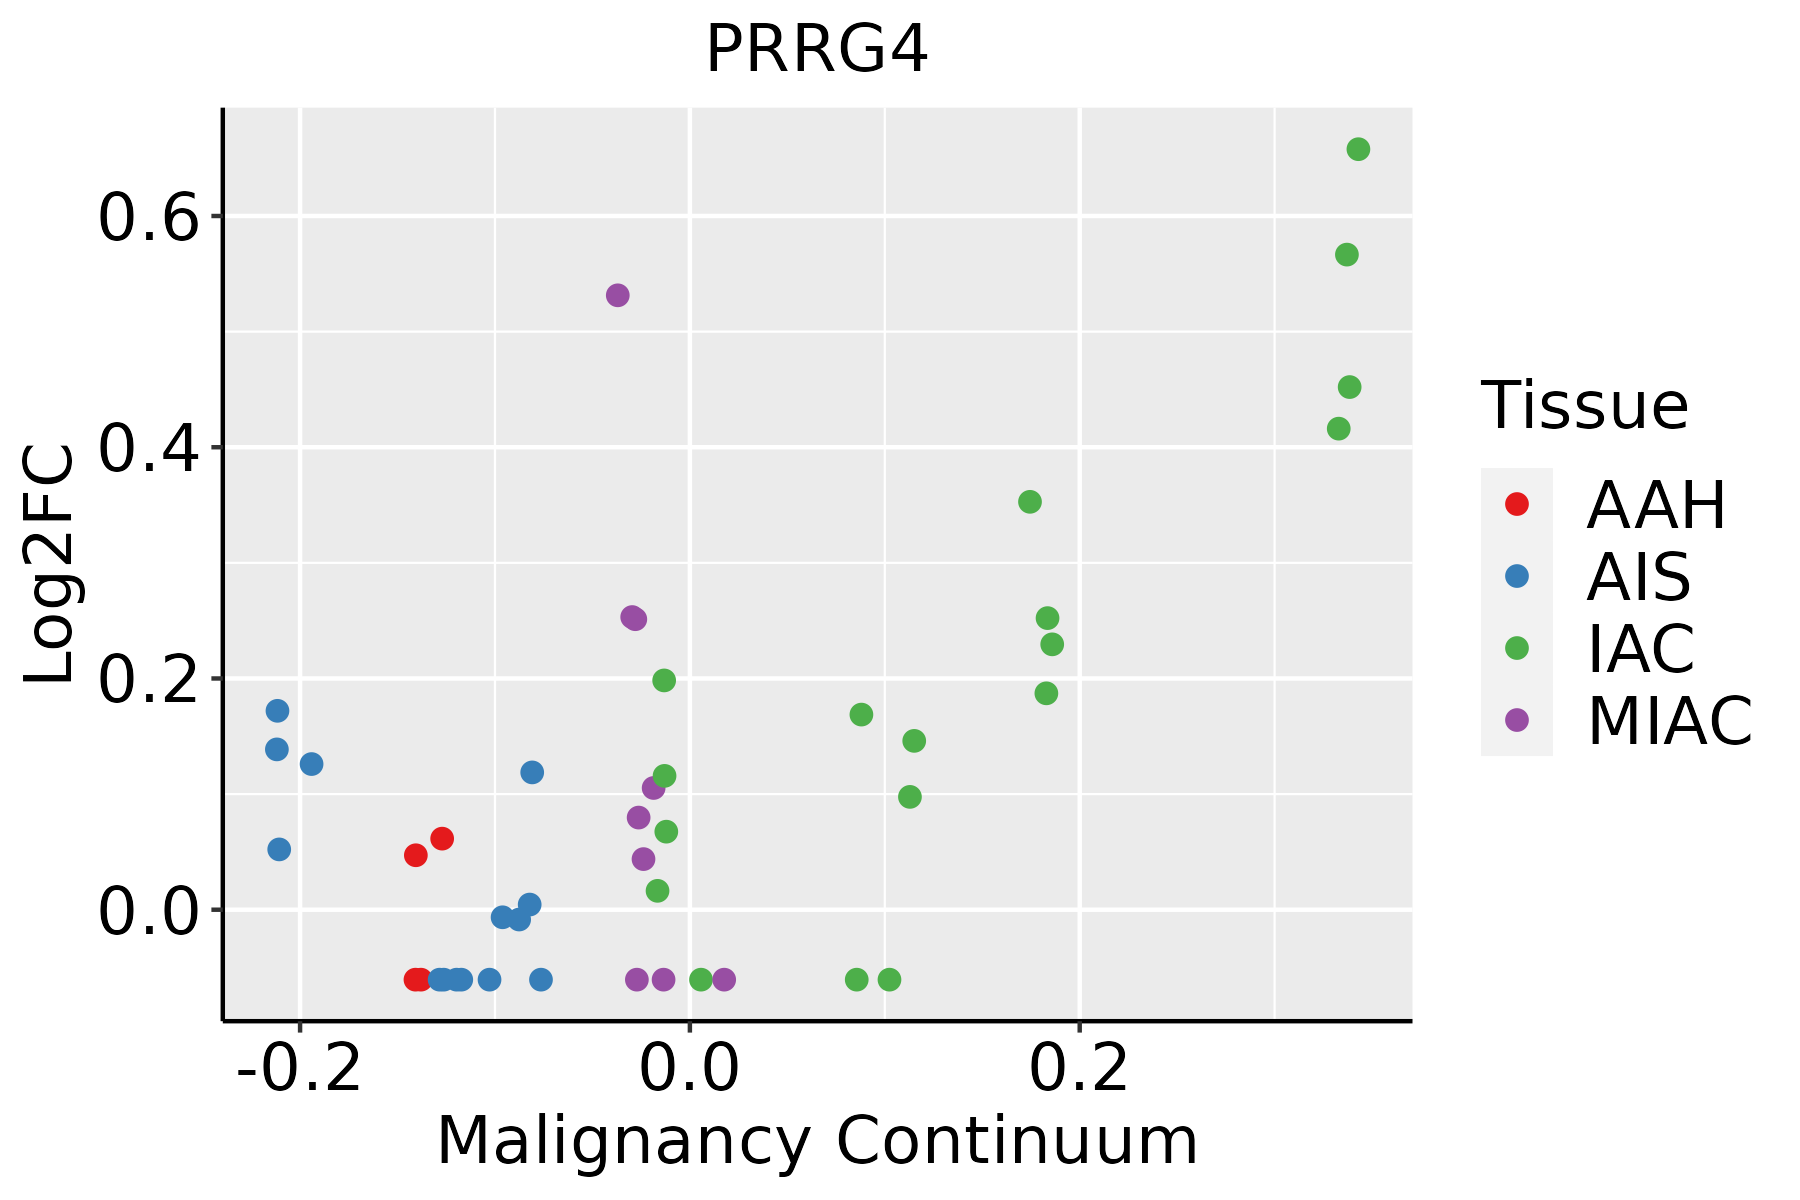 | AAH: Atypical adenomatous hyperplasia |
| AIS: Adenocarcinoma in situ | ||
| IAC: Invasive lung adenocarcinoma | ||
| MIA: Minimally invasive adenocarcinoma | ||
| Oral Cavity |  | EOLP: Erosive Oral lichen planus |
| LP: leukoplakia | ||
| NEOLP: Non-erosive oral lichen planus | ||
| OSCC: Oral squamous cell carcinoma | ||
| Skin |  | AK: Actinic keratosis |
| cSCC: Cutaneous squamous cell carcinoma | ||
| SCCIS:squamous cell carcinoma in situ |
| ∗log2FC in expression of this searched gene in stem-like cells from each diseased tissue sample relative to stem-like cells in normal samples in each tissue plotted against the malignancy continuum. Samples are colored based on if they are from different disease stage. |
Top |
Malignant transformation related pathway analysis |
| Find out the enriched GO biological processes and KEGG pathways involved in transition from healthy to precancer to cancer |
| Tissue | Disease Stage | Enriched GO biological Processes |
| Colorectum | AD |  |
| Colorectum | SER |  |
| Colorectum | MSS |  |
| Colorectum | MSI-H |  |
| Colorectum | FAP |  |
| ∗Top 15 enriched GO BP terms are showed in the bar plot of each disease state in each tissue. Each row represents a significant GO biological process which is colored according to the -log10(p.adjust). |
| Page: 1 2 3 4 5 6 7 8 9 |
| GO ID | Tissue | Disease Stage | Description | Gene Ratio | Bg Ratio | pvalue | p.adjust | Count |
| Page: 1 |
| Pathway ID | Tissue | Disease Stage | Description | Gene Ratio | Bg Ratio | pvalue | p.adjust | qvalue | Count |
| Page: 1 |
Top |
Cell-cell communication analysis |
| Identification of potential cell-cell interactions between two cell types and their ligand-receptor pairs for different disease states |
| Ligand | Receptor | LRpair | Pathway | Tissue | Disease Stage |
| Page: 1 |
Top |
Single-cell gene regulatory network inference analysis |
| Find out the significant the regulons (TFs) and the target genes of each regulon across cell types for different disease states |
| TF | Cell Type | Tissue | Disease Stage | Target Gene | RSS | Regulon Activity |
| ∗The dot plots of a searched regulon are shown for all cell subpopulations in each disease state of each tissue based on the regulon specific score inferred using pySCENIC and by calculating the average expression. |
| Page: 1 |
Top |
Somatic mutation of malignant transformation related genes |
| Annotation of somatic variants for genes involved in malignant transformation |
| Hugo Symbol | Variant Class | Variant Classification | dbSNP RS | HGVSc | HGVSp | HGVSp Short | SWISSPROT | BIOTYPE | SIFT | PolyPhen | Tumor Sample Barcode | Tissue | Histology | Sex | Age | Stage | Therapy Types | Drugs | Outcome |
| PRRG4 | SNV | Missense_Mutation | novel | c.133N>G | p.Phe45Val | p.F45V | Q9BZD6 | protein_coding | deleterious(0.04) | benign(0.056) | TCGA-CA-6717-01 | Colorectum | colon adenocarcinoma | Male | <65 | I/II | Chemotherapy | oxaliplatin | CR |
| PRRG4 | SNV | Missense_Mutation | c.358N>A | p.Gly120Arg | p.G120R | Q9BZD6 | protein_coding | deleterious(0) | probably_damaging(0.986) | TCGA-CK-5915-01 | Colorectum | colon adenocarcinoma | Male | <65 | I/II | Unknown | Unknown | SD | |
| PRRG4 | SNV | Missense_Mutation | novel | c.515C>T | p.Ala172Val | p.A172V | Q9BZD6 | protein_coding | tolerated(1) | benign(0.01) | TCGA-AX-A1C4-01 | Endometrium | uterine corpus endometrioid carcinoma | Female | <65 | I/II | Unknown | Unknown | SD |
| PRRG4 | SNV | Missense_Mutation | c.169N>A | p.Leu57Met | p.L57M | Q9BZD6 | protein_coding | deleterious(0.03) | benign(0.228) | TCGA-D1-A17Q-01 | Endometrium | uterine corpus endometrioid carcinoma | Female | <65 | I/II | Unknown | Unknown | SD | |
| PRRG4 | SNV | Missense_Mutation | novel | c.275T>G | p.Phe92Cys | p.F92C | Q9BZD6 | protein_coding | deleterious(0) | probably_damaging(0.96) | TCGA-EO-A22U-01 | Endometrium | uterine corpus endometrioid carcinoma | Female | >=65 | I/II | Unknown | Unknown | SD |
| PRRG4 | SNV | Missense_Mutation | novel | c.413N>G | p.Leu138Arg | p.L138R | Q9BZD6 | protein_coding | tolerated(0.06) | possibly_damaging(0.564) | TCGA-EY-A1G8-01 | Endometrium | uterine corpus endometrioid carcinoma | Female | >=65 | I/II | Unknown | Unknown | SD |
| PRRG4 | SNV | Missense_Mutation | novel | c.532C>T | p.Pro178Ser | p.P178S | Q9BZD6 | protein_coding | tolerated(0.21) | benign(0.007) | TCGA-H5-A2HR-01 | Endometrium | uterine corpus endometrioid carcinoma | Female | >=65 | I/II | Unknown | Unknown | SD |
| PRRG4 | SNV | Missense_Mutation | rs778682926 | c.256N>A | p.Glu86Lys | p.E86K | Q9BZD6 | protein_coding | tolerated(0.82) | benign(0.054) | TCGA-NJ-A4YP-01 | Lung | lung adenocarcinoma | Male | <65 | I/II | Unknown | Unknown | SD |
| PRRG4 | SNV | Missense_Mutation | novel | c.644N>T | p.Arg215Met | p.R215M | Q9BZD6 | protein_coding | deleterious(0) | benign(0.28) | TCGA-37-3792-01 | Lung | lung squamous cell carcinoma | Male | >=65 | I/II | Unknown | Unknown | SD |
| PRRG4 | SNV | Missense_Mutation | c.526N>G | p.Pro176Ala | p.P176A | Q9BZD6 | protein_coding | deleterious(0.01) | benign(0.112) | TCGA-39-5031-01 | Lung | lung squamous cell carcinoma | Female | >=65 | I/II | Unknown | Unknown | SD |
| Page: 1 2 |
Top |
Related drugs of malignant transformation related genes |
| Identification of chemicals and drugs interact with genes involved in malignant transfromation |
| (DGIdb 4.0) |
| Entrez ID | Symbol | Category | Interaction Types | Drug Claim Name | Drug Name | PMIDs |
| Page: 1 |

Copyright 2023-Present -The University of Texas Health Science Center at Houston |