
|
|||||
|
 | |
| |
| |
| |
| |
| |
|
Gene: PRRG2 |
Gene summary for PRRG2 |
| Gene information | Species | Human | Gene symbol | PRRG2 | Gene ID | 5639 |
| Gene name | proline rich and Gla domain 2 | |
| Gene Alias | PRGP2 | |
| Cytomap | 19q13.33 | |
| Gene Type | protein-coding | GO ID | GO:0005575 | UniProtAcc | O14669 |
Top |
Malignant transformation analysis |
| Identification of the aberrant gene expression in precancerous and cancerous lesions by comparing the gene expression of stem-like cells in diseased tissues with normal stem cells |
| Entrez ID | Symbol | Replicates | Species | Organ | Tissue | Adj P-value | Log2FC | Malignancy |
| 5639 | PRRG2 | LZE5T | Human | Esophagus | ESCC | 1.11e-02 | 2.26e-01 | 0.0514 |
| 5639 | PRRG2 | LZE24T | Human | Esophagus | ESCC | 4.59e-09 | 2.24e-01 | 0.0596 |
| 5639 | PRRG2 | P1T-E | Human | Esophagus | ESCC | 6.78e-06 | 3.28e-01 | 0.0875 |
| 5639 | PRRG2 | P2T-E | Human | Esophagus | ESCC | 2.88e-06 | 6.34e-02 | 0.1177 |
| 5639 | PRRG2 | P4T-E | Human | Esophagus | ESCC | 7.08e-13 | 3.61e-01 | 0.1323 |
| 5639 | PRRG2 | P5T-E | Human | Esophagus | ESCC | 5.51e-03 | 2.24e-02 | 0.1327 |
| 5639 | PRRG2 | P8T-E | Human | Esophagus | ESCC | 1.92e-32 | 6.16e-01 | 0.0889 |
| 5639 | PRRG2 | P10T-E | Human | Esophagus | ESCC | 2.33e-18 | 2.64e-01 | 0.116 |
| 5639 | PRRG2 | P11T-E | Human | Esophagus | ESCC | 1.19e-05 | 3.08e-01 | 0.1426 |
| 5639 | PRRG2 | P12T-E | Human | Esophagus | ESCC | 1.98e-20 | 5.15e-01 | 0.1122 |
| 5639 | PRRG2 | P15T-E | Human | Esophagus | ESCC | 1.28e-04 | 1.43e-01 | 0.1149 |
| 5639 | PRRG2 | P16T-E | Human | Esophagus | ESCC | 2.27e-09 | 1.87e-01 | 0.1153 |
| 5639 | PRRG2 | P20T-E | Human | Esophagus | ESCC | 1.44e-05 | 1.84e-01 | 0.1124 |
| 5639 | PRRG2 | P21T-E | Human | Esophagus | ESCC | 1.99e-22 | 3.57e-01 | 0.1617 |
| 5639 | PRRG2 | P22T-E | Human | Esophagus | ESCC | 1.54e-30 | 4.40e-01 | 0.1236 |
| 5639 | PRRG2 | P23T-E | Human | Esophagus | ESCC | 2.02e-14 | 5.93e-01 | 0.108 |
| 5639 | PRRG2 | P24T-E | Human | Esophagus | ESCC | 4.06e-07 | 1.15e-01 | 0.1287 |
| 5639 | PRRG2 | P26T-E | Human | Esophagus | ESCC | 8.79e-26 | 5.40e-01 | 0.1276 |
| 5639 | PRRG2 | P27T-E | Human | Esophagus | ESCC | 1.79e-23 | 4.56e-01 | 0.1055 |
| 5639 | PRRG2 | P28T-E | Human | Esophagus | ESCC | 9.09e-07 | 1.77e-01 | 0.1149 |
| Page: 1 2 3 4 |
| Tissue | Expression Dynamics | Abbreviation |
| Esophagus | 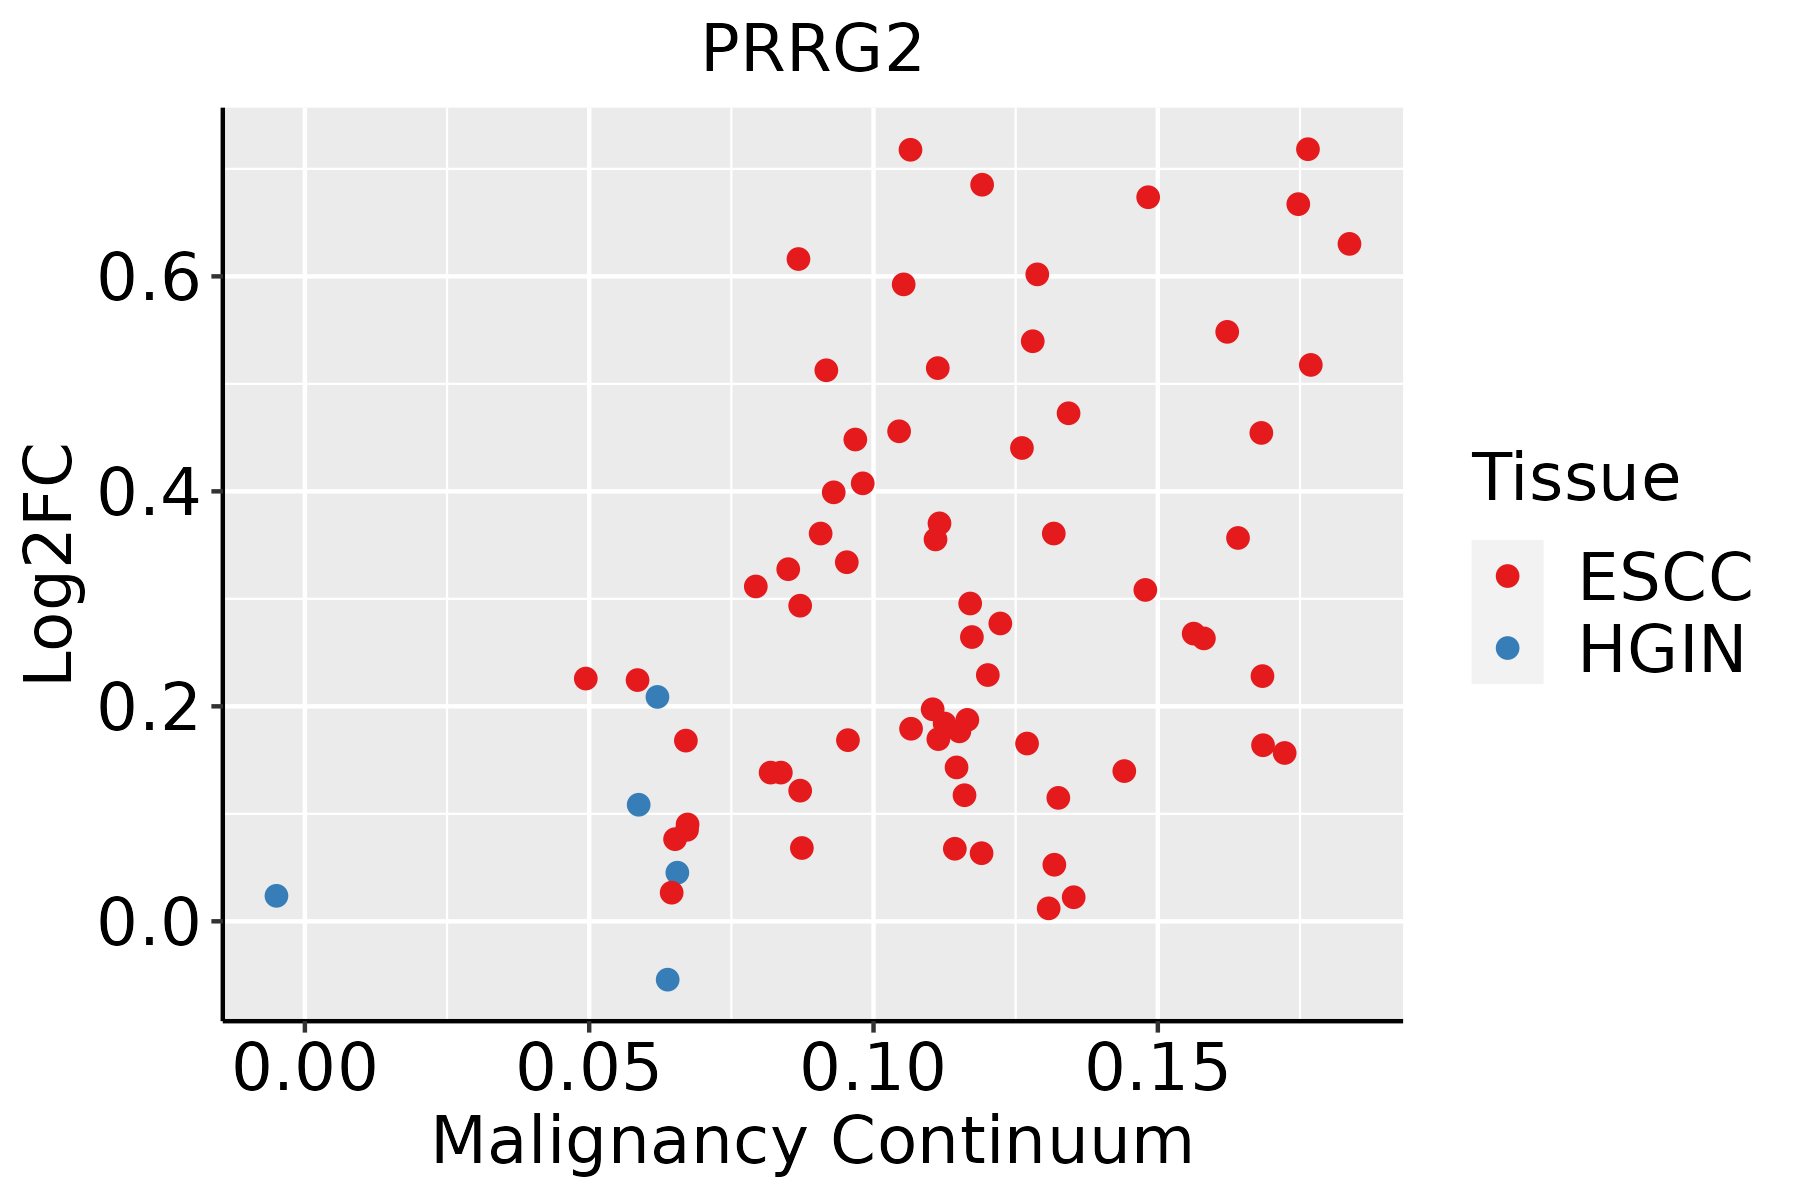 | ESCC: Esophageal squamous cell carcinoma |
| HGIN: High-grade intraepithelial neoplasias | ||
| LGIN: Low-grade intraepithelial neoplasias | ||
| Oral Cavity | 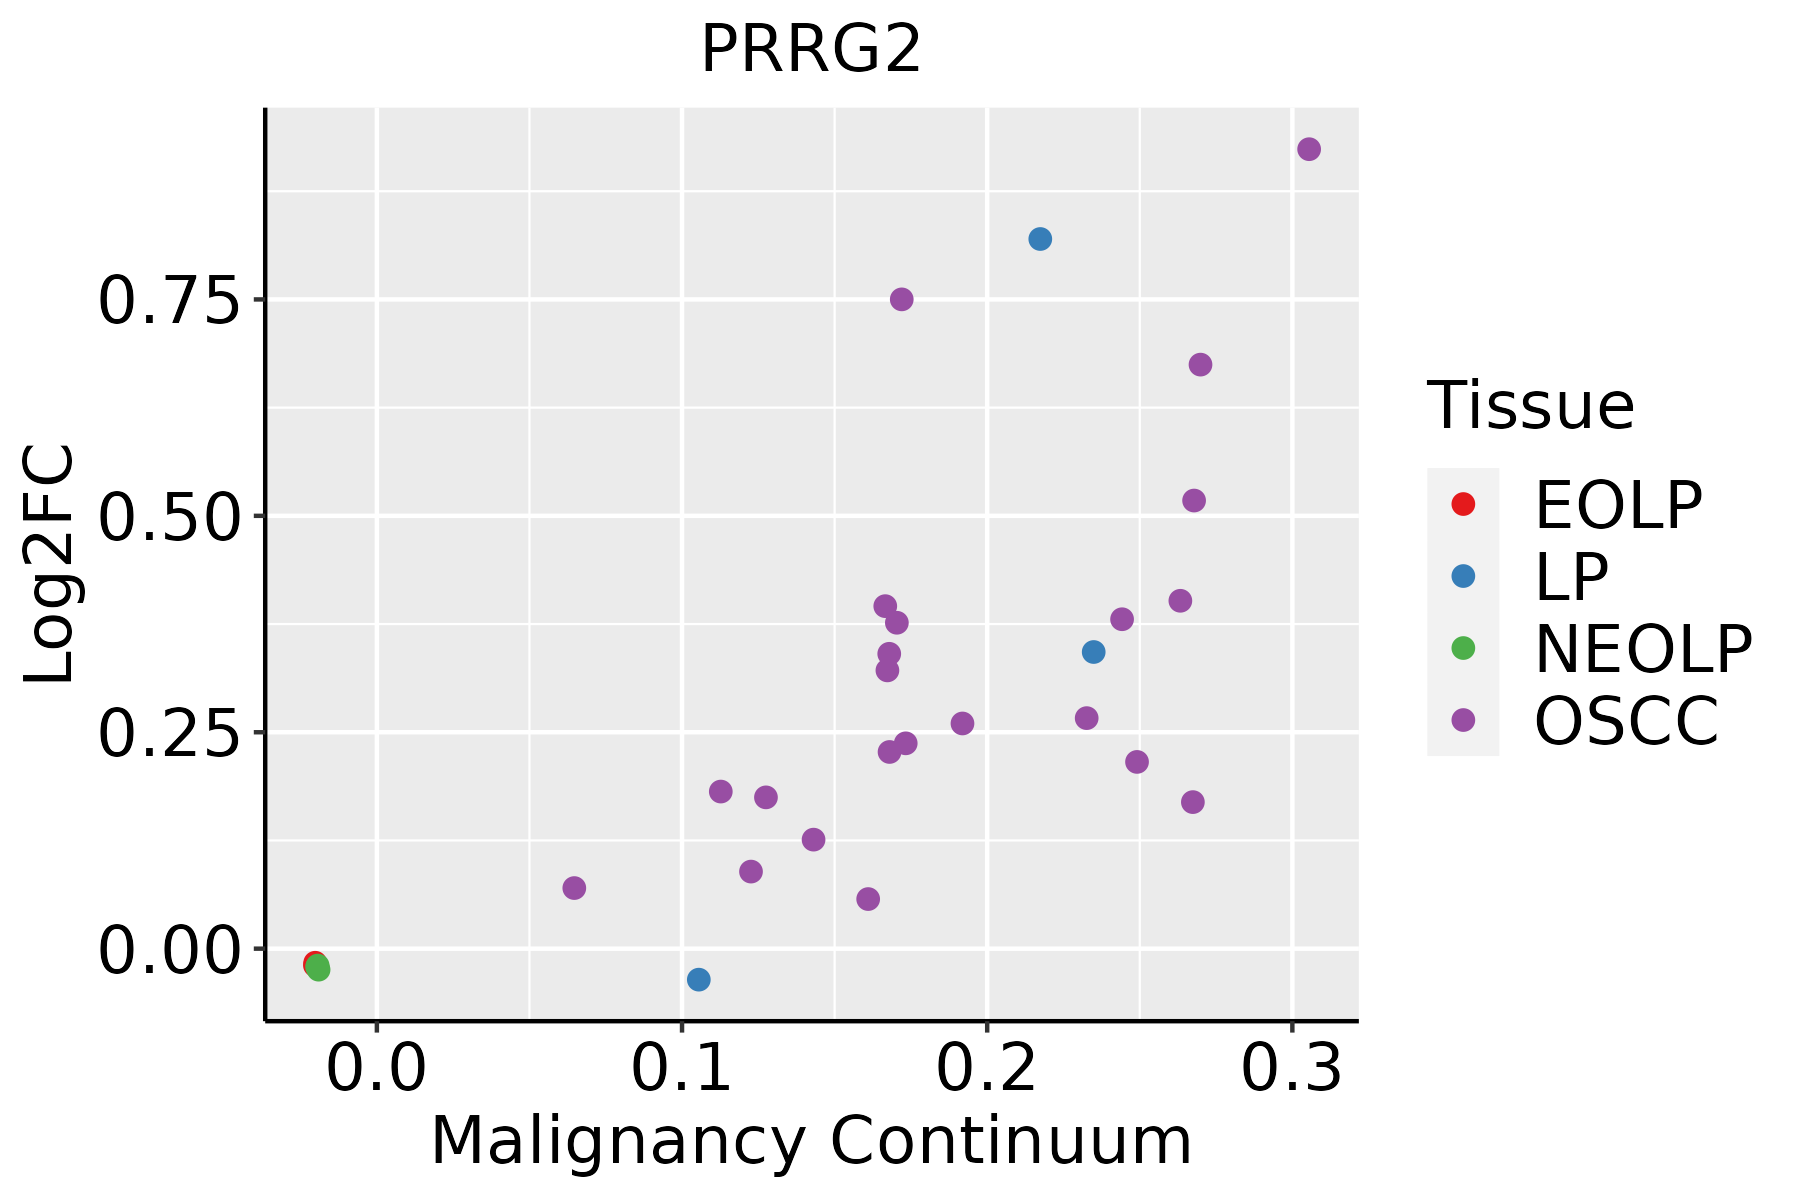 | EOLP: Erosive Oral lichen planus |
| LP: leukoplakia | ||
| NEOLP: Non-erosive oral lichen planus | ||
| OSCC: Oral squamous cell carcinoma |
| ∗log2FC in expression of this searched gene in stem-like cells from each diseased tissue sample relative to stem-like cells in normal samples in each tissue plotted against the malignancy continuum. Samples are colored based on if they are from different disease stage. |
Top |
Malignant transformation related pathway analysis |
| Find out the enriched GO biological processes and KEGG pathways involved in transition from healthy to precancer to cancer |
| Tissue | Disease Stage | Enriched GO biological Processes |
| Colorectum | AD |  |
| Colorectum | SER |  |
| Colorectum | MSS |  |
| Colorectum | MSI-H |  |
| Colorectum | FAP |  |
| ∗Top 15 enriched GO BP terms are showed in the bar plot of each disease state in each tissue. Each row represents a significant GO biological process which is colored according to the -log10(p.adjust). |
| Page: 1 2 3 4 5 6 7 8 9 |
| GO ID | Tissue | Disease Stage | Description | Gene Ratio | Bg Ratio | pvalue | p.adjust | Count |
| Page: 1 |
| Pathway ID | Tissue | Disease Stage | Description | Gene Ratio | Bg Ratio | pvalue | p.adjust | qvalue | Count |
| Page: 1 |
Top |
Cell-cell communication analysis |
| Identification of potential cell-cell interactions between two cell types and their ligand-receptor pairs for different disease states |
| Ligand | Receptor | LRpair | Pathway | Tissue | Disease Stage |
| Page: 1 |
Top |
Single-cell gene regulatory network inference analysis |
| Find out the significant the regulons (TFs) and the target genes of each regulon across cell types for different disease states |
| TF | Cell Type | Tissue | Disease Stage | Target Gene | RSS | Regulon Activity |
| ∗The dot plots of a searched regulon are shown for all cell subpopulations in each disease state of each tissue based on the regulon specific score inferred using pySCENIC and by calculating the average expression. |
| Page: 1 |
Top |
Somatic mutation of malignant transformation related genes |
| Annotation of somatic variants for genes involved in malignant transformation |
| Hugo Symbol | Variant Class | Variant Classification | dbSNP RS | HGVSc | HGVSp | HGVSp Short | SWISSPROT | BIOTYPE | SIFT | PolyPhen | Tumor Sample Barcode | Tissue | Histology | Sex | Age | Stage | Therapy Types | Drugs | Outcome |
| PRRG2 | SNV | Missense_Mutation | rs538503371 | c.305N>A | p.Arg102His | p.R102H | O14669 | protein_coding | tolerated(0.2) | benign(0.003) | TCGA-AR-A24N-01 | Breast | breast invasive carcinoma | Female | <65 | I/II | Unknown | Unknown | SD |
| PRRG2 | SNV | Missense_Mutation | rs372756332 | c.404N>A | p.Arg135Gln | p.R135Q | O14669 | protein_coding | deleterious(0.04) | benign(0.005) | TCGA-C5-A1BQ-01 | Cervix | cervical & endocervical cancer | Female | >=65 | III/IV | Chemotherapy | cisplatin | CR |
| PRRG2 | SNV | Missense_Mutation | c.210N>T | p.Glu70Asp | p.E70D | O14669 | protein_coding | deleterious(0) | probably_damaging(0.994) | TCGA-FU-A3HZ-01 | Cervix | cervical & endocervical cancer | Female | <65 | I/II | Chemotherapy | cisplatin | CR | |
| PRRG2 | insertion | Frame_Shift_Ins | novel | c.290_291insT | p.Gly98TrpfsTer54 | p.G98Wfs*54 | O14669 | protein_coding | TCGA-AD-6889-01 | Colorectum | colon adenocarcinoma | Male | >=65 | I/II | Chemotherapy | xeloda | PD | ||
| PRRG2 | SNV | Missense_Mutation | novel | c.5G>T | p.Arg2Met | p.R2M | O14669 | protein_coding | deleterious_low_confidence(0) | possibly_damaging(0.888) | TCGA-AJ-A3EK-01 | Endometrium | uterine corpus endometrioid carcinoma | Female | <65 | I/II | Chemotherapy | carboplatin | CR |
| PRRG2 | SNV | Missense_Mutation | novel | c.37N>A | p.Ala13Thr | p.A13T | O14669 | protein_coding | tolerated(0.1) | benign(0.031) | TCGA-DF-A2KU-01 | Endometrium | uterine corpus endometrioid carcinoma | Female | Unknown | I/II | Unknown | Unknown | SD |
| PRRG2 | SNV | Missense_Mutation | rs778423334 | c.602N>T | p.Pro201Leu | p.P201L | O14669 | protein_coding | tolerated_low_confidence(0.16) | benign(0.015) | TCGA-49-AARN-01 | Lung | lung adenocarcinoma | Female | <65 | I/II | Unknown | Unknown | SD |
| PRRG2 | SNV | Missense_Mutation | rs778423334 | c.602C>T | p.Pro201Leu | p.P201L | O14669 | protein_coding | tolerated_low_confidence(0.16) | benign(0.015) | TCGA-55-7728-01 | Lung | lung adenocarcinoma | Female | <65 | I/II | Unknown | Unknown | SD |
| PRRG2 | SNV | Missense_Mutation | rs750973776 | c.152N>G | p.Asn51Ser | p.N51S | O14669 | protein_coding | deleterious(0) | probably_damaging(0.985) | TCGA-21-1081-01 | Lung | lung squamous cell carcinoma | Male | >=65 | I/II | Unknown | Unknown | PD |
| PRRG2 | insertion | Frame_Shift_Ins | novel | c.99_100insC | p.Glu36ArgfsTer8 | p.E36Rfs*8 | O14669 | protein_coding | TCGA-34-2604-01 | Lung | lung squamous cell carcinoma | Female | >=65 | I/II | Unknown | Unknown | SD |
| Page: 1 2 |
Top |
Related drugs of malignant transformation related genes |
| Identification of chemicals and drugs interact with genes involved in malignant transfromation |
| (DGIdb 4.0) |
| Entrez ID | Symbol | Category | Interaction Types | Drug Claim Name | Drug Name | PMIDs |
| Page: 1 |

Copyright 2023-Present -The University of Texas Health Science Center at Houston |