
|
|||||
|
 | |
| |
| |
| |
| |
| |
|
Gene: PRR7 |
Gene summary for PRR7 |
| Gene information | Species | Human | Gene symbol | PRR7 | Gene ID | 80758 |
| Gene name | proline rich 7, synaptic | |
| Gene Alias | PRR7 | |
| Cytomap | 5q35.3 | |
| Gene Type | protein-coding | GO ID | GO:0001775 | UniProtAcc | A0A024R7R8 |
Top |
Malignant transformation analysis |
| Identification of the aberrant gene expression in precancerous and cancerous lesions by comparing the gene expression of stem-like cells in diseased tissues with normal stem cells |
| Entrez ID | Symbol | Replicates | Species | Organ | Tissue | Adj P-value | Log2FC | Malignancy |
| 80758 | PRR7 | LZE2T | Human | Esophagus | ESCC | 8.02e-03 | 2.76e-01 | 0.082 |
| 80758 | PRR7 | LZE24T | Human | Esophagus | ESCC | 1.07e-08 | 2.91e-01 | 0.0596 |
| 80758 | PRR7 | LZE21T | Human | Esophagus | ESCC | 1.22e-11 | 4.17e-01 | 0.0655 |
| 80758 | PRR7 | P1T-E | Human | Esophagus | ESCC | 7.37e-10 | 2.27e-01 | 0.0875 |
| 80758 | PRR7 | P2T-E | Human | Esophagus | ESCC | 4.22e-41 | 7.23e-01 | 0.1177 |
| 80758 | PRR7 | P4T-E | Human | Esophagus | ESCC | 9.17e-28 | 5.63e-01 | 0.1323 |
| 80758 | PRR7 | P5T-E | Human | Esophagus | ESCC | 6.71e-37 | 7.03e-01 | 0.1327 |
| 80758 | PRR7 | P9T-E | Human | Esophagus | ESCC | 1.25e-08 | 7.56e-02 | 0.1131 |
| 80758 | PRR7 | P10T-E | Human | Esophagus | ESCC | 2.88e-11 | 2.39e-01 | 0.116 |
| 80758 | PRR7 | P11T-E | Human | Esophagus | ESCC | 6.46e-13 | 4.70e-01 | 0.1426 |
| 80758 | PRR7 | P12T-E | Human | Esophagus | ESCC | 7.58e-34 | 6.94e-01 | 0.1122 |
| 80758 | PRR7 | P15T-E | Human | Esophagus | ESCC | 8.91e-33 | 5.93e-01 | 0.1149 |
| 80758 | PRR7 | P16T-E | Human | Esophagus | ESCC | 1.21e-40 | 7.30e-01 | 0.1153 |
| 80758 | PRR7 | P17T-E | Human | Esophagus | ESCC | 7.17e-10 | 3.96e-01 | 0.1278 |
| 80758 | PRR7 | P19T-E | Human | Esophagus | ESCC | 4.38e-05 | 4.86e-01 | 0.1662 |
| 80758 | PRR7 | P20T-E | Human | Esophagus | ESCC | 1.53e-20 | 4.36e-01 | 0.1124 |
| 80758 | PRR7 | P21T-E | Human | Esophagus | ESCC | 7.70e-34 | 6.64e-01 | 0.1617 |
| 80758 | PRR7 | P22T-E | Human | Esophagus | ESCC | 1.21e-50 | 7.62e-01 | 0.1236 |
| 80758 | PRR7 | P23T-E | Human | Esophagus | ESCC | 2.00e-19 | 3.81e-01 | 0.108 |
| 80758 | PRR7 | P24T-E | Human | Esophagus | ESCC | 1.64e-17 | 3.65e-01 | 0.1287 |
| Page: 1 2 3 4 5 |
| Tissue | Expression Dynamics | Abbreviation |
| Esophagus | 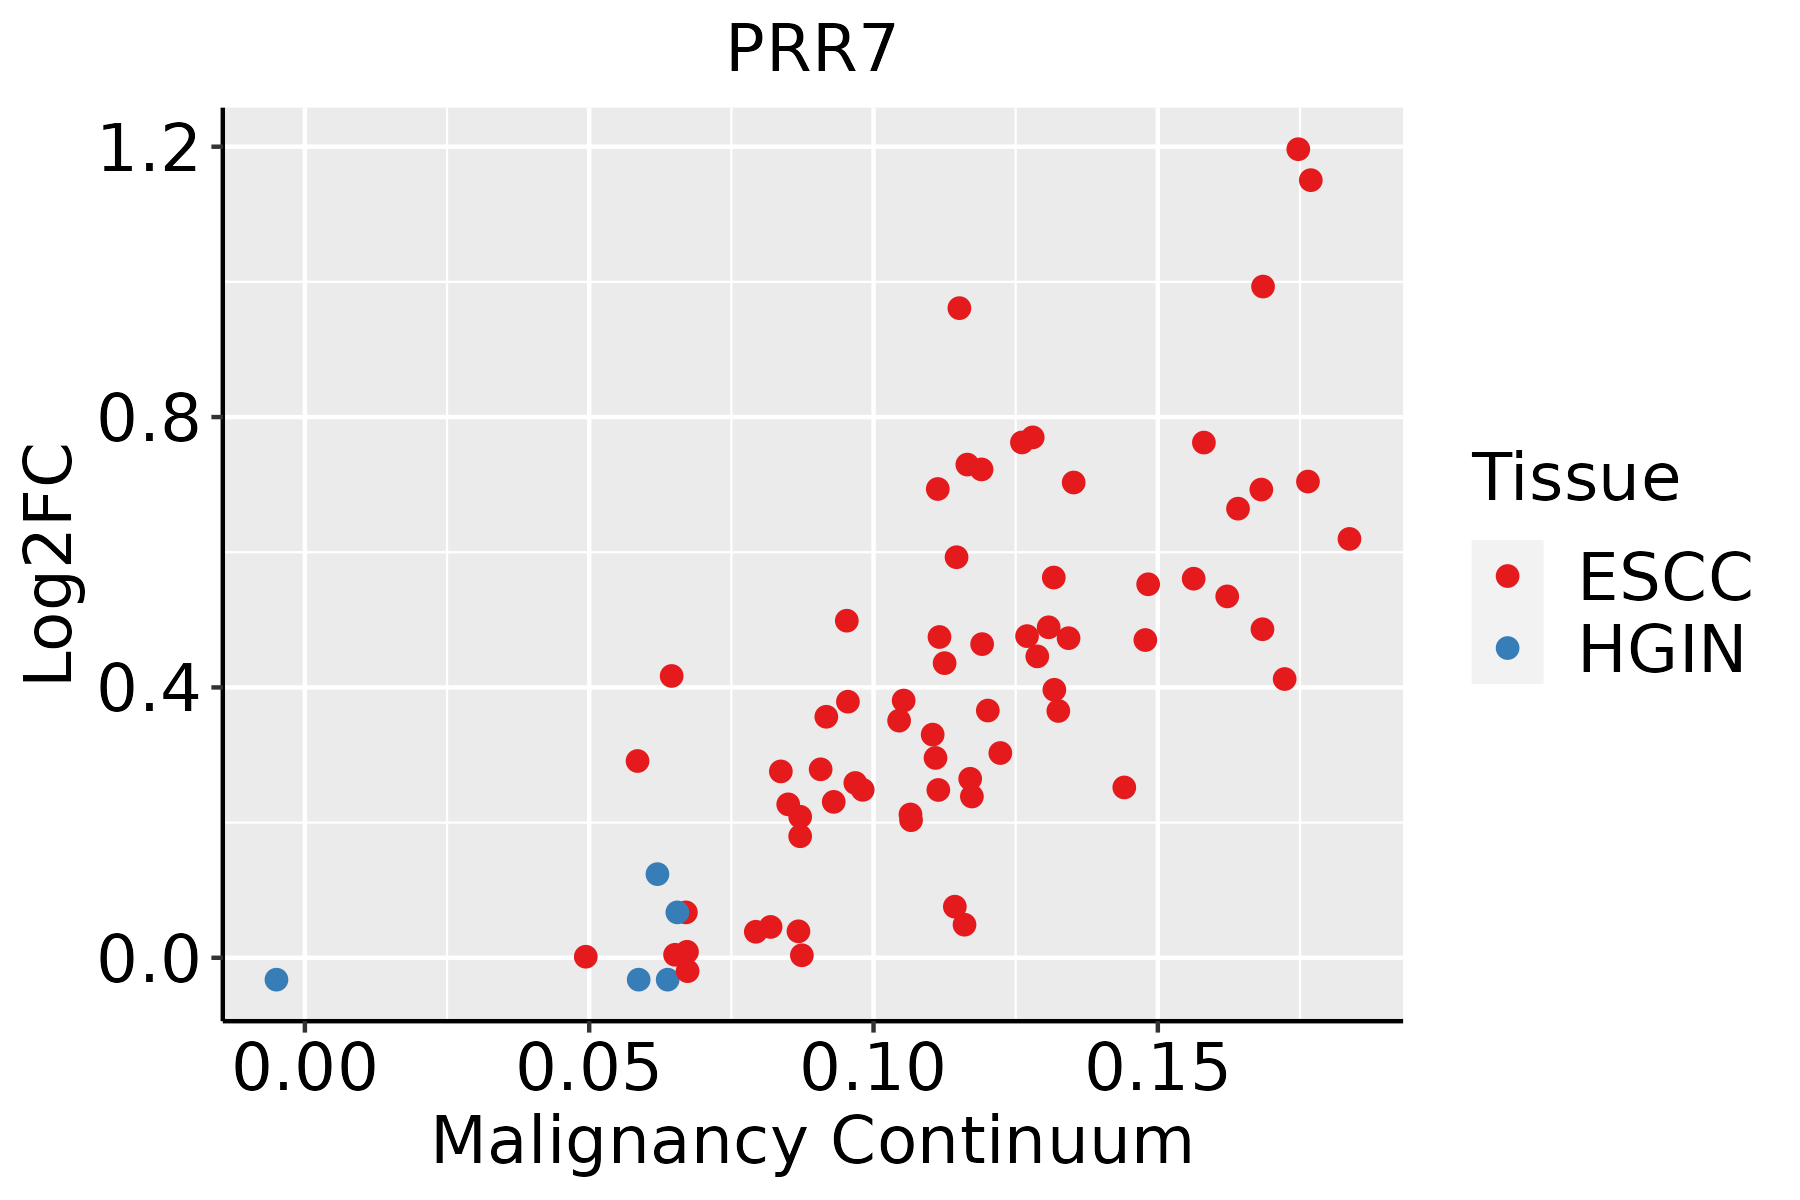 | ESCC: Esophageal squamous cell carcinoma |
| HGIN: High-grade intraepithelial neoplasias | ||
| LGIN: Low-grade intraepithelial neoplasias | ||
| Liver |  | HCC: Hepatocellular carcinoma |
| NAFLD: Non-alcoholic fatty liver disease | ||
| Oral Cavity |  | EOLP: Erosive Oral lichen planus |
| LP: leukoplakia | ||
| NEOLP: Non-erosive oral lichen planus | ||
| OSCC: Oral squamous cell carcinoma | ||
| Skin | 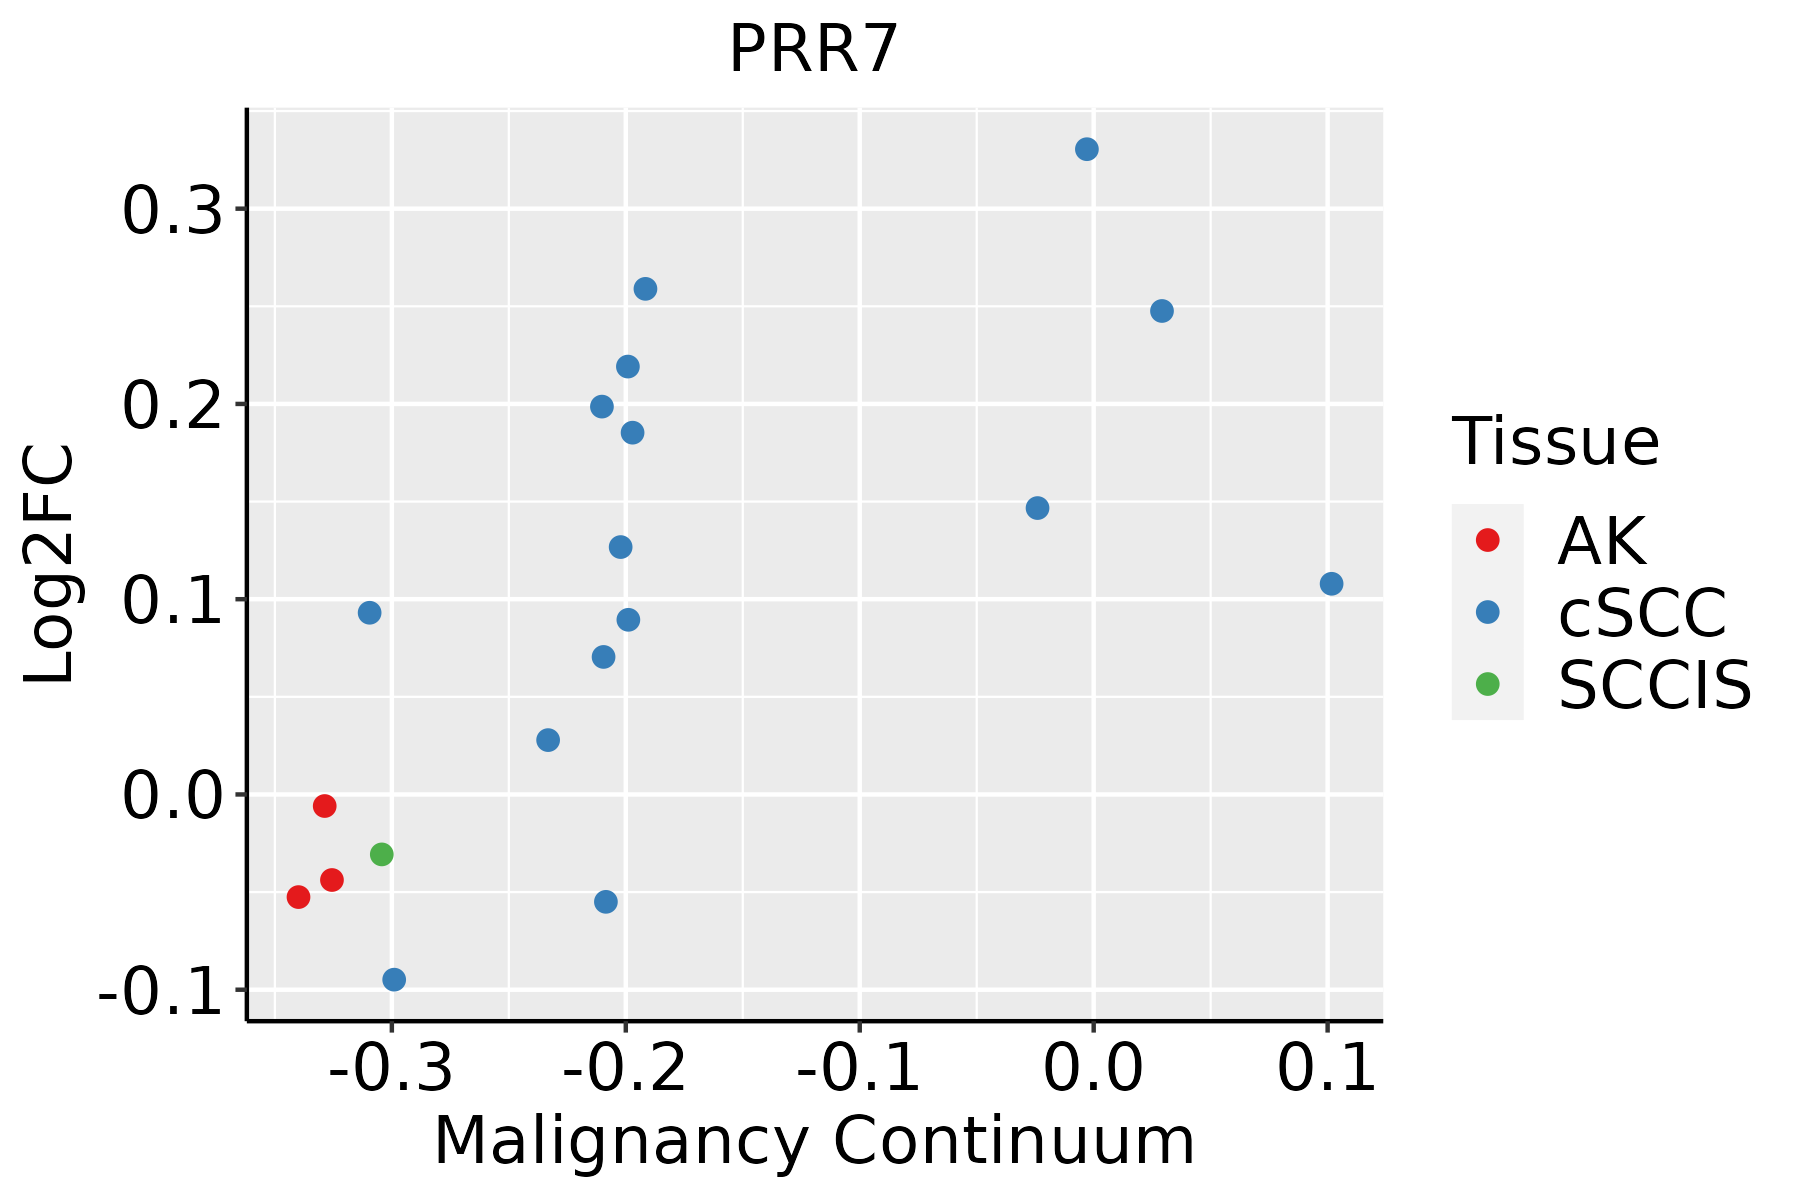 | AK: Actinic keratosis |
| cSCC: Cutaneous squamous cell carcinoma | ||
| SCCIS:squamous cell carcinoma in situ |
| ∗log2FC in expression of this searched gene in stem-like cells from each diseased tissue sample relative to stem-like cells in normal samples in each tissue plotted against the malignancy continuum. Samples are colored based on if they are from different disease stage. |
Top |
Malignant transformation related pathway analysis |
| Find out the enriched GO biological processes and KEGG pathways involved in transition from healthy to precancer to cancer |
| Tissue | Disease Stage | Enriched GO biological Processes |
| Colorectum | AD |  |
| Colorectum | SER |  |
| Colorectum | MSS |  |
| Colorectum | MSI-H |  |
| Colorectum | FAP |  |
| ∗Top 15 enriched GO BP terms are showed in the bar plot of each disease state in each tissue. Each row represents a significant GO biological process which is colored according to the -log10(p.adjust). |
| Page: 1 2 3 4 5 6 7 8 9 |
| GO ID | Tissue | Disease Stage | Description | Gene Ratio | Bg Ratio | pvalue | p.adjust | Count |
| GO:1903320111 | Esophagus | ESCC | regulation of protein modification by small protein conjugation or removal | 181/8552 | 242/18723 | 1.80e-20 | 2.60e-18 | 181 |
| GO:0045862111 | Esophagus | ESCC | positive regulation of proteolysis | 256/8552 | 372/18723 | 7.88e-20 | 9.43e-18 | 256 |
| GO:0031396111 | Esophagus | ESCC | regulation of protein ubiquitination | 154/8552 | 210/18723 | 2.70e-16 | 2.04e-14 | 154 |
| GO:2000116111 | Esophagus | ESCC | regulation of cysteine-type endopeptidase activity | 158/8552 | 235/18723 | 1.67e-11 | 5.90e-10 | 158 |
| GO:0043281111 | Esophagus | ESCC | regulation of cysteine-type endopeptidase activity involved in apoptotic process | 143/8552 | 209/18723 | 2.12e-11 | 7.31e-10 | 143 |
| GO:0010952111 | Esophagus | ESCC | positive regulation of peptidase activity | 133/8552 | 197/18723 | 4.31e-10 | 1.14e-08 | 133 |
| GO:0052547111 | Esophagus | ESCC | regulation of peptidase activity | 275/8552 | 461/18723 | 7.54e-10 | 1.88e-08 | 275 |
| GO:0031397111 | Esophagus | ESCC | negative regulation of protein ubiquitination | 63/8552 | 83/18723 | 1.87e-08 | 3.65e-07 | 63 |
| GO:0052548111 | Esophagus | ESCC | regulation of endopeptidase activity | 253/8552 | 432/18723 | 3.68e-08 | 6.78e-07 | 253 |
| GO:1903321111 | Esophagus | ESCC | negative regulation of protein modification by small protein conjugation or removal | 69/8552 | 95/18723 | 8.54e-08 | 1.44e-06 | 69 |
| GO:0010950111 | Esophagus | ESCC | positive regulation of endopeptidase activity | 116/8552 | 179/18723 | 1.77e-07 | 2.79e-06 | 116 |
| GO:0043280110 | Esophagus | ESCC | positive regulation of cysteine-type endopeptidase activity involved in apoptotic process | 84/8552 | 129/18723 | 6.38e-06 | 6.55e-05 | 84 |
| GO:2001056110 | Esophagus | ESCC | positive regulation of cysteine-type endopeptidase activity | 94/8552 | 148/18723 | 8.87e-06 | 8.59e-05 | 94 |
| GO:20012675 | Esophagus | ESCC | regulation of cysteine-type endopeptidase activity involved in apoptotic signaling pathway | 15/8552 | 16/18723 | 7.15e-05 | 5.38e-04 | 15 |
| GO:004211018 | Esophagus | ESCC | T cell activation | 256/8552 | 487/18723 | 1.18e-03 | 5.87e-03 | 256 |
| GO:19031317 | Esophagus | ESCC | mononuclear cell differentiation | 226/8552 | 426/18723 | 1.20e-03 | 5.88e-03 | 226 |
| GO:2001269 | Esophagus | ESCC | positive regulation of cysteine-type endopeptidase activity involved in apoptotic signaling pathway | 9/8552 | 10/18723 | 5.09e-03 | 1.92e-02 | 9 |
| GO:00302176 | Esophagus | ESCC | T cell differentiation | 137/8552 | 257/18723 | 8.09e-03 | 2.87e-02 | 137 |
| GO:00300984 | Esophagus | ESCC | lymphocyte differentiation | 192/8552 | 374/18723 | 1.52e-02 | 4.93e-02 | 192 |
| GO:004586212 | Liver | Cirrhotic | positive regulation of proteolysis | 163/4634 | 372/18723 | 4.18e-16 | 5.14e-14 | 163 |
| Page: 1 2 3 4 5 |
| Pathway ID | Tissue | Disease Stage | Description | Gene Ratio | Bg Ratio | pvalue | p.adjust | qvalue | Count |
| Page: 1 |
Top |
Cell-cell communication analysis |
| Identification of potential cell-cell interactions between two cell types and their ligand-receptor pairs for different disease states |
| Ligand | Receptor | LRpair | Pathway | Tissue | Disease Stage |
| Page: 1 |
Top |
Single-cell gene regulatory network inference analysis |
| Find out the significant the regulons (TFs) and the target genes of each regulon across cell types for different disease states |
| TF | Cell Type | Tissue | Disease Stage | Target Gene | RSS | Regulon Activity |
| ∗The dot plots of a searched regulon are shown for all cell subpopulations in each disease state of each tissue based on the regulon specific score inferred using pySCENIC and by calculating the average expression. |
| Page: 1 |
Top |
Somatic mutation of malignant transformation related genes |
| Annotation of somatic variants for genes involved in malignant transformation |
| Hugo Symbol | Variant Class | Variant Classification | dbSNP RS | HGVSc | HGVSp | HGVSp Short | SWISSPROT | BIOTYPE | SIFT | PolyPhen | Tumor Sample Barcode | Tissue | Histology | Sex | Age | Stage | Therapy Types | Drugs | Outcome |
| PRR7 | SNV | Missense_Mutation | c.142N>C | p.Glu48Gln | p.E48Q | Q8TB68 | protein_coding | deleterious(0) | probably_damaging(0.999) | TCGA-C5-A1MK-01 | Cervix | cervical & endocervical cancer | Female | >=65 | III/IV | Chemotherapy | carboplatin | PD | |
| PRR7 | SNV | Missense_Mutation | novel | c.710N>A | p.Arg237His | p.R237H | Q8TB68 | protein_coding | deleterious(0.03) | benign(0.32) | TCGA-85-8354-01 | Lung | lung squamous cell carcinoma | Male | <65 | I/II | Unknown | Unknown | SD |
| PRR7 | SNV | Missense_Mutation | novel | c.661N>T | p.Arg221Trp | p.R221W | Q8TB68 | protein_coding | deleterious(0) | benign(0.378) | TCGA-94-7943-01 | Lung | lung squamous cell carcinoma | Male | >=65 | I/II | Unknown | Unknown | PD |
| PRR7 | SNV | Missense_Mutation | novel | c.608C>A | p.Pro203Gln | p.P203Q | Q8TB68 | protein_coding | deleterious(0.01) | benign(0.015) | TCGA-CR-7390-01 | Oral cavity | head & neck squamous cell carcinoma | Male | >=65 | I/II | Unknown | Unknown | SD |
| PRR7 | SNV | Missense_Mutation | novel | c.502N>A | p.Glu168Lys | p.E168K | Q8TB68 | protein_coding | deleterious(0) | possibly_damaging(0.689) | TCGA-T2-A6X2-01 | Oral cavity | head & neck squamous cell carcinoma | Male | >=65 | III/IV | Unknown | Unknown | SD |
| PRR7 | SNV | Missense_Mutation | novel | c.38N>T | p.Cys13Phe | p.C13F | Q8TB68 | protein_coding | deleterious(0) | probably_damaging(0.97) | TCGA-D7-A6EV-01 | Stomach | stomach adenocarcinoma | Female | >=65 | I/II | Unknown | Unknown | SD |
| Page: 1 |
Top |
Related drugs of malignant transformation related genes |
| Identification of chemicals and drugs interact with genes involved in malignant transfromation |
| (DGIdb 4.0) |
| Entrez ID | Symbol | Category | Interaction Types | Drug Claim Name | Drug Name | PMIDs |
| Page: 1 |

Copyright 2023-Present -The University of Texas Health Science Center at Houston |