
|
|||||
|
 | |
| |
| |
| |
| |
| |
|
Gene: PRR5L |
Gene summary for PRR5L |
| Gene information | Species | Human | Gene symbol | PRR5L | Gene ID | 79899 |
| Gene name | proline rich 5 like | |
| Gene Alias | PROTOR2 | |
| Cytomap | 11p13-p12 | |
| Gene Type | protein-coding | GO ID | GO:0001667 | UniProtAcc | B3KNU3 |
Top |
Malignant transformation analysis |
| Identification of the aberrant gene expression in precancerous and cancerous lesions by comparing the gene expression of stem-like cells in diseased tissues with normal stem cells |
| Entrez ID | Symbol | Replicates | Species | Organ | Tissue | Adj P-value | Log2FC | Malignancy |
| 79899 | PRR5L | HTA11_3410_2000001011 | Human | Colorectum | AD | 6.90e-10 | -5.55e-01 | 0.0155 |
| 79899 | PRR5L | HTA11_347_2000001011 | Human | Colorectum | AD | 4.07e-15 | 7.35e-01 | -0.1954 |
| 79899 | PRR5L | HTA11_866_3004761011 | Human | Colorectum | AD | 3.25e-03 | -4.51e-01 | 0.096 |
| 79899 | PRR5L | HTA11_7696_3000711011 | Human | Colorectum | AD | 4.16e-11 | -5.07e-01 | 0.0674 |
| 79899 | PRR5L | HTA11_99999970781_79442 | Human | Colorectum | MSS | 1.78e-03 | -3.19e-01 | 0.294 |
| 79899 | PRR5L | HTA11_99999974143_84620 | Human | Colorectum | MSS | 7.66e-13 | -5.17e-01 | 0.3005 |
| 79899 | PRR5L | A015-C-203 | Human | Colorectum | FAP | 7.49e-22 | -4.74e-01 | -0.1294 |
| 79899 | PRR5L | A015-C-204 | Human | Colorectum | FAP | 2.67e-03 | -2.73e-01 | -0.0228 |
| 79899 | PRR5L | A002-C-201 | Human | Colorectum | FAP | 6.14e-08 | -3.79e-01 | 0.0324 |
| 79899 | PRR5L | A001-C-119 | Human | Colorectum | FAP | 1.14e-12 | -6.26e-01 | -0.1557 |
| 79899 | PRR5L | A001-C-108 | Human | Colorectum | FAP | 9.09e-12 | -3.55e-01 | -0.0272 |
| 79899 | PRR5L | A002-C-205 | Human | Colorectum | FAP | 5.74e-14 | -4.11e-01 | -0.1236 |
| 79899 | PRR5L | A001-C-104 | Human | Colorectum | FAP | 6.24e-03 | -2.93e-01 | 0.0184 |
| 79899 | PRR5L | A015-C-005 | Human | Colorectum | FAP | 1.23e-04 | -3.95e-01 | -0.0336 |
| 79899 | PRR5L | A015-C-006 | Human | Colorectum | FAP | 6.47e-14 | -6.01e-01 | -0.0994 |
| 79899 | PRR5L | A015-C-106 | Human | Colorectum | FAP | 2.06e-08 | -3.34e-01 | -0.0511 |
| 79899 | PRR5L | A002-C-114 | Human | Colorectum | FAP | 1.84e-13 | -4.64e-01 | -0.1561 |
| 79899 | PRR5L | A015-C-104 | Human | Colorectum | FAP | 4.31e-23 | -4.61e-01 | -0.1899 |
| 79899 | PRR5L | A001-C-014 | Human | Colorectum | FAP | 2.28e-12 | -3.62e-01 | 0.0135 |
| 79899 | PRR5L | A002-C-016 | Human | Colorectum | FAP | 5.14e-14 | -3.25e-01 | 0.0521 |
| Page: 1 2 |
| Tissue | Expression Dynamics | Abbreviation |
| Colorectum (GSE201348) | 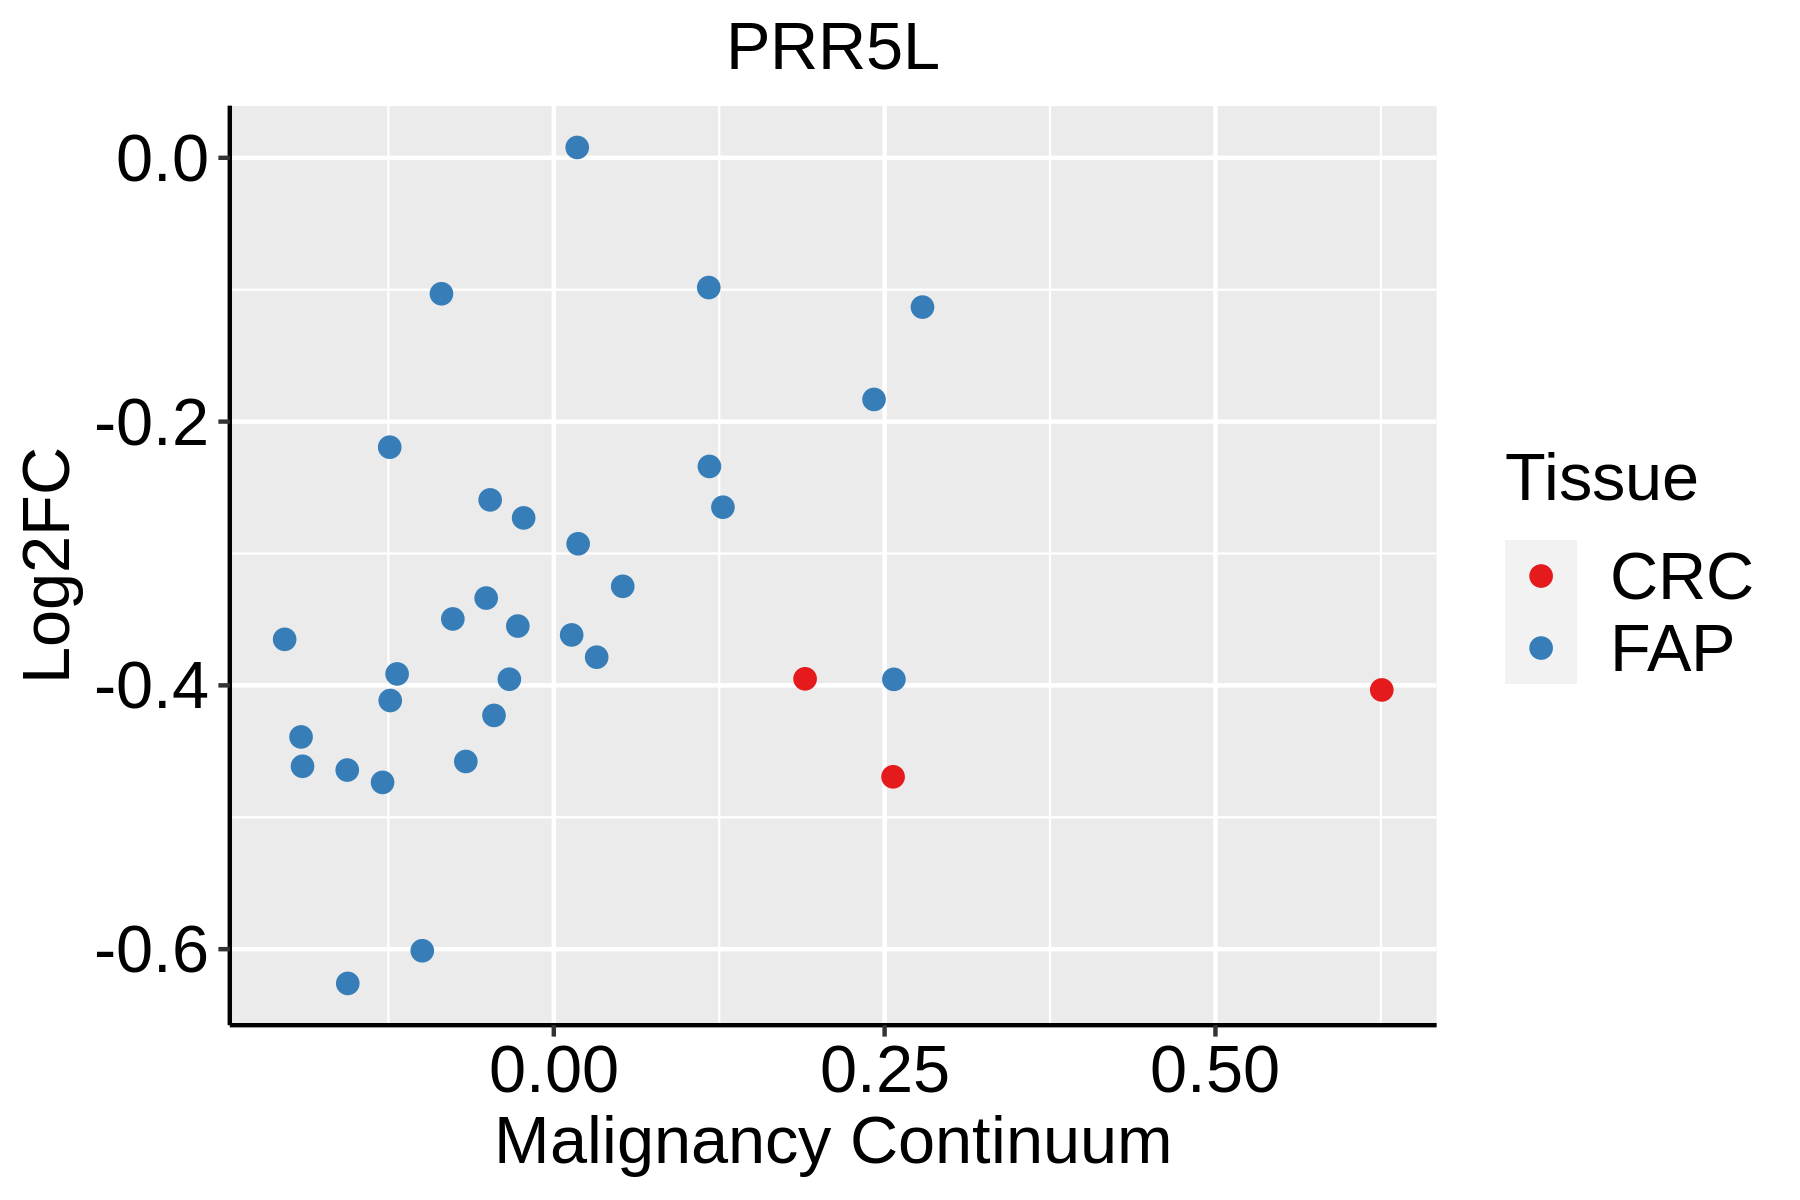 | FAP: Familial adenomatous polyposis |
| CRC: Colorectal cancer | ||
| Colorectum (HTA11) | 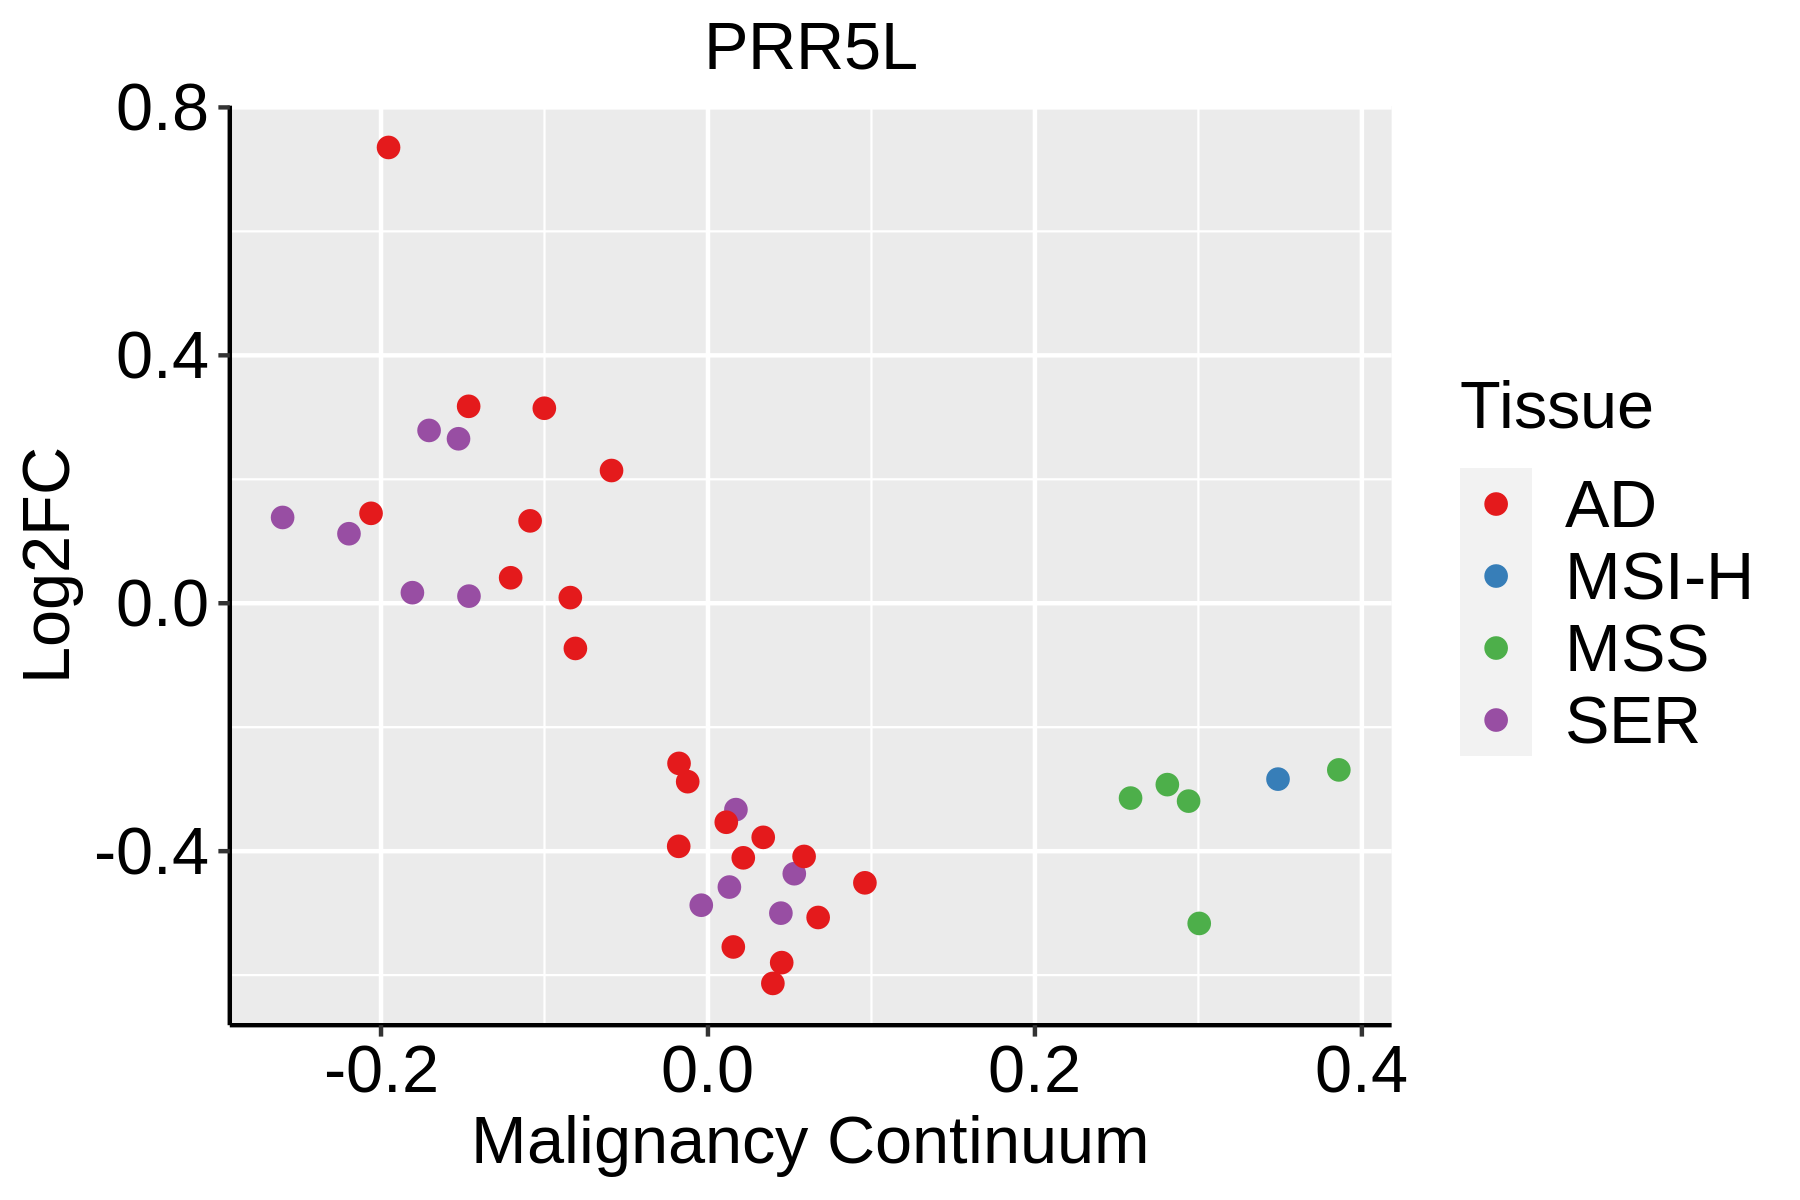 | AD: Adenomas |
| SER: Sessile serrated lesions | ||
| MSI-H: Microsatellite-high colorectal cancer | ||
| MSS: Microsatellite stable colorectal cancer | ||
| Oral Cavity |  | EOLP: Erosive Oral lichen planus |
| LP: leukoplakia | ||
| NEOLP: Non-erosive oral lichen planus | ||
| OSCC: Oral squamous cell carcinoma |
| ∗log2FC in expression of this searched gene in stem-like cells from each diseased tissue sample relative to stem-like cells in normal samples in each tissue plotted against the malignancy continuum. Samples are colored based on if they are from different disease stage. |
Top |
Malignant transformation related pathway analysis |
| Find out the enriched GO biological processes and KEGG pathways involved in transition from healthy to precancer to cancer |
| Tissue | Disease Stage | Enriched GO biological Processes |
| Colorectum | AD |  |
| Colorectum | SER |  |
| Colorectum | MSS |  |
| Colorectum | MSI-H |  |
| Colorectum | FAP |  |
| ∗Top 15 enriched GO BP terms are showed in the bar plot of each disease state in each tissue. Each row represents a significant GO biological process which is colored according to the -log10(p.adjust). |
| Page: 1 2 3 4 5 6 7 8 9 |
| GO ID | Tissue | Disease Stage | Description | Gene Ratio | Bg Ratio | pvalue | p.adjust | Count |
| GO:0009896 | Colorectum | AD | positive regulation of catabolic process | 180/3918 | 492/18723 | 4.33e-16 | 1.94e-13 | 180 |
| GO:1903311 | Colorectum | AD | regulation of mRNA metabolic process | 117/3918 | 288/18723 | 1.69e-14 | 4.23e-12 | 117 |
| GO:0031331 | Colorectum | AD | positive regulation of cellular catabolic process | 156/3918 | 427/18723 | 4.68e-14 | 1.05e-11 | 156 |
| GO:0006401 | Colorectum | AD | RNA catabolic process | 102/3918 | 278/18723 | 8.64e-10 | 6.76e-08 | 102 |
| GO:1904951 | Colorectum | AD | positive regulation of establishment of protein localization | 112/3918 | 319/18723 | 2.55e-09 | 1.80e-07 | 112 |
| GO:0044270 | Colorectum | AD | cellular nitrogen compound catabolic process | 147/3918 | 451/18723 | 3.35e-09 | 2.23e-07 | 147 |
| GO:0046700 | Colorectum | AD | heterocycle catabolic process | 145/3918 | 445/18723 | 4.37e-09 | 2.84e-07 | 145 |
| GO:0006402 | Colorectum | AD | mRNA catabolic process | 87/3918 | 232/18723 | 4.40e-09 | 2.84e-07 | 87 |
| GO:0006979 | Colorectum | AD | response to oxidative stress | 145/3918 | 446/18723 | 5.16e-09 | 3.23e-07 | 145 |
| GO:0051222 | Colorectum | AD | positive regulation of protein transport | 106/3918 | 303/18723 | 8.45e-09 | 5.08e-07 | 106 |
| GO:0034655 | Colorectum | AD | nucleobase-containing compound catabolic process | 133/3918 | 407/18723 | 1.56e-08 | 9.12e-07 | 133 |
| GO:0019439 | Colorectum | AD | aromatic compound catabolic process | 146/3918 | 467/18723 | 7.48e-08 | 3.84e-06 | 146 |
| GO:1901361 | Colorectum | AD | organic cyclic compound catabolic process | 153/3918 | 495/18723 | 8.23e-08 | 4.18e-06 | 153 |
| GO:0061013 | Colorectum | AD | regulation of mRNA catabolic process | 64/3918 | 166/18723 | 1.44e-07 | 6.59e-06 | 64 |
| GO:0090316 | Colorectum | AD | positive regulation of intracellular protein transport | 62/3918 | 160/18723 | 1.82e-07 | 7.79e-06 | 62 |
| GO:0032388 | Colorectum | AD | positive regulation of intracellular transport | 74/3918 | 202/18723 | 1.83e-07 | 7.80e-06 | 74 |
| GO:0032386 | Colorectum | AD | regulation of intracellular transport | 109/3918 | 337/18723 | 5.33e-07 | 1.95e-05 | 109 |
| GO:0062197 | Colorectum | AD | cellular response to chemical stress | 109/3918 | 337/18723 | 5.33e-07 | 1.95e-05 | 109 |
| GO:0033157 | Colorectum | AD | regulation of intracellular protein transport | 80/3918 | 229/18723 | 5.81e-07 | 2.09e-05 | 80 |
| GO:0034599 | Colorectum | AD | cellular response to oxidative stress | 94/3918 | 288/18723 | 2.03e-06 | 6.02e-05 | 94 |
| Page: 1 2 3 4 5 6 7 8 |
| Pathway ID | Tissue | Disease Stage | Description | Gene Ratio | Bg Ratio | pvalue | p.adjust | qvalue | Count |
| hsa04150 | Colorectum | MSS | mTOR signaling pathway | 47/1875 | 156/8465 | 1.19e-02 | 3.99e-02 | 2.44e-02 | 47 |
| hsa041501 | Colorectum | MSS | mTOR signaling pathway | 47/1875 | 156/8465 | 1.19e-02 | 3.99e-02 | 2.44e-02 | 47 |
| hsa041504 | Oral cavity | OSCC | mTOR signaling pathway | 90/3704 | 156/8465 | 2.87e-04 | 9.15e-04 | 4.66e-04 | 90 |
| hsa0415012 | Oral cavity | OSCC | mTOR signaling pathway | 90/3704 | 156/8465 | 2.87e-04 | 9.15e-04 | 4.66e-04 | 90 |
| Page: 1 |
Top |
Cell-cell communication analysis |
| Identification of potential cell-cell interactions between two cell types and their ligand-receptor pairs for different disease states |
| Ligand | Receptor | LRpair | Pathway | Tissue | Disease Stage |
| Page: 1 |
Top |
Single-cell gene regulatory network inference analysis |
| Find out the significant the regulons (TFs) and the target genes of each regulon across cell types for different disease states |
| TF | Cell Type | Tissue | Disease Stage | Target Gene | RSS | Regulon Activity |
| ∗The dot plots of a searched regulon are shown for all cell subpopulations in each disease state of each tissue based on the regulon specific score inferred using pySCENIC and by calculating the average expression. |
| Page: 1 |
Top |
Somatic mutation of malignant transformation related genes |
| Annotation of somatic variants for genes involved in malignant transformation |
| Hugo Symbol | Variant Class | Variant Classification | dbSNP RS | HGVSc | HGVSp | HGVSp Short | SWISSPROT | BIOTYPE | SIFT | PolyPhen | Tumor Sample Barcode | Tissue | Histology | Sex | Age | Stage | Therapy Types | Drugs | Outcome |
| PRR5L | SNV | Missense_Mutation | c.652N>A | p.Val218Ile | p.V218I | Q6MZQ0 | protein_coding | tolerated(0.13) | benign(0.015) | TCGA-A2-A0CX-01 | Breast | breast invasive carcinoma | Female | <65 | I/II | Chemotherapy | adriamycin | SD | |
| PRR5L | SNV | Missense_Mutation | novel | c.658C>G | p.Pro220Ala | p.P220A | Q6MZQ0 | protein_coding | deleterious(0) | probably_damaging(0.996) | TCGA-AC-A5XS-01 | Breast | breast invasive carcinoma | Female | >=65 | I/II | Hormone Therapy | femara | SD |
| PRR5L | insertion | Frame_Shift_Ins | novel | c.309_310insGATAGTGTGTGCTG | p.Lys104AspfsTer5 | p.K104Dfs*5 | Q6MZQ0 | protein_coding | TCGA-AO-A03R-01 | Breast | breast invasive carcinoma | Female | <65 | I/II | Chemotherapy | doxorubicin | SD | ||
| PRR5L | insertion | Nonsense_Mutation | novel | c.311_312insTAAAACATGAGTAGTAGAGAGACTG | p.Lys104AsnfsTer4 | p.K104Nfs*4 | Q6MZQ0 | protein_coding | TCGA-AO-A03R-01 | Breast | breast invasive carcinoma | Female | <65 | I/II | Chemotherapy | doxorubicin | SD | ||
| PRR5L | SNV | Missense_Mutation | rs775976935 | c.464N>A | p.Arg155His | p.R155H | Q6MZQ0 | protein_coding | deleterious(0) | probably_damaging(0.999) | TCGA-2W-A8YY-01 | Cervix | cervical & endocervical cancer | Female | <65 | I/II | Chemotherapy | cisplatin | CR |
| PRR5L | SNV | Missense_Mutation | rs749777257 | c.719N>A | p.Arg240Gln | p.R240Q | Q6MZQ0 | protein_coding | deleterious(0.03) | probably_damaging(0.994) | TCGA-2W-A8YY-01 | Cervix | cervical & endocervical cancer | Female | <65 | I/II | Chemotherapy | cisplatin | CR |
| PRR5L | SNV | Missense_Mutation | c.592N>T | p.His198Tyr | p.H198Y | Q6MZQ0 | protein_coding | deleterious(0) | probably_damaging(0.99) | TCGA-DR-A0ZM-01 | Cervix | cervical & endocervical cancer | Female | <65 | III/IV | Unspecific | Cisplatin | SD | |
| PRR5L | SNV | Missense_Mutation | rs149927791 | c.235G>A | p.Glu79Lys | p.E79K | Q6MZQ0 | protein_coding | deleterious(0.05) | possibly_damaging(0.483) | TCGA-EK-A3GJ-01 | Cervix | cervical & endocervical cancer | Female | <65 | I/II | Unknown | Unknown | SD |
| PRR5L | SNV | Missense_Mutation | rs149927791 | c.235N>A | p.Glu79Lys | p.E79K | Q6MZQ0 | protein_coding | deleterious(0.05) | possibly_damaging(0.483) | TCGA-A6-2672-01 | Colorectum | colon adenocarcinoma | Female | >=65 | III/IV | Unknown | Unknown | SD |
| PRR5L | SNV | Missense_Mutation | rs751977077 | c.361N>T | p.Arg121Cys | p.R121C | Q6MZQ0 | protein_coding | tolerated(0.09) | probably_damaging(0.999) | TCGA-AA-3685-01 | Colorectum | colon adenocarcinoma | Male | >=65 | I/II | Unknown | Unknown | SD |
| Page: 1 2 3 4 5 |
Top |
Related drugs of malignant transformation related genes |
| Identification of chemicals and drugs interact with genes involved in malignant transfromation |
| (DGIdb 4.0) |
| Entrez ID | Symbol | Category | Interaction Types | Drug Claim Name | Drug Name | PMIDs |
| Page: 1 |

Copyright 2023-Present -The University of Texas Health Science Center at Houston |