
|
|||||
|
 | |
| |
| |
| |
| |
| |
|
Gene: PRR5 |
Gene summary for PRR5 |
| Gene information | Species | Human | Gene symbol | PRR5 | Gene ID | 55615 |
| Gene name | proline rich 5 | |
| Gene Alias | FLJ20185k | |
| Cytomap | 22q13.31 | |
| Gene Type | protein-coding | GO ID | GO:0001932 | UniProtAcc | A0A024R4U5 |
Top |
Malignant transformation analysis |
| Identification of the aberrant gene expression in precancerous and cancerous lesions by comparing the gene expression of stem-like cells in diseased tissues with normal stem cells |
| Entrez ID | Symbol | Replicates | Species | Organ | Tissue | Adj P-value | Log2FC | Malignancy |
| 55615 | PRR5 | LZE7T | Human | Esophagus | ESCC | 6.13e-07 | 2.37e-01 | 0.0667 |
| 55615 | PRR5 | LZE24T | Human | Esophagus | ESCC | 1.46e-02 | 7.68e-02 | 0.0596 |
| 55615 | PRR5 | LZE21T | Human | Esophagus | ESCC | 6.52e-03 | 1.77e-01 | 0.0655 |
| 55615 | PRR5 | P2T-E | Human | Esophagus | ESCC | 2.99e-08 | 1.15e-01 | 0.1177 |
| 55615 | PRR5 | P4T-E | Human | Esophagus | ESCC | 5.16e-10 | 2.06e-01 | 0.1323 |
| 55615 | PRR5 | P5T-E | Human | Esophagus | ESCC | 3.67e-06 | 1.68e-01 | 0.1327 |
| 55615 | PRR5 | P8T-E | Human | Esophagus | ESCC | 2.52e-02 | 2.09e-02 | 0.0889 |
| 55615 | PRR5 | P9T-E | Human | Esophagus | ESCC | 6.89e-11 | 2.54e-01 | 0.1131 |
| 55615 | PRR5 | P10T-E | Human | Esophagus | ESCC | 1.08e-09 | 1.36e-01 | 0.116 |
| 55615 | PRR5 | P11T-E | Human | Esophagus | ESCC | 1.72e-04 | 1.48e-01 | 0.1426 |
| 55615 | PRR5 | P12T-E | Human | Esophagus | ESCC | 2.06e-05 | 7.63e-02 | 0.1122 |
| 55615 | PRR5 | P15T-E | Human | Esophagus | ESCC | 1.16e-16 | 3.06e-01 | 0.1149 |
| 55615 | PRR5 | P17T-E | Human | Esophagus | ESCC | 2.68e-03 | 1.28e-01 | 0.1278 |
| 55615 | PRR5 | P21T-E | Human | Esophagus | ESCC | 9.55e-07 | 1.56e-01 | 0.1617 |
| 55615 | PRR5 | P22T-E | Human | Esophagus | ESCC | 2.65e-13 | 2.31e-01 | 0.1236 |
| 55615 | PRR5 | P23T-E | Human | Esophagus | ESCC | 6.53e-09 | 1.85e-01 | 0.108 |
| 55615 | PRR5 | P24T-E | Human | Esophagus | ESCC | 8.66e-10 | 5.23e-02 | 0.1287 |
| 55615 | PRR5 | P26T-E | Human | Esophagus | ESCC | 1.13e-05 | 1.24e-01 | 0.1276 |
| 55615 | PRR5 | P27T-E | Human | Esophagus | ESCC | 2.70e-13 | 4.85e-02 | 0.1055 |
| 55615 | PRR5 | P28T-E | Human | Esophagus | ESCC | 4.61e-19 | 3.42e-01 | 0.1149 |
| Page: 1 2 3 4 |
| Tissue | Expression Dynamics | Abbreviation |
| Esophagus |  | ESCC: Esophageal squamous cell carcinoma |
| HGIN: High-grade intraepithelial neoplasias | ||
| LGIN: Low-grade intraepithelial neoplasias | ||
| Liver |  | HCC: Hepatocellular carcinoma |
| NAFLD: Non-alcoholic fatty liver disease | ||
| Oral Cavity |  | EOLP: Erosive Oral lichen planus |
| LP: leukoplakia | ||
| NEOLP: Non-erosive oral lichen planus | ||
| OSCC: Oral squamous cell carcinoma | ||
| Thyroid | 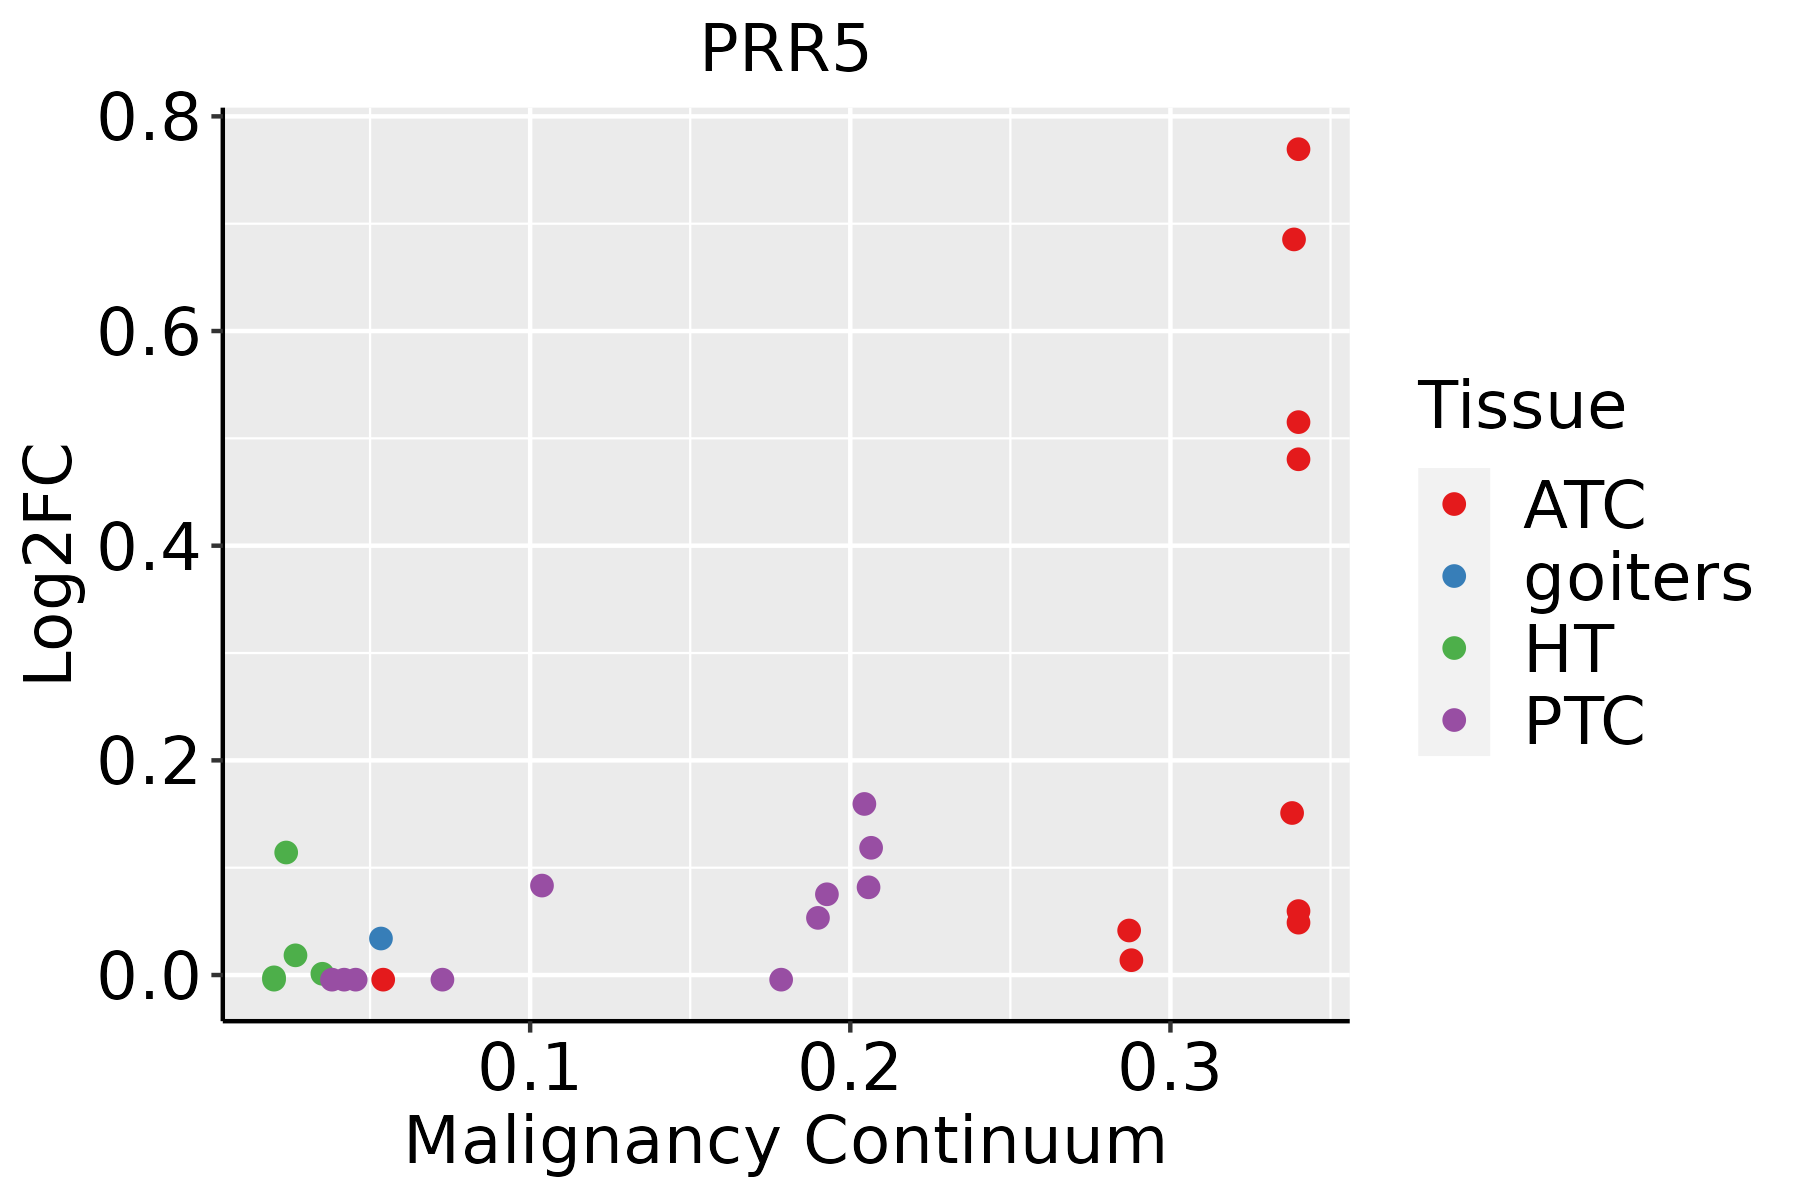 | ATC: Anaplastic thyroid cancer |
| HT: Hashimoto's thyroiditis | ||
| PTC: Papillary thyroid cancer |
| ∗log2FC in expression of this searched gene in stem-like cells from each diseased tissue sample relative to stem-like cells in normal samples in each tissue plotted against the malignancy continuum. Samples are colored based on if they are from different disease stage. |
Top |
Malignant transformation related pathway analysis |
| Find out the enriched GO biological processes and KEGG pathways involved in transition from healthy to precancer to cancer |
| Tissue | Disease Stage | Enriched GO biological Processes |
| Colorectum | AD |  |
| Colorectum | SER |  |
| Colorectum | MSS |  |
| Colorectum | MSI-H |  |
| Colorectum | FAP |  |
| ∗Top 15 enriched GO BP terms are showed in the bar plot of each disease state in each tissue. Each row represents a significant GO biological process which is colored according to the -log10(p.adjust). |
| Page: 1 2 3 4 5 6 7 8 9 |
| GO ID | Tissue | Disease Stage | Description | Gene Ratio | Bg Ratio | pvalue | p.adjust | Count |
| GO:0009896 | Colorectum | AD | positive regulation of catabolic process | 180/3918 | 492/18723 | 4.33e-16 | 1.94e-13 | 180 |
| GO:1903311 | Colorectum | AD | regulation of mRNA metabolic process | 117/3918 | 288/18723 | 1.69e-14 | 4.23e-12 | 117 |
| GO:0031331 | Colorectum | AD | positive regulation of cellular catabolic process | 156/3918 | 427/18723 | 4.68e-14 | 1.05e-11 | 156 |
| GO:0006401 | Colorectum | AD | RNA catabolic process | 102/3918 | 278/18723 | 8.64e-10 | 6.76e-08 | 102 |
| GO:1904951 | Colorectum | AD | positive regulation of establishment of protein localization | 112/3918 | 319/18723 | 2.55e-09 | 1.80e-07 | 112 |
| GO:0044270 | Colorectum | AD | cellular nitrogen compound catabolic process | 147/3918 | 451/18723 | 3.35e-09 | 2.23e-07 | 147 |
| GO:0046700 | Colorectum | AD | heterocycle catabolic process | 145/3918 | 445/18723 | 4.37e-09 | 2.84e-07 | 145 |
| GO:0006402 | Colorectum | AD | mRNA catabolic process | 87/3918 | 232/18723 | 4.40e-09 | 2.84e-07 | 87 |
| GO:0006979 | Colorectum | AD | response to oxidative stress | 145/3918 | 446/18723 | 5.16e-09 | 3.23e-07 | 145 |
| GO:0051222 | Colorectum | AD | positive regulation of protein transport | 106/3918 | 303/18723 | 8.45e-09 | 5.08e-07 | 106 |
| GO:0034655 | Colorectum | AD | nucleobase-containing compound catabolic process | 133/3918 | 407/18723 | 1.56e-08 | 9.12e-07 | 133 |
| GO:0019439 | Colorectum | AD | aromatic compound catabolic process | 146/3918 | 467/18723 | 7.48e-08 | 3.84e-06 | 146 |
| GO:1901361 | Colorectum | AD | organic cyclic compound catabolic process | 153/3918 | 495/18723 | 8.23e-08 | 4.18e-06 | 153 |
| GO:0061013 | Colorectum | AD | regulation of mRNA catabolic process | 64/3918 | 166/18723 | 1.44e-07 | 6.59e-06 | 64 |
| GO:0090316 | Colorectum | AD | positive regulation of intracellular protein transport | 62/3918 | 160/18723 | 1.82e-07 | 7.79e-06 | 62 |
| GO:0032388 | Colorectum | AD | positive regulation of intracellular transport | 74/3918 | 202/18723 | 1.83e-07 | 7.80e-06 | 74 |
| GO:0032386 | Colorectum | AD | regulation of intracellular transport | 109/3918 | 337/18723 | 5.33e-07 | 1.95e-05 | 109 |
| GO:0062197 | Colorectum | AD | cellular response to chemical stress | 109/3918 | 337/18723 | 5.33e-07 | 1.95e-05 | 109 |
| GO:0033157 | Colorectum | AD | regulation of intracellular protein transport | 80/3918 | 229/18723 | 5.81e-07 | 2.09e-05 | 80 |
| GO:0034599 | Colorectum | AD | cellular response to oxidative stress | 94/3918 | 288/18723 | 2.03e-06 | 6.02e-05 | 94 |
| Page: 1 2 3 4 5 6 7 8 |
| Pathway ID | Tissue | Disease Stage | Description | Gene Ratio | Bg Ratio | pvalue | p.adjust | qvalue | Count |
| hsa041505 | Esophagus | ESCC | mTOR signaling pathway | 98/4205 | 156/8465 | 5.81e-04 | 1.95e-03 | 9.97e-04 | 98 |
| hsa0415013 | Esophagus | ESCC | mTOR signaling pathway | 98/4205 | 156/8465 | 5.81e-04 | 1.95e-03 | 9.97e-04 | 98 |
| hsa041502 | Liver | HCC | mTOR signaling pathway | 95/4020 | 156/8465 | 4.70e-04 | 1.99e-03 | 1.11e-03 | 95 |
| hsa0415011 | Liver | HCC | mTOR signaling pathway | 95/4020 | 156/8465 | 4.70e-04 | 1.99e-03 | 1.11e-03 | 95 |
| hsa041504 | Oral cavity | OSCC | mTOR signaling pathway | 90/3704 | 156/8465 | 2.87e-04 | 9.15e-04 | 4.66e-04 | 90 |
| hsa0415012 | Oral cavity | OSCC | mTOR signaling pathway | 90/3704 | 156/8465 | 2.87e-04 | 9.15e-04 | 4.66e-04 | 90 |
| Page: 1 |
Top |
Cell-cell communication analysis |
| Identification of potential cell-cell interactions between two cell types and their ligand-receptor pairs for different disease states |
| Ligand | Receptor | LRpair | Pathway | Tissue | Disease Stage |
| Page: 1 |
Top |
Single-cell gene regulatory network inference analysis |
| Find out the significant the regulons (TFs) and the target genes of each regulon across cell types for different disease states |
| TF | Cell Type | Tissue | Disease Stage | Target Gene | RSS | Regulon Activity |
| ∗The dot plots of a searched regulon are shown for all cell subpopulations in each disease state of each tissue based on the regulon specific score inferred using pySCENIC and by calculating the average expression. |
| Page: 1 |
Top |
Somatic mutation of malignant transformation related genes |
| Annotation of somatic variants for genes involved in malignant transformation |
| Hugo Symbol | Variant Class | Variant Classification | dbSNP RS | HGVSc | HGVSp | HGVSp Short | SWISSPROT | BIOTYPE | SIFT | PolyPhen | Tumor Sample Barcode | Tissue | Histology | Sex | Age | Stage | Therapy Types | Drugs | Outcome |
| PRR5 | SNV | Missense_Mutation | novel | c.601N>T | p.Val201Leu | p.V201L | P85299 | protein_coding | tolerated(0.07) | benign(0.037) | TCGA-A2-A4S3-01 | Breast | breast invasive carcinoma | Female | <65 | I/II | Unknown | Unknown | SD |
| PRR5 | SNV | Missense_Mutation | rs368755171 | c.50N>T | p.Pro17Leu | p.P17L | P85299 | protein_coding | deleterious_low_confidence(0.01) | benign(0) | TCGA-AO-A03P-01 | Breast | breast invasive carcinoma | Female | <65 | I/II | Hormone Therapy | letrozole | PD |
| PRR5 | SNV | Missense_Mutation | rs767369731 | c.772N>T | p.Leu258Phe | p.L258F | P85299 | protein_coding | tolerated(0.56) | benign(0.001) | TCGA-JW-A5VL-01 | Cervix | cervical & endocervical cancer | Female | <65 | I/II | Unknown | Unknown | SD |
| PRR5 | SNV | Missense_Mutation | c.556N>C | p.Glu186Gln | p.E186Q | P85299 | protein_coding | deleterious(0.02) | possibly_damaging(0.741) | TCGA-Q1-A73O-01 | Cervix | cervical & endocervical cancer | Female | <65 | I/II | Chemotherapy | cisplatin | CR | |
| PRR5 | SNV | Missense_Mutation | rs752935264 | c.502N>T | p.Arg168Cys | p.R168C | P85299 | protein_coding | deleterious(0) | probably_damaging(0.995) | TCGA-VS-A9U6-01 | Cervix | cervical & endocervical cancer | Female | <65 | I/II | Chemotherapy | cisplatin | PD |
| PRR5 | SNV | Missense_Mutation | rs747179688 | c.280N>A | p.Val94Ile | p.V94I | P85299 | protein_coding | tolerated(0.45) | benign(0.049) | TCGA-AA-3950-01 | Colorectum | colon adenocarcinoma | Female | >=65 | I/II | Unknown | Unknown | SD |
| PRR5 | SNV | Missense_Mutation | rs368755171 | c.50N>T | p.Pro17Leu | p.P17L | P85299 | protein_coding | deleterious_low_confidence(0.01) | benign(0) | TCGA-CM-6171-01 | Colorectum | colon adenocarcinoma | Female | >=65 | I/II | Unknown | Unknown | SD |
| PRR5 | SNV | Missense_Mutation | rs760293496 | c.583N>T | p.Arg195Cys | p.R195C | P85299 | protein_coding | deleterious(0) | benign(0.042) | TCGA-F4-6856-01 | Colorectum | colon adenocarcinoma | Male | <65 | I/II | Ancillary | leucovorin | CR |
| PRR5 | SNV | Missense_Mutation | rs773110469 | c.236N>A | p.Arg79His | p.R79H | P85299 | protein_coding | tolerated(0.08) | possibly_damaging(0.88) | TCGA-A5-A1OF-01 | Endometrium | uterine corpus endometrioid carcinoma | Female | <65 | I/II | Unknown | Unknown | SD |
| PRR5 | SNV | Missense_Mutation | novel | c.757N>A | p.Leu253Met | p.L253M | P85299 | protein_coding | deleterious(0.01) | probably_damaging(0.929) | TCGA-A5-A1OF-01 | Endometrium | uterine corpus endometrioid carcinoma | Female | <65 | I/II | Unknown | Unknown | SD |
| Page: 1 2 3 4 |
Top |
Related drugs of malignant transformation related genes |
| Identification of chemicals and drugs interact with genes involved in malignant transfromation |
| (DGIdb 4.0) |
| Entrez ID | Symbol | Category | Interaction Types | Drug Claim Name | Drug Name | PMIDs |
| Page: 1 |

Copyright 2023-Present -The University of Texas Health Science Center at Houston |