
|
|||||
|
 | |
| |
| |
| |
| |
| |
|
Gene: PRR4 |
Gene summary for PRR4 |
| Gene information | Species | Human | Gene symbol | PRR4 | Gene ID | 11272 |
| Gene name | proline rich 4 | |
| Gene Alias | LPRP | |
| Cytomap | 12p13.2 | |
| Gene Type | protein-coding | GO ID | GO:0001894 | UniProtAcc | Q16378 |
Top |
Malignant transformation analysis |
| Identification of the aberrant gene expression in precancerous and cancerous lesions by comparing the gene expression of stem-like cells in diseased tissues with normal stem cells |
| Entrez ID | Symbol | Replicates | Species | Organ | Tissue | Adj P-value | Log2FC | Malignancy |
| 11272 | PRR4 | P1T-E | Human | Esophagus | ESCC | 3.76e-02 | -7.76e-02 | 0.0875 |
| 11272 | PRR4 | P2T-E | Human | Esophagus | ESCC | 2.37e-35 | 2.65e-01 | 0.1177 |
| 11272 | PRR4 | P4T-E | Human | Esophagus | ESCC | 6.44e-13 | 9.08e-02 | 0.1323 |
| 11272 | PRR4 | P5T-E | Human | Esophagus | ESCC | 3.28e-07 | -1.25e-01 | 0.1327 |
| 11272 | PRR4 | P8T-E | Human | Esophagus | ESCC | 1.48e-25 | 1.03e-01 | 0.0889 |
| 11272 | PRR4 | P9T-E | Human | Esophagus | ESCC | 7.23e-03 | -1.83e-01 | 0.1131 |
| 11272 | PRR4 | P10T-E | Human | Esophagus | ESCC | 1.69e-24 | 8.91e-02 | 0.116 |
| 11272 | PRR4 | P11T-E | Human | Esophagus | ESCC | 1.03e-02 | -9.62e-02 | 0.1426 |
| 11272 | PRR4 | P12T-E | Human | Esophagus | ESCC | 1.54e-27 | 2.01e-01 | 0.1122 |
| 11272 | PRR4 | P15T-E | Human | Esophagus | ESCC | 7.11e-05 | 7.17e-03 | 0.1149 |
| 11272 | PRR4 | P16T-E | Human | Esophagus | ESCC | 2.97e-75 | 2.63e+00 | 0.1153 |
| 11272 | PRR4 | P17T-E | Human | Esophagus | ESCC | 3.72e-02 | -4.94e-02 | 0.1278 |
| 11272 | PRR4 | P20T-E | Human | Esophagus | ESCC | 1.29e-15 | 6.10e-02 | 0.1124 |
| 11272 | PRR4 | P22T-E | Human | Esophagus | ESCC | 1.18e-37 | 4.79e-01 | 0.1236 |
| 11272 | PRR4 | P23T-E | Human | Esophagus | ESCC | 1.40e-06 | -1.04e-01 | 0.108 |
| 11272 | PRR4 | P24T-E | Human | Esophagus | ESCC | 3.31e-03 | 6.14e-01 | 0.1287 |
| 11272 | PRR4 | P26T-E | Human | Esophagus | ESCC | 1.23e-16 | -1.63e-02 | 0.1276 |
| 11272 | PRR4 | P27T-E | Human | Esophagus | ESCC | 2.41e-20 | 1.18e-01 | 0.1055 |
| 11272 | PRR4 | P28T-E | Human | Esophagus | ESCC | 5.09e-04 | -2.06e-01 | 0.1149 |
| 11272 | PRR4 | P30T-E | Human | Esophagus | ESCC | 3.18e-04 | 8.48e-02 | 0.137 |
| Page: 1 2 3 4 |
| Tissue | Expression Dynamics | Abbreviation |
| Esophagus |  | ESCC: Esophageal squamous cell carcinoma |
| HGIN: High-grade intraepithelial neoplasias | ||
| LGIN: Low-grade intraepithelial neoplasias | ||
| GC | 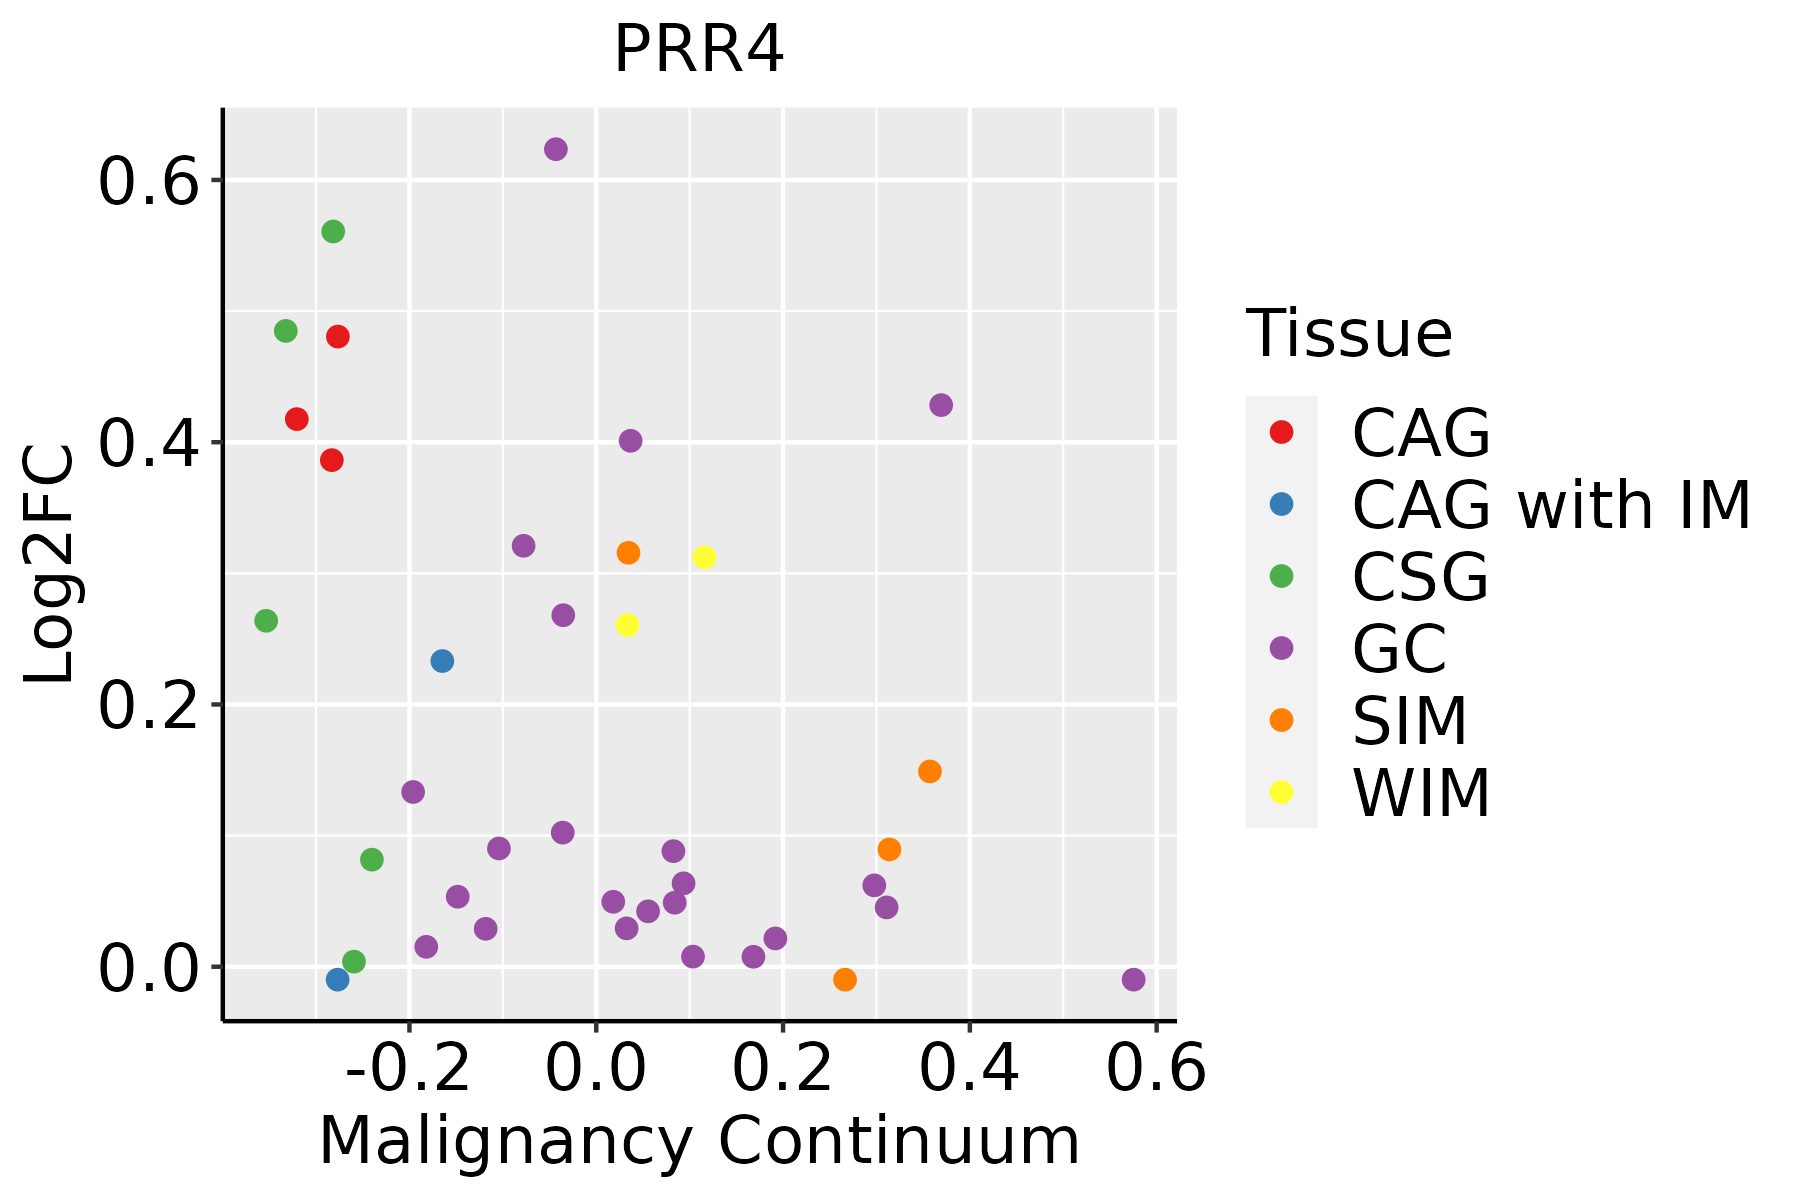 | CAG: Chronic atrophic gastritis |
| CAG with IM: Chronic atrophic gastritis with intestinal metaplasia | ||
| CSG: Chronic superficial gastritis | ||
| GC: Gastric cancer | ||
| SIM: Severe intestinal metaplasia | ||
| WIM: Wild intestinal metaplasia | ||
| Oral Cavity |  | EOLP: Erosive Oral lichen planus |
| LP: leukoplakia | ||
| NEOLP: Non-erosive oral lichen planus | ||
| OSCC: Oral squamous cell carcinoma |
| ∗log2FC in expression of this searched gene in stem-like cells from each diseased tissue sample relative to stem-like cells in normal samples in each tissue plotted against the malignancy continuum. Samples are colored based on if they are from different disease stage. |
Top |
Malignant transformation related pathway analysis |
| Find out the enriched GO biological processes and KEGG pathways involved in transition from healthy to precancer to cancer |
| Tissue | Disease Stage | Enriched GO biological Processes |
| Colorectum | AD |  |
| Colorectum | SER |  |
| Colorectum | MSS |  |
| Colorectum | MSI-H |  |
| Colorectum | FAP |  |
| ∗Top 15 enriched GO BP terms are showed in the bar plot of each disease state in each tissue. Each row represents a significant GO biological process which is colored according to the -log10(p.adjust). |
| Page: 1 2 3 4 5 6 7 8 9 |
| GO ID | Tissue | Disease Stage | Description | Gene Ratio | Bg Ratio | pvalue | p.adjust | Count |
| GO:00018946 | Stomach | GC | tissue homeostasis | 43/1159 | 268/18723 | 8.25e-09 | 8.22e-07 | 43 |
| GO:00602496 | Stomach | GC | anatomical structure homeostasis | 47/1159 | 314/18723 | 1.62e-08 | 1.40e-06 | 47 |
| GO:0001895 | Stomach | GC | retina homeostasis | 16/1159 | 79/18723 | 2.23e-05 | 6.62e-04 | 16 |
| GO:000189411 | Stomach | CAG with IM | tissue homeostasis | 42/1050 | 268/18723 | 1.40e-09 | 1.74e-07 | 42 |
| GO:006024911 | Stomach | CAG with IM | anatomical structure homeostasis | 46/1050 | 314/18723 | 2.18e-09 | 2.64e-07 | 46 |
| GO:00018951 | Stomach | CAG with IM | retina homeostasis | 16/1050 | 79/18723 | 6.51e-06 | 2.39e-04 | 16 |
| GO:000189421 | Stomach | CSG | tissue homeostasis | 40/1034 | 268/18723 | 9.33e-09 | 8.66e-07 | 40 |
| GO:006024921 | Stomach | CSG | anatomical structure homeostasis | 44/1034 | 314/18723 | 1.22e-08 | 1.06e-06 | 44 |
| GO:00018952 | Stomach | CSG | retina homeostasis | 15/1034 | 79/18723 | 2.37e-05 | 6.88e-04 | 15 |
| GO:000189431 | Stomach | CAG | tissue homeostasis | 25/552 | 268/18723 | 4.14e-07 | 3.13e-05 | 25 |
| GO:006024931 | Stomach | CAG | anatomical structure homeostasis | 27/552 | 314/18723 | 7.25e-07 | 4.98e-05 | 27 |
| GO:00018953 | Stomach | CAG | retina homeostasis | 8/552 | 79/18723 | 2.26e-03 | 2.50e-02 | 8 |
| GO:006024941 | Stomach | WIM | anatomical structure homeostasis | 22/426 | 314/18723 | 3.36e-06 | 1.93e-04 | 22 |
| GO:000189441 | Stomach | WIM | tissue homeostasis | 20/426 | 268/18723 | 3.64e-06 | 2.03e-04 | 20 |
| GO:00018954 | Stomach | WIM | retina homeostasis | 7/426 | 79/18723 | 2.13e-03 | 2.54e-02 | 7 |
| GO:006024951 | Stomach | SIM | anatomical structure homeostasis | 28/708 | 314/18723 | 2.52e-05 | 7.73e-04 | 28 |
| GO:000189451 | Stomach | SIM | tissue homeostasis | 25/708 | 268/18723 | 3.22e-05 | 9.44e-04 | 25 |
| GO:00018955 | Stomach | SIM | retina homeostasis | 9/708 | 79/18723 | 2.91e-03 | 2.82e-02 | 9 |
| Page: 1 |
| Pathway ID | Tissue | Disease Stage | Description | Gene Ratio | Bg Ratio | pvalue | p.adjust | qvalue | Count |
| Page: 1 |
Top |
Cell-cell communication analysis |
| Identification of potential cell-cell interactions between two cell types and their ligand-receptor pairs for different disease states |
| Ligand | Receptor | LRpair | Pathway | Tissue | Disease Stage |
| Page: 1 |
Top |
Single-cell gene regulatory network inference analysis |
| Find out the significant the regulons (TFs) and the target genes of each regulon across cell types for different disease states |
| TF | Cell Type | Tissue | Disease Stage | Target Gene | RSS | Regulon Activity |
| ∗The dot plots of a searched regulon are shown for all cell subpopulations in each disease state of each tissue based on the regulon specific score inferred using pySCENIC and by calculating the average expression. |
| Page: 1 |
Top |
Somatic mutation of malignant transformation related genes |
| Annotation of somatic variants for genes involved in malignant transformation |
| Hugo Symbol | Variant Class | Variant Classification | dbSNP RS | HGVSc | HGVSp | HGVSp Short | SWISSPROT | BIOTYPE | SIFT | PolyPhen | Tumor Sample Barcode | Tissue | Histology | Sex | Age | Stage | Therapy Types | Drugs | Outcome |
| PRR4 | SNV | Missense_Mutation | c.49N>G | p.Gln17Glu | p.Q17E | Q16378 | protein_coding | tolerated_low_confidence(0.08) | possibly_damaging(0.681) | TCGA-A8-A09G-01 | Breast | breast invasive carcinoma | Female | >=65 | III/IV | Unknown | Unknown | SD | |
| PRR4 | SNV | Missense_Mutation | novel | c.76N>A | p.Glu26Lys | p.E26K | Q16378 | protein_coding | deleterious_low_confidence(0.03) | probably_damaging(0.909) | TCGA-AC-A6NO-01 | Breast | breast invasive carcinoma | Female | <65 | I/II | Unknown | Unknown | SD |
| PRR4 | SNV | Missense_Mutation | c.119N>C | p.Gln40Pro | p.Q40P | Q16378 | protein_coding | deleterious_low_confidence(0.01) | possibly_damaging(0.81) | TCGA-A6-6651-01 | Colorectum | colon adenocarcinoma | Female | <65 | III/IV | Ancillary | leucovorin | SD | |
| PRR4 | SNV | Missense_Mutation | rs373379068 | c.242G>A | p.Arg81His | p.R81H | Q16378 | protein_coding | tolerated_low_confidence(0.4) | benign(0.001) | TCGA-AA-3663-01 | Colorectum | colon adenocarcinoma | Male | <65 | I/II | Unknown | Unknown | SD |
| PRR4 | SNV | Missense_Mutation | novel | c.35N>T | p.Ala12Val | p.A12V | Q16378 | protein_coding | tolerated_low_confidence(0.16) | possibly_damaging(0.638) | TCGA-B5-A3FA-01 | Endometrium | uterine corpus endometrioid carcinoma | Female | >=65 | I/II | Unknown | Unknown | SD |
| PRR4 | SNV | Missense_Mutation | novel | c.166N>T | p.Pro56Ser | p.P56S | Q16378 | protein_coding | tolerated_low_confidence(0.1) | probably_damaging(0.947) | TCGA-EY-A215-01 | Endometrium | uterine corpus endometrioid carcinoma | Female | <65 | I/II | Unknown | Unknown | SD |
| PRR4 | insertion | Nonsense_Mutation | novel | c.194_195insGGACTGAGCAAAGAGTCCTCTGGCGGAAACCTGAGAGAAACCTG | p.Asp67Ter | p.D67* | Q16378 | protein_coding | TCGA-B5-A11F-01 | Endometrium | uterine corpus endometrioid carcinoma | Female | <65 | I/II | Hormone Therapy | megace | SD | ||
| PRR4 | insertion | Nonsense_Mutation | novel | c.213_214insGTTTGAGAAGGCAGACTCAAAGACAGGAGGC | p.Arg72ValfsTer2 | p.R72Vfs*2 | Q16378 | protein_coding | TCGA-B5-A11Z-01 | Endometrium | uterine corpus endometrioid carcinoma | Female | <65 | I/II | Unknown | Unknown | SD | ||
| PRR4 | insertion | Frame_Shift_Ins | novel | c.209_210insAAGACAGGAG | p.Gln71ArgfsTer70 | p.Q71Rfs*70 | Q16378 | protein_coding | TCGA-BG-A0MU-01 | Endometrium | uterine corpus endometrioid carcinoma | Female | >=65 | III/IV | Hormone Therapy | megace | SD | ||
| PRR4 | insertion | Frame_Shift_Ins | novel | c.111_112insCTATTGTCCTCAAAGCCAGGCATCTCTGTAT | p.Ser38LeufsTer25 | p.S38Lfs*25 | Q16378 | protein_coding | TCGA-D1-A102-01 | Endometrium | uterine corpus endometrioid carcinoma | Female | <65 | I/II | Unknown | Unknown | SD |
| Page: 1 2 |
Top |
Related drugs of malignant transformation related genes |
| Identification of chemicals and drugs interact with genes involved in malignant transfromation |
| (DGIdb 4.0) |
| Entrez ID | Symbol | Category | Interaction Types | Drug Claim Name | Drug Name | PMIDs |
| Page: 1 |

Copyright 2023-Present -The University of Texas Health Science Center at Houston |