
|
|||||
|
 | |
| |
| |
| |
| |
| |
|
Gene: PRR16 |
Gene summary for PRR16 |
| Gene information | Species | Human | Gene symbol | PRR16 | Gene ID | 51334 |
| Gene name | proline rich 16 | |
| Gene Alias | DSC54 | |
| Cytomap | 5q23.1 | |
| Gene Type | protein-coding | GO ID | GO:0006412 | UniProtAcc | Q569H4 |
Top |
Malignant transformation analysis |
| Identification of the aberrant gene expression in precancerous and cancerous lesions by comparing the gene expression of stem-like cells in diseased tissues with normal stem cells |
| Entrez ID | Symbol | Replicates | Species | Organ | Tissue | Adj P-value | Log2FC | Malignancy |
| 51334 | PRR16 | P4T-E | Human | Esophagus | ESCC | 8.00e-03 | 1.27e-01 | 0.1323 |
| 51334 | PRR16 | P9T-E | Human | Esophagus | ESCC | 4.01e-04 | 1.26e-01 | 0.1131 |
| 51334 | PRR16 | P23T-E | Human | Esophagus | ESCC | 9.87e-03 | 2.12e-01 | 0.108 |
| 51334 | PRR16 | P24T-E | Human | Esophagus | ESCC | 8.91e-09 | 3.33e-01 | 0.1287 |
| 51334 | PRR16 | P32T-E | Human | Esophagus | ESCC | 7.27e-05 | 2.23e-01 | 0.1666 |
| 51334 | PRR16 | P36T-E | Human | Esophagus | ESCC | 1.41e-19 | 5.94e-01 | 0.1187 |
| 51334 | PRR16 | P42T-E | Human | Esophagus | ESCC | 9.05e-04 | 1.75e-01 | 0.1175 |
| 51334 | PRR16 | P62T-E | Human | Esophagus | ESCC | 4.16e-48 | 9.83e-01 | 0.1302 |
| 51334 | PRR16 | P89T-E | Human | Esophagus | ESCC | 3.05e-17 | 9.67e-01 | 0.1752 |
| 51334 | PRR16 | 048752_1579-all-cells | Human | Prostate | BPH | 3.82e-19 | 4.63e-01 | 0.1008 |
| 51334 | PRR16 | 052095_1628-all-cells | Human | Prostate | BPH | 8.24e-35 | 7.73e-01 | 0.1032 |
| 51334 | PRR16 | 052097_1595-all-cells | Human | Prostate | BPH | 3.94e-06 | 2.65e-01 | 0.0972 |
| 51334 | PRR16 | 052099_1652-all-cells | Human | Prostate | BPH | 1.26e-19 | 5.74e-01 | 0.1038 |
| 51334 | PRR16 | Dong_P1 | Human | Prostate | Tumor | 1.43e-08 | 1.00e-01 | 0.035 |
| 51334 | PRR16 | P10 | Human | Prostate | Tumor | 1.56e-03 | 2.68e-01 | -0.0902 |
| Page: 1 |
| Tissue | Expression Dynamics | Abbreviation |
| Esophagus | 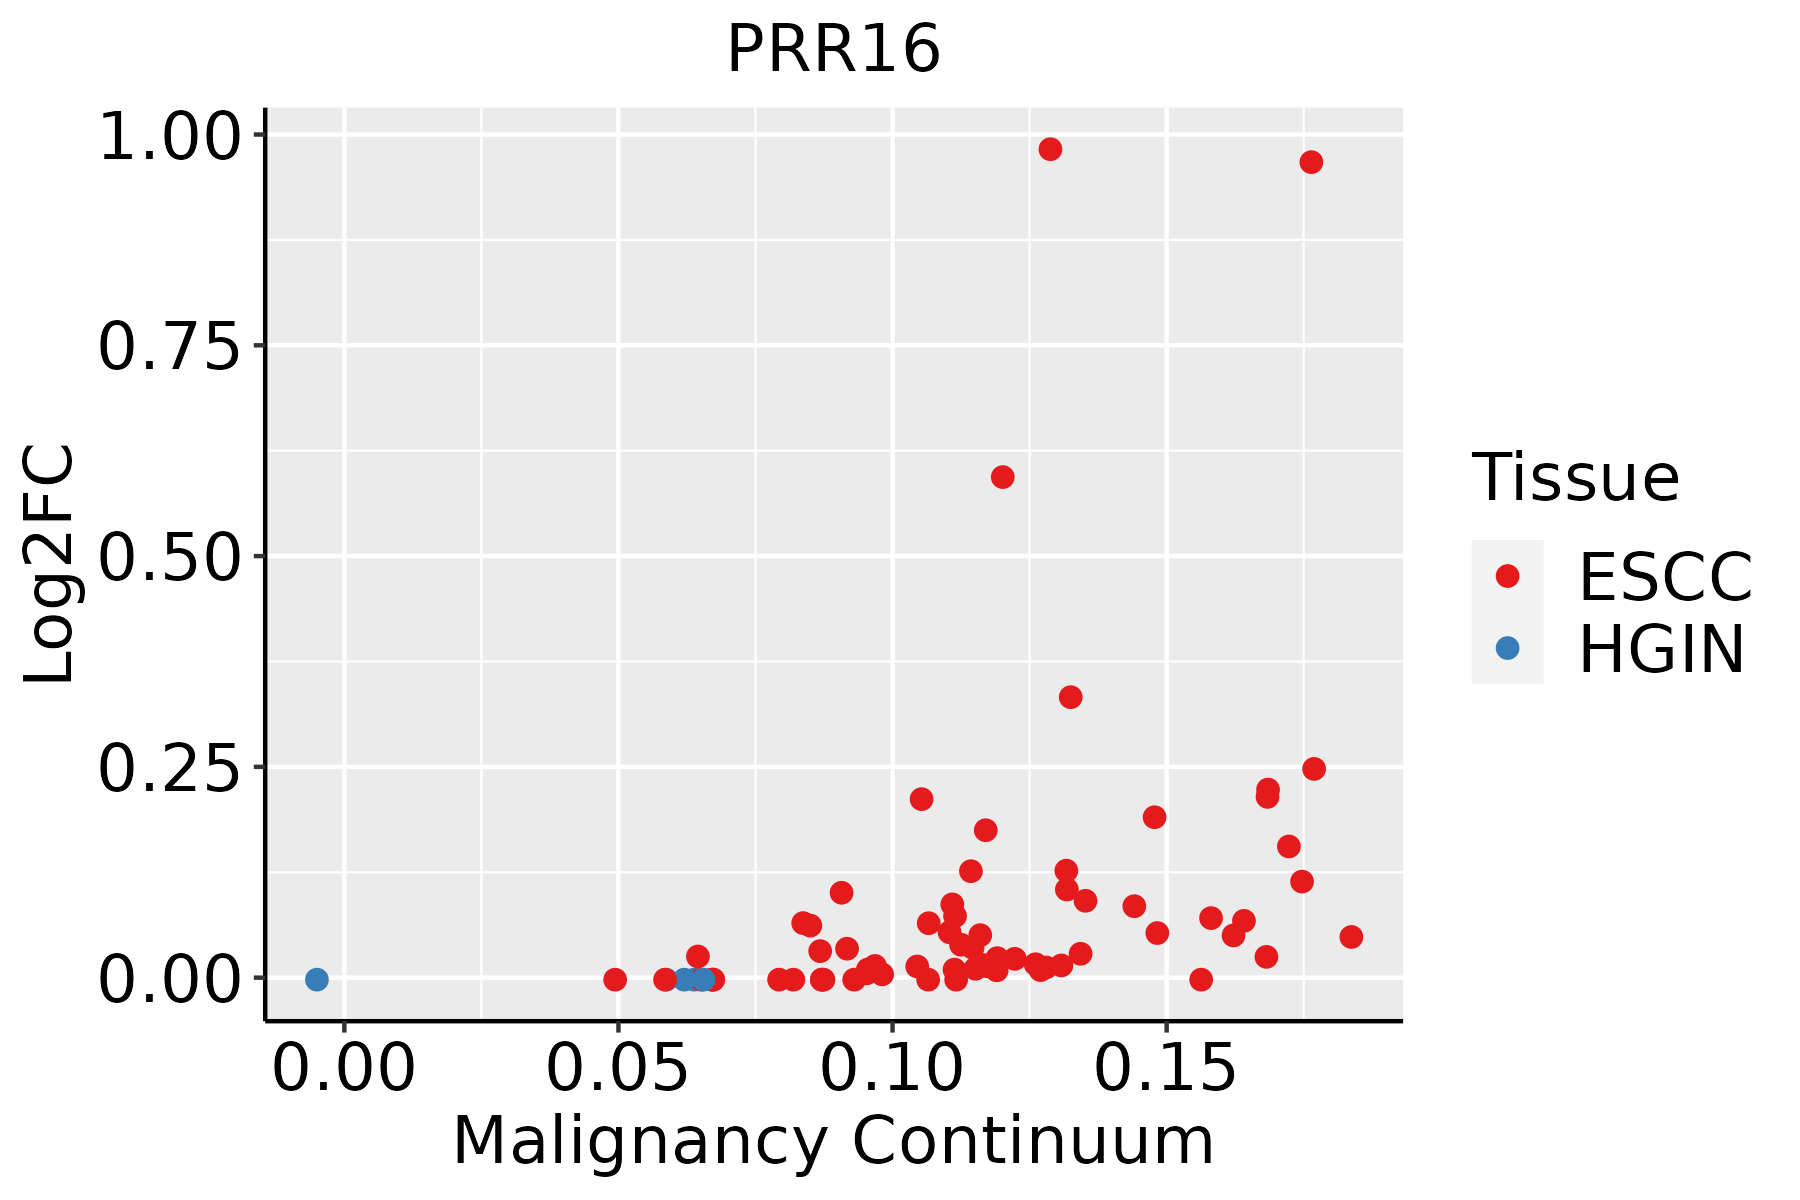 | ESCC: Esophageal squamous cell carcinoma |
| HGIN: High-grade intraepithelial neoplasias | ||
| LGIN: Low-grade intraepithelial neoplasias | ||
| Prostate | 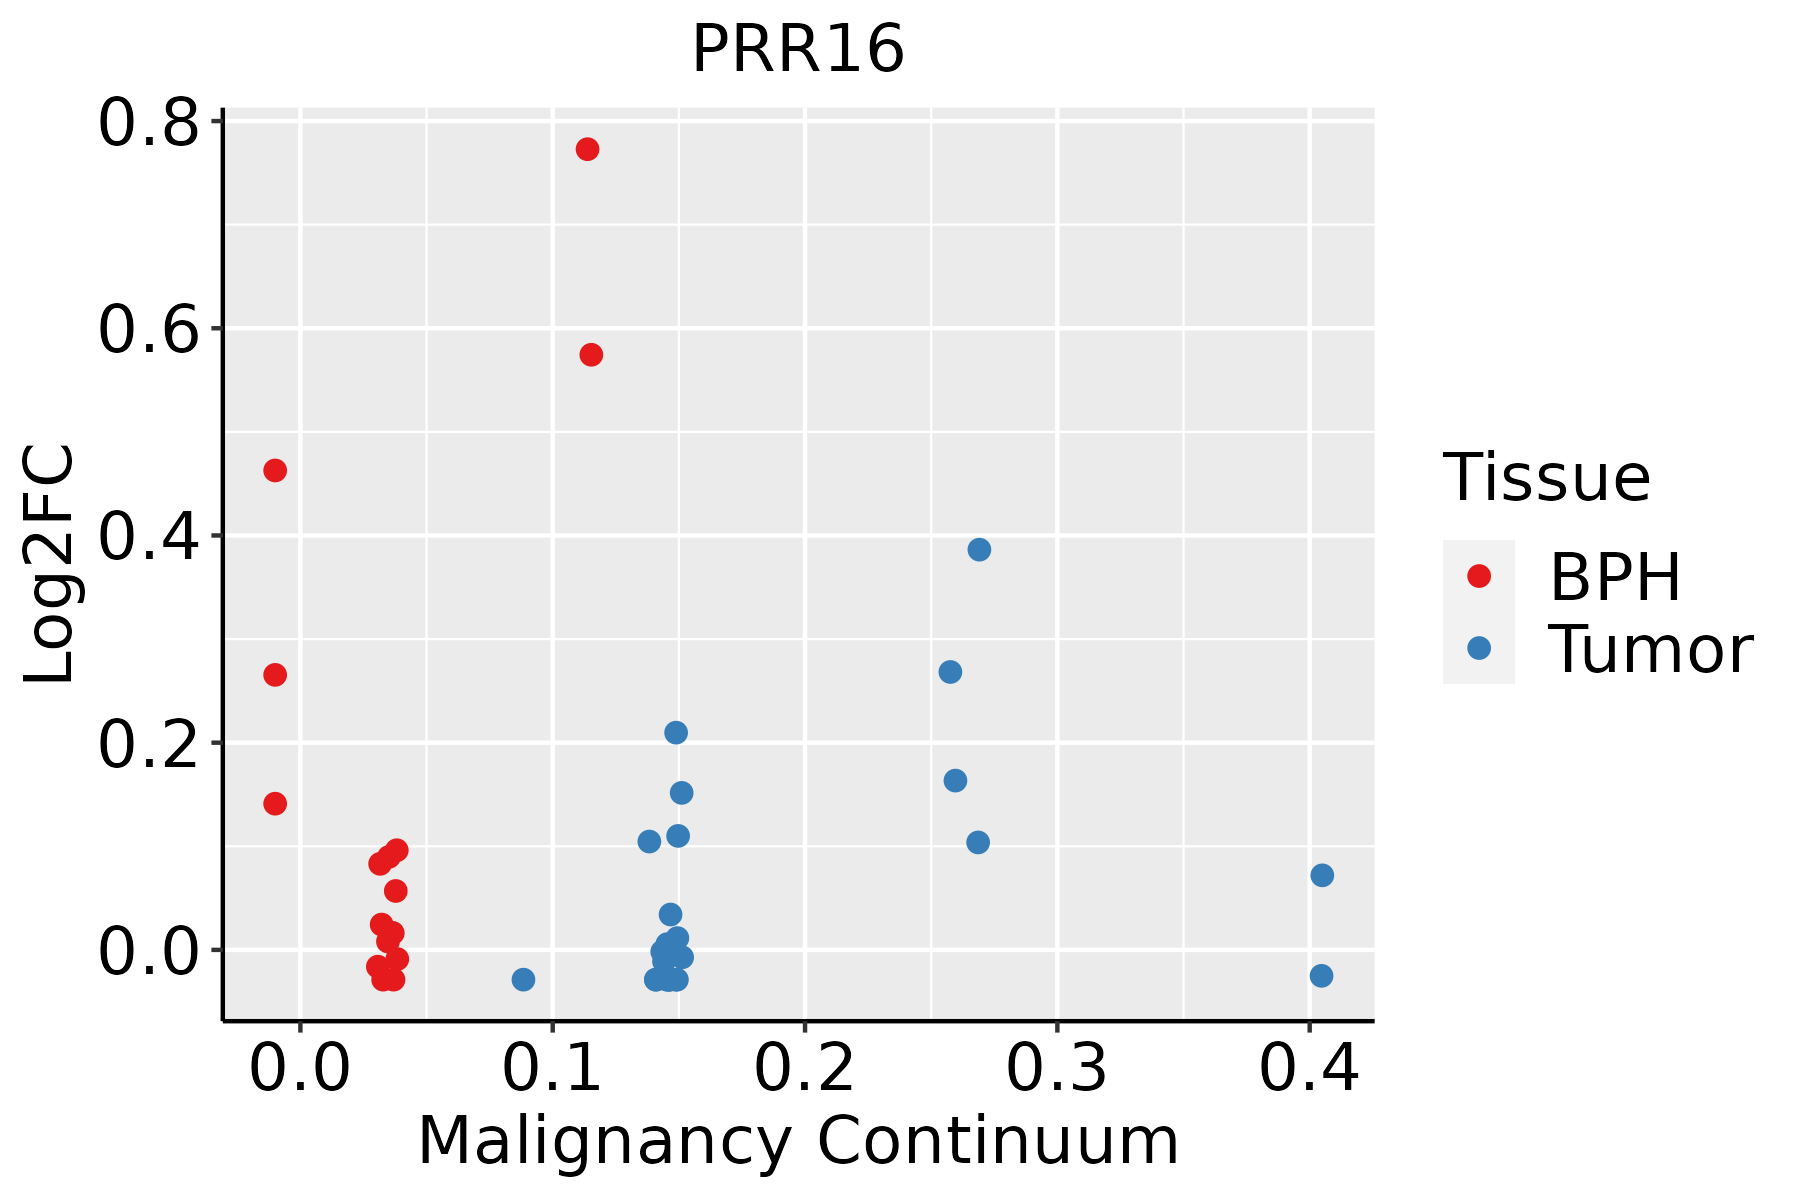 | BPH: Benign Prostatic Hyperplasia |
| ∗log2FC in expression of this searched gene in stem-like cells from each diseased tissue sample relative to stem-like cells in normal samples in each tissue plotted against the malignancy continuum. Samples are colored based on if they are from different disease stage. |
Top |
Malignant transformation related pathway analysis |
| Find out the enriched GO biological processes and KEGG pathways involved in transition from healthy to precancer to cancer |
| Tissue | Disease Stage | Enriched GO biological Processes |
| Colorectum | AD |  |
| Colorectum | SER |  |
| Colorectum | MSS |  |
| Colorectum | MSI-H |  |
| Colorectum | FAP |  |
| ∗Top 15 enriched GO BP terms are showed in the bar plot of each disease state in each tissue. Each row represents a significant GO biological process which is colored according to the -log10(p.adjust). |
| Page: 1 2 3 4 5 6 7 8 9 |
| GO ID | Tissue | Disease Stage | Description | Gene Ratio | Bg Ratio | pvalue | p.adjust | Count |
| GO:0006417111 | Esophagus | ESCC | regulation of translation | 304/8552 | 468/18723 | 1.53e-17 | 1.33e-15 | 304 |
| GO:0045727111 | Esophagus | ESCC | positive regulation of translation | 107/8552 | 136/18723 | 2.79e-15 | 1.68e-13 | 107 |
| GO:0034250111 | Esophagus | ESCC | positive regulation of cellular amide metabolic process | 123/8552 | 162/18723 | 3.32e-15 | 1.93e-13 | 123 |
| GO:003253520 | Esophagus | ESCC | regulation of cellular component size | 227/8552 | 383/18723 | 4.77e-08 | 8.60e-07 | 227 |
| GO:00083619 | Esophagus | ESCC | regulation of cell size | 107/8552 | 181/18723 | 1.81e-04 | 1.16e-03 | 107 |
| GO:000641718 | Prostate | BPH | regulation of translation | 157/3107 | 468/18723 | 9.09e-20 | 5.63e-17 | 157 |
| GO:003425017 | Prostate | BPH | positive regulation of cellular amide metabolic process | 67/3107 | 162/18723 | 5.89e-14 | 6.51e-12 | 67 |
| GO:004572717 | Prostate | BPH | positive regulation of translation | 59/3107 | 136/18723 | 1.53e-13 | 1.58e-11 | 59 |
| GO:003253517 | Prostate | BPH | regulation of cellular component size | 108/3107 | 383/18723 | 6.41e-09 | 2.27e-07 | 108 |
| GO:0045793 | Prostate | BPH | positive regulation of cell size | 7/3107 | 11/18723 | 6.10e-04 | 4.16e-03 | 7 |
| GO:00083617 | Prostate | BPH | regulation of cell size | 45/3107 | 181/18723 | 2.79e-03 | 1.47e-02 | 45 |
| GO:000641719 | Prostate | Tumor | regulation of translation | 161/3246 | 468/18723 | 1.55e-19 | 8.74e-17 | 161 |
| GO:003425018 | Prostate | Tumor | positive regulation of cellular amide metabolic process | 68/3246 | 162/18723 | 1.42e-13 | 1.63e-11 | 68 |
| GO:004572718 | Prostate | Tumor | positive regulation of translation | 59/3246 | 136/18723 | 1.06e-12 | 9.98e-11 | 59 |
| GO:003253518 | Prostate | Tumor | regulation of cellular component size | 109/3246 | 383/18723 | 3.56e-08 | 1.12e-06 | 109 |
| GO:00457931 | Prostate | Tumor | positive regulation of cell size | 7/3246 | 11/18723 | 8.04e-04 | 5.44e-03 | 7 |
| GO:000836112 | Prostate | Tumor | regulation of cell size | 46/3246 | 181/18723 | 3.81e-03 | 1.94e-02 | 46 |
| Page: 1 |
| Pathway ID | Tissue | Disease Stage | Description | Gene Ratio | Bg Ratio | pvalue | p.adjust | qvalue | Count |
| Page: 1 |
Top |
Cell-cell communication analysis |
| Identification of potential cell-cell interactions between two cell types and their ligand-receptor pairs for different disease states |
| Ligand | Receptor | LRpair | Pathway | Tissue | Disease Stage |
| Page: 1 |
Top |
Single-cell gene regulatory network inference analysis |
| Find out the significant the regulons (TFs) and the target genes of each regulon across cell types for different disease states |
| TF | Cell Type | Tissue | Disease Stage | Target Gene | RSS | Regulon Activity |
| ∗The dot plots of a searched regulon are shown for all cell subpopulations in each disease state of each tissue based on the regulon specific score inferred using pySCENIC and by calculating the average expression. |
| Page: 1 |
Top |
Somatic mutation of malignant transformation related genes |
| Annotation of somatic variants for genes involved in malignant transformation |
| Hugo Symbol | Variant Class | Variant Classification | dbSNP RS | HGVSc | HGVSp | HGVSp Short | SWISSPROT | BIOTYPE | SIFT | PolyPhen | Tumor Sample Barcode | Tissue | Histology | Sex | Age | Stage | Therapy Types | Drugs | Outcome |
| PRR16 | SNV | Missense_Mutation | c.661N>A | p.Asp221Asn | p.D221N | Q569H4 | protein_coding | deleterious(0) | possibly_damaging(0.517) | TCGA-D8-A27G-01 | Breast | breast invasive carcinoma | Female | >=65 | I/II | Unknown | Unknown | SD | |
| PRR16 | SNV | Missense_Mutation | novel | c.89T>G | p.Ile30Ser | p.I30S | Q569H4 | protein_coding | deleterious(0) | possibly_damaging(0.587) | TCGA-2W-A8YY-01 | Cervix | cervical & endocervical cancer | Female | <65 | I/II | Chemotherapy | cisplatin | CR |
| PRR16 | SNV | Missense_Mutation | rs756220018 | c.605N>A | p.Arg202Gln | p.R202Q | Q569H4 | protein_coding | deleterious(0.01) | probably_damaging(0.928) | TCGA-HM-A4S6-01 | Cervix | cervical & endocervical cancer | Female | <65 | III/IV | Chemotherapy | cisplatin | CR |
| PRR16 | SNV | Missense_Mutation | c.479N>A | p.Pro160Gln | p.P160Q | Q569H4 | protein_coding | deleterious(0.03) | benign(0.007) | TCGA-AA-3975-01 | Colorectum | colon adenocarcinoma | Male | >=65 | I/II | Unknown | Unknown | SD | |
| PRR16 | SNV | Missense_Mutation | rs201082218 | c.236C>T | p.Thr79Met | p.T79M | Q569H4 | protein_coding | deleterious(0) | probably_damaging(0.999) | TCGA-AA-A01K-01 | Colorectum | colon adenocarcinoma | Female | >=65 | III/IV | Chemotherapy | folinic | CR |
| PRR16 | SNV | Missense_Mutation | novel | c.353G>A | p.Arg118Lys | p.R118K | Q569H4 | protein_coding | tolerated(0.54) | benign(0.017) | TCGA-AG-A002-01 | Colorectum | rectum adenocarcinoma | Male | <65 | I/II | Unknown | Unknown | SD |
| PRR16 | SNV | Missense_Mutation | novel | c.910N>A | p.Val304Met | p.V304M | Q569H4 | protein_coding | deleterious(0) | probably_damaging(0.999) | TCGA-A5-A0G2-01 | Endometrium | uterine corpus endometrioid carcinoma | Female | <65 | III/IV | Unknown | Unknown | SD |
| PRR16 | SNV | Missense_Mutation | novel | c.836N>A | p.Arg279Lys | p.R279K | Q569H4 | protein_coding | tolerated(0.47) | benign(0) | TCGA-AJ-A3EL-01 | Endometrium | uterine corpus endometrioid carcinoma | Female | <65 | I/II | Unknown | Unknown | SD |
| PRR16 | SNV | Missense_Mutation | rs201907499 | c.722N>T | p.Pro241Leu | p.P241L | Q569H4 | protein_coding | tolerated(0.41) | benign(0.003) | TCGA-AJ-A3OK-01 | Endometrium | uterine corpus endometrioid carcinoma | Female | >=65 | I/II | Chemotherapy | carboplatin | CR |
| PRR16 | SNV | Missense_Mutation | novel | c.445N>G | p.Thr149Ala | p.T149A | Q569H4 | protein_coding | tolerated(0.43) | benign(0.015) | TCGA-AJ-A5DW-01 | Endometrium | uterine corpus endometrioid carcinoma | Female | <65 | I/II | Unknown | Unknown | SD |
| Page: 1 2 3 4 5 6 7 |
Top |
Related drugs of malignant transformation related genes |
| Identification of chemicals and drugs interact with genes involved in malignant transfromation |
| (DGIdb 4.0) |
| Entrez ID | Symbol | Category | Interaction Types | Drug Claim Name | Drug Name | PMIDs |
| Page: 1 |

Copyright 2023-Present -The University of Texas Health Science Center at Houston |