
|
|||||
|
 | |
| |
| |
| |
| |
| |
|
Gene: PRR11 |
Gene summary for PRR11 |
| Gene information | Species | Human | Gene symbol | PRR11 | Gene ID | 55771 |
| Gene name | proline rich 11 | |
| Gene Alias | PRR11 | |
| Cytomap | 17q22 | |
| Gene Type | protein-coding | GO ID | GO:0007049 | UniProtAcc | D2SNZ4 |
Top |
Malignant transformation analysis |
| Identification of the aberrant gene expression in precancerous and cancerous lesions by comparing the gene expression of stem-like cells in diseased tissues with normal stem cells |
| Entrez ID | Symbol | Replicates | Species | Organ | Tissue | Adj P-value | Log2FC | Malignancy |
| 55771 | PRR11 | P4T-E | Human | Esophagus | ESCC | 8.00e-03 | 1.41e-01 | 0.1323 |
| 55771 | PRR11 | P5T-E | Human | Esophagus | ESCC | 8.40e-04 | 1.31e-01 | 0.1327 |
| 55771 | PRR11 | P8T-E | Human | Esophagus | ESCC | 1.66e-02 | 9.68e-02 | 0.0889 |
| 55771 | PRR11 | P10T-E | Human | Esophagus | ESCC | 4.40e-09 | 2.57e-01 | 0.116 |
| 55771 | PRR11 | P15T-E | Human | Esophagus | ESCC | 1.35e-04 | 1.49e-01 | 0.1149 |
| 55771 | PRR11 | P21T-E | Human | Esophagus | ESCC | 4.44e-08 | 1.98e-01 | 0.1617 |
| 55771 | PRR11 | P23T-E | Human | Esophagus | ESCC | 1.48e-05 | 3.53e-01 | 0.108 |
| 55771 | PRR11 | P24T-E | Human | Esophagus | ESCC | 7.90e-03 | 1.43e-01 | 0.1287 |
| 55771 | PRR11 | P28T-E | Human | Esophagus | ESCC | 3.75e-03 | 9.09e-02 | 0.1149 |
| 55771 | PRR11 | P31T-E | Human | Esophagus | ESCC | 7.90e-03 | 1.39e-01 | 0.1251 |
| 55771 | PRR11 | P32T-E | Human | Esophagus | ESCC | 2.39e-24 | 6.90e-01 | 0.1666 |
| 55771 | PRR11 | P36T-E | Human | Esophagus | ESCC | 1.55e-04 | 2.56e-01 | 0.1187 |
| 55771 | PRR11 | P37T-E | Human | Esophagus | ESCC | 4.26e-12 | 3.47e-01 | 0.1371 |
| 55771 | PRR11 | P40T-E | Human | Esophagus | ESCC | 4.53e-04 | 1.73e-01 | 0.109 |
| 55771 | PRR11 | P52T-E | Human | Esophagus | ESCC | 8.40e-04 | 1.48e-01 | 0.1555 |
| 55771 | PRR11 | P62T-E | Human | Esophagus | ESCC | 2.60e-04 | 1.60e-01 | 0.1302 |
| 55771 | PRR11 | P74T-E | Human | Esophagus | ESCC | 1.96e-03 | 2.20e-01 | 0.1479 |
| 55771 | PRR11 | P76T-E | Human | Esophagus | ESCC | 1.96e-05 | 2.53e-01 | 0.1207 |
| 55771 | PRR11 | P79T-E | Human | Esophagus | ESCC | 3.97e-04 | 1.91e-01 | 0.1154 |
| 55771 | PRR11 | P83T-E | Human | Esophagus | ESCC | 9.80e-07 | 1.96e-01 | 0.1738 |
| Page: 1 2 |
| Tissue | Expression Dynamics | Abbreviation |
| Esophagus | 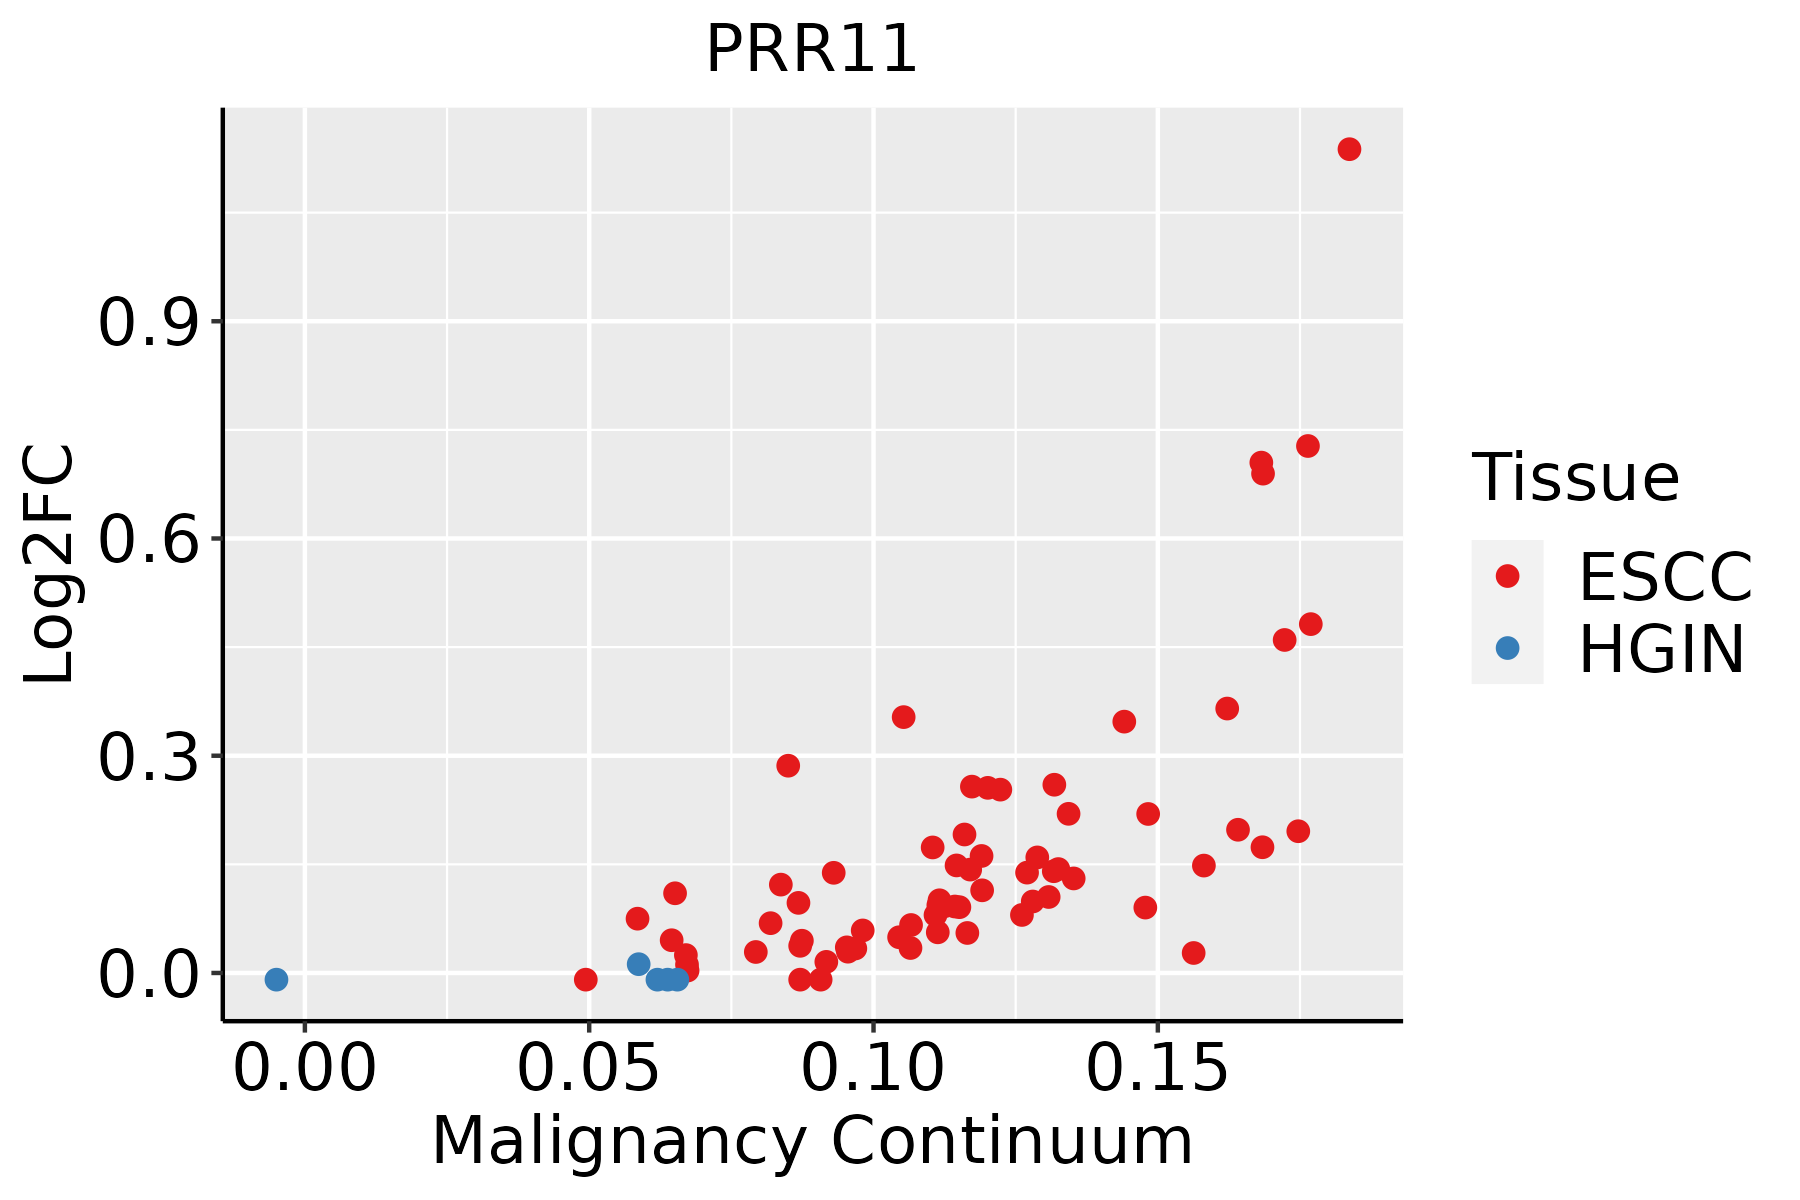 | ESCC: Esophageal squamous cell carcinoma |
| HGIN: High-grade intraepithelial neoplasias | ||
| LGIN: Low-grade intraepithelial neoplasias | ||
| Liver | 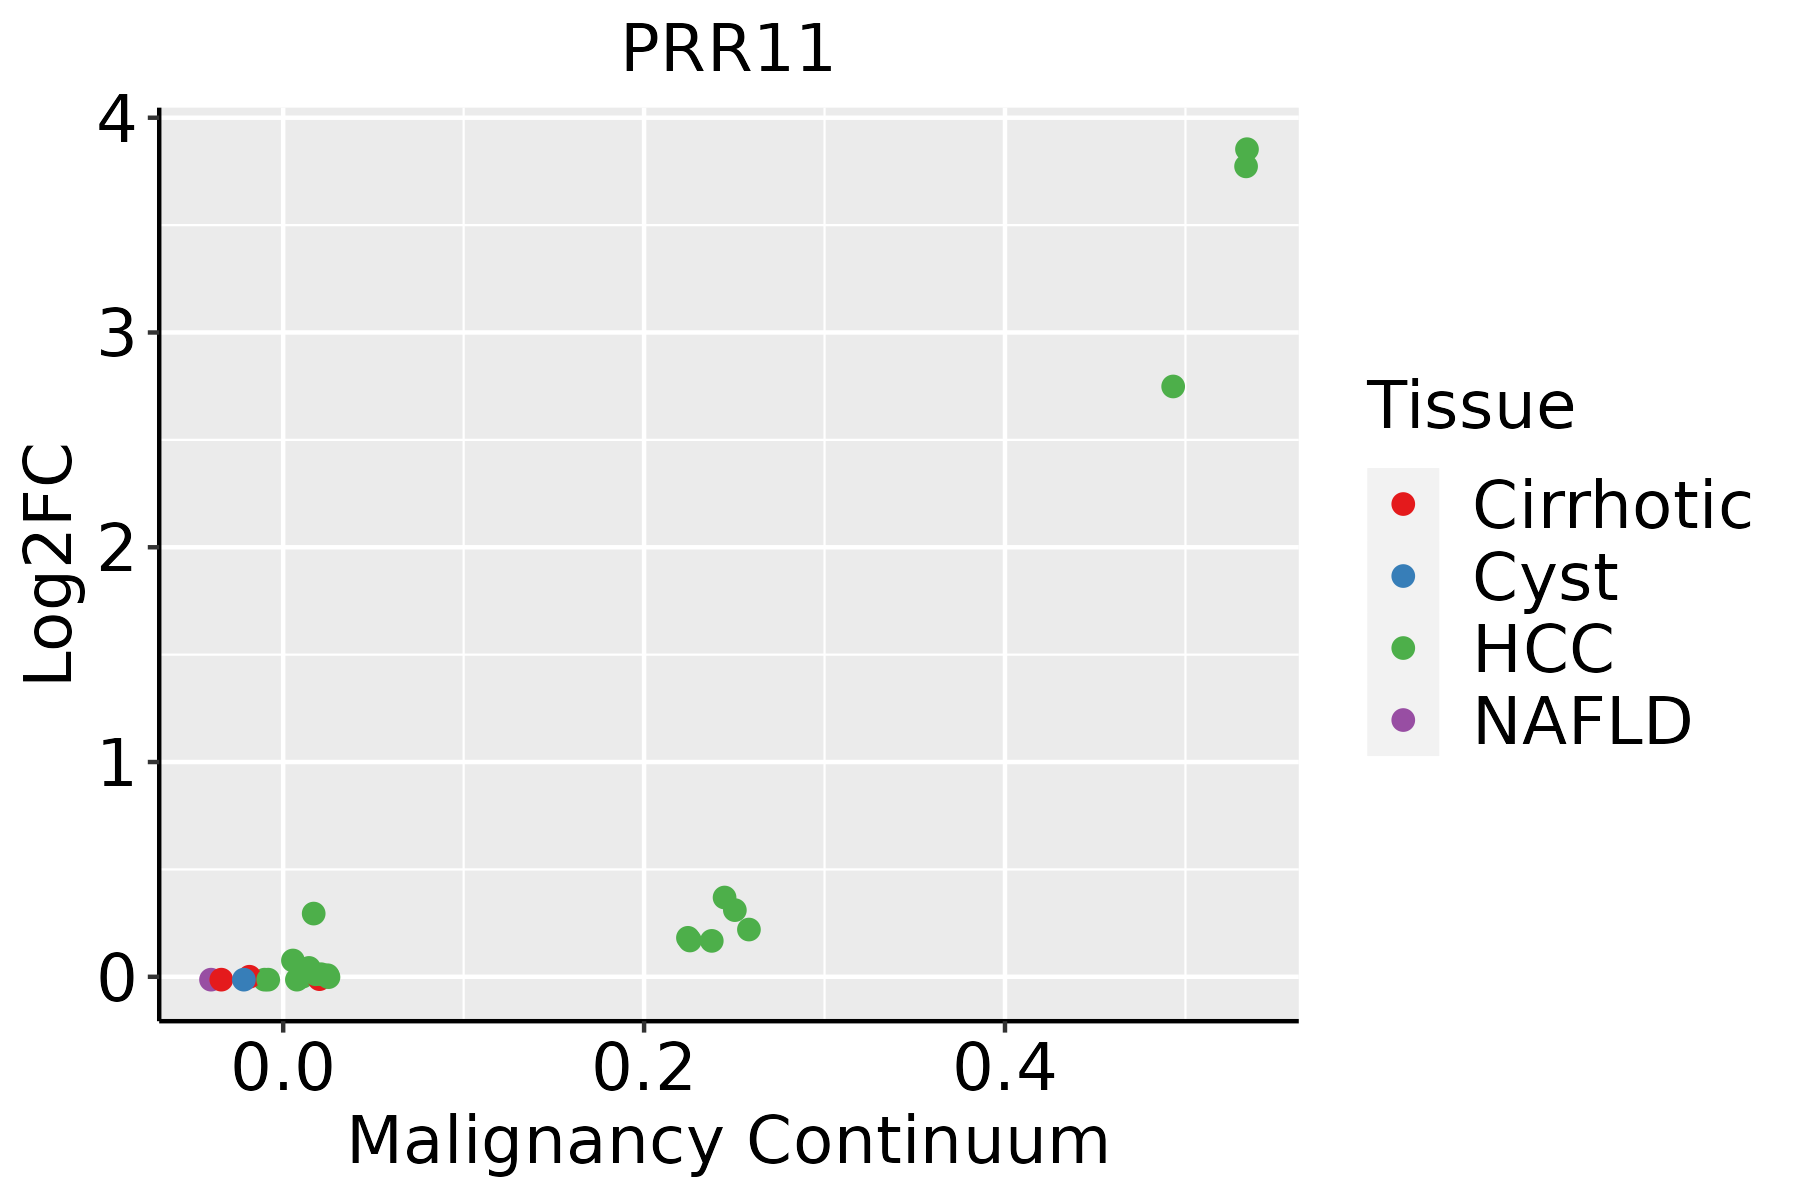 | HCC: Hepatocellular carcinoma |
| NAFLD: Non-alcoholic fatty liver disease | ||
| Skin | 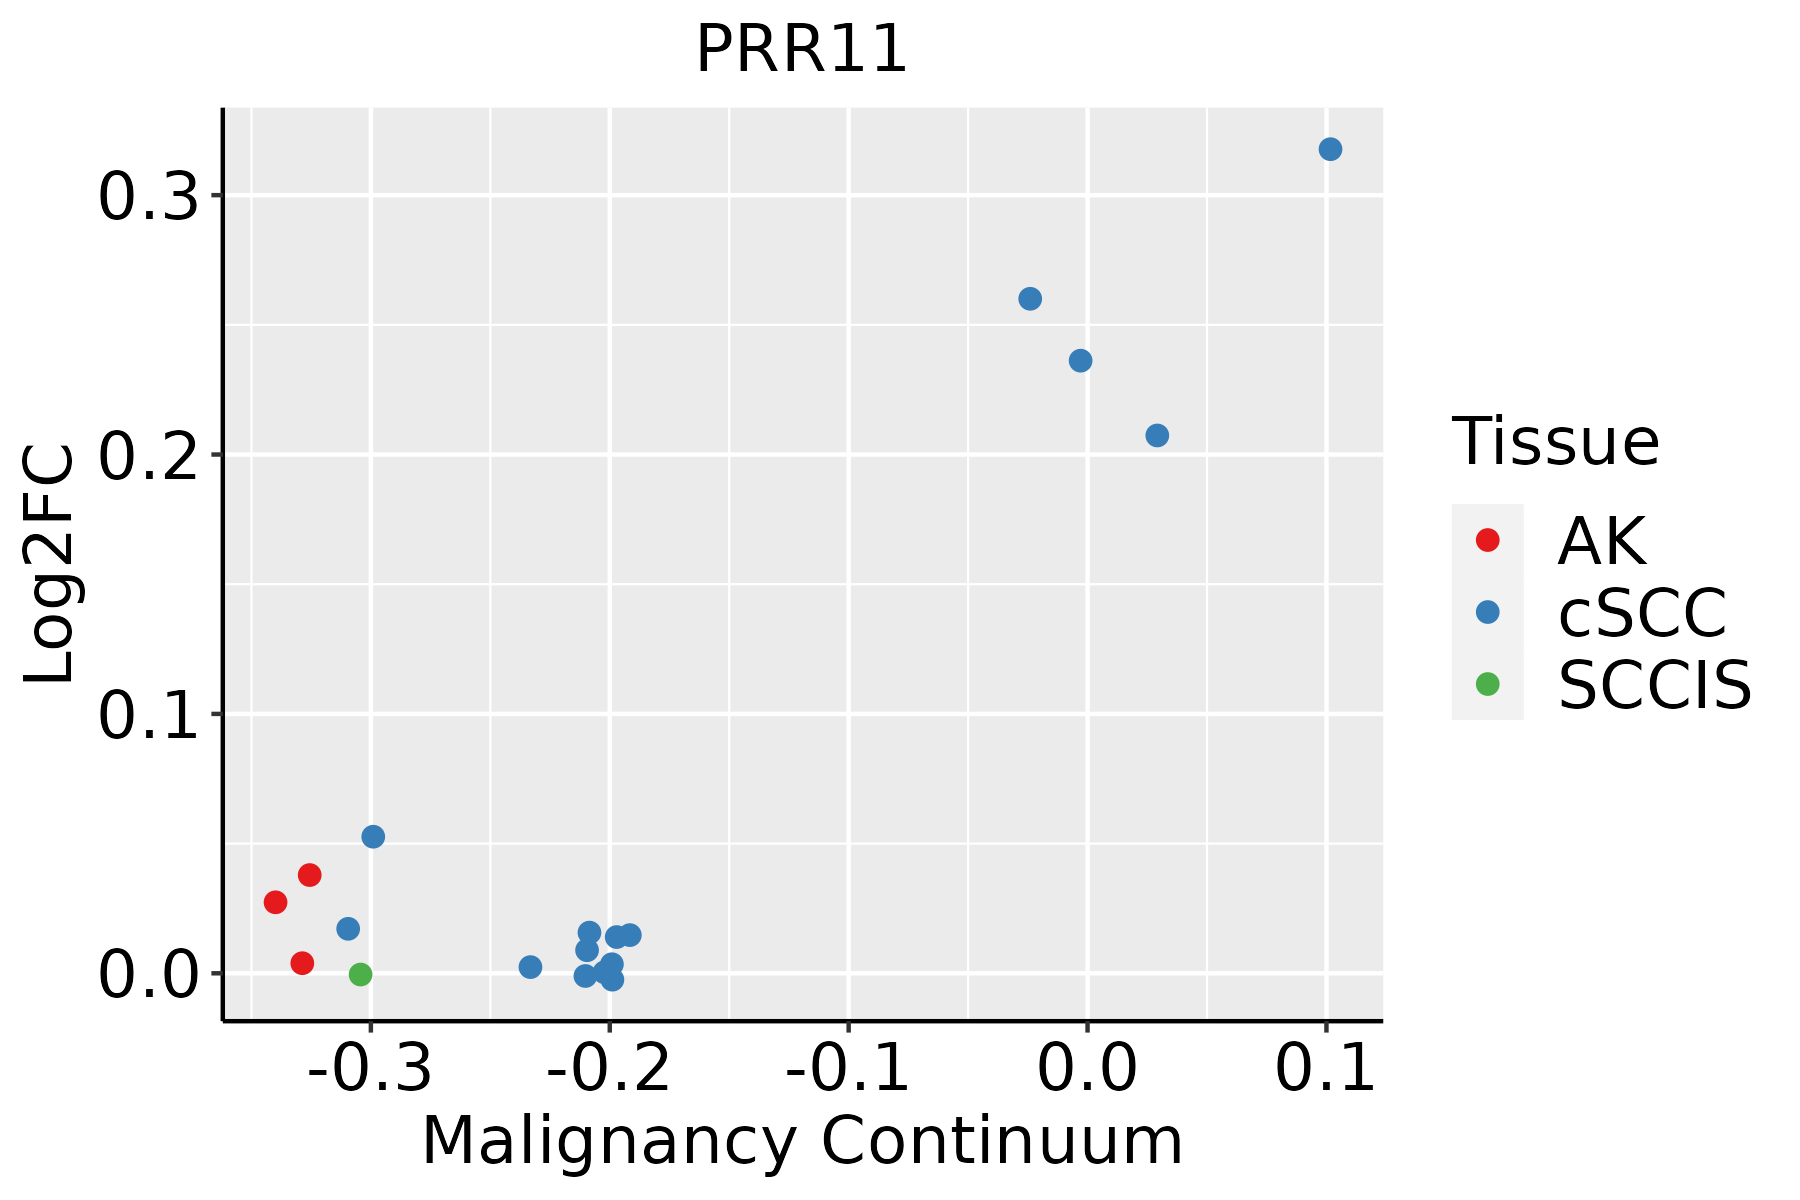 | AK: Actinic keratosis |
| cSCC: Cutaneous squamous cell carcinoma | ||
| SCCIS:squamous cell carcinoma in situ | ||
| Thyroid | 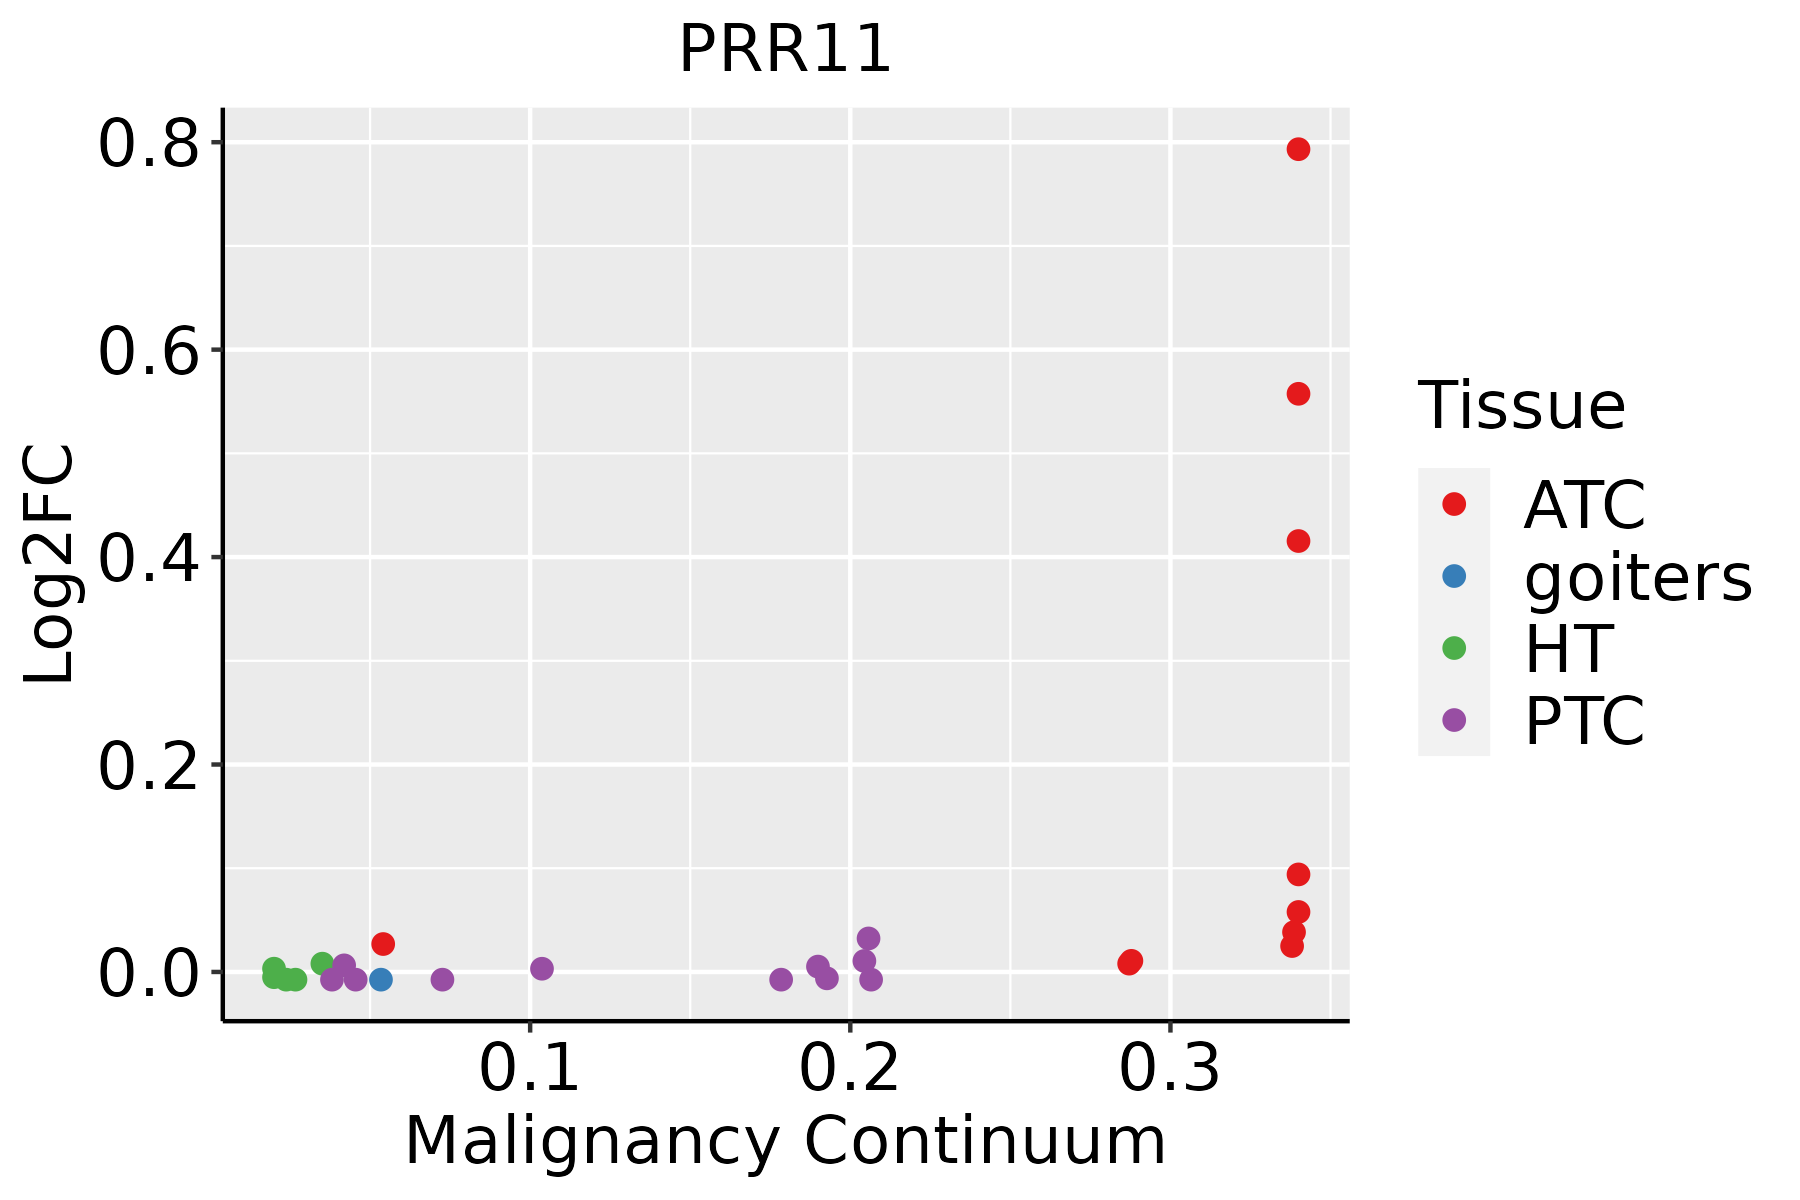 | ATC: Anaplastic thyroid cancer |
| HT: Hashimoto's thyroiditis | ||
| PTC: Papillary thyroid cancer |
| ∗log2FC in expression of this searched gene in stem-like cells from each diseased tissue sample relative to stem-like cells in normal samples in each tissue plotted against the malignancy continuum. Samples are colored based on if they are from different disease stage. |
Top |
Malignant transformation related pathway analysis |
| Find out the enriched GO biological processes and KEGG pathways involved in transition from healthy to precancer to cancer |
| Tissue | Disease Stage | Enriched GO biological Processes |
| Colorectum | AD |  |
| Colorectum | SER |  |
| Colorectum | MSS |  |
| Colorectum | MSI-H |  |
| Colorectum | FAP |  |
| ∗Top 15 enriched GO BP terms are showed in the bar plot of each disease state in each tissue. Each row represents a significant GO biological process which is colored according to the -log10(p.adjust). |
| Page: 1 2 3 4 5 6 7 8 9 |
| GO ID | Tissue | Disease Stage | Description | Gene Ratio | Bg Ratio | pvalue | p.adjust | Count |
| Page: 1 |
| Pathway ID | Tissue | Disease Stage | Description | Gene Ratio | Bg Ratio | pvalue | p.adjust | qvalue | Count |
| Page: 1 |
Top |
Cell-cell communication analysis |
| Identification of potential cell-cell interactions between two cell types and their ligand-receptor pairs for different disease states |
| Ligand | Receptor | LRpair | Pathway | Tissue | Disease Stage |
| Page: 1 |
Top |
Single-cell gene regulatory network inference analysis |
| Find out the significant the regulons (TFs) and the target genes of each regulon across cell types for different disease states |
| TF | Cell Type | Tissue | Disease Stage | Target Gene | RSS | Regulon Activity |
| ∗The dot plots of a searched regulon are shown for all cell subpopulations in each disease state of each tissue based on the regulon specific score inferred using pySCENIC and by calculating the average expression. |
| Page: 1 |
Top |
Somatic mutation of malignant transformation related genes |
| Annotation of somatic variants for genes involved in malignant transformation |
| Hugo Symbol | Variant Class | Variant Classification | dbSNP RS | HGVSc | HGVSp | HGVSp Short | SWISSPROT | BIOTYPE | SIFT | PolyPhen | Tumor Sample Barcode | Tissue | Histology | Sex | Age | Stage | Therapy Types | Drugs | Outcome |
| PRR11 | SNV | Missense_Mutation | c.335T>C | p.Leu112Pro | p.L112P | Q96HE9 | protein_coding | deleterious(0) | probably_damaging(0.919) | TCGA-A7-A0D9-01 | Breast | breast invasive carcinoma | Female | <65 | I/II | Chemotherapy | taxotere | SD | |
| PRR11 | SNV | Missense_Mutation | c.193N>T | p.Asn65Tyr | p.N65Y | Q96HE9 | protein_coding | deleterious(0.02) | benign(0.037) | TCGA-AO-A0J4-01 | Breast | breast invasive carcinoma | Female | <65 | I/II | Chemotherapy | doxorubicin | SD | |
| PRR11 | deletion | Frame_Shift_Del | novel | c.1079delA | p.Asn360ThrfsTer18 | p.N360Tfs*18 | Q96HE9 | protein_coding | TCGA-EW-A2FV-01 | Breast | breast invasive carcinoma | Female | <65 | III/IV | Chemotherapy | docetaxel | SD | ||
| PRR11 | SNV | Missense_Mutation | novel | c.529N>G | p.Leu177Val | p.L177V | Q96HE9 | protein_coding | tolerated(0.48) | benign(0.007) | TCGA-DG-A2KK-01 | Cervix | cervical & endocervical cancer | Female | <65 | III/IV | Chemotherapy | cisplatin | SD |
| PRR11 | SNV | Missense_Mutation | c.419N>A | p.Ser140Tyr | p.S140Y | Q96HE9 | protein_coding | deleterious(0) | possibly_damaging(0.759) | TCGA-A6-6141-01 | Colorectum | colon adenocarcinoma | Male | <65 | I/II | Chemotherapy | 5-fu | SD | |
| PRR11 | SNV | Missense_Mutation | c.1004N>A | p.Arg335Lys | p.R335K | Q96HE9 | protein_coding | tolerated(0.14) | benign(0.019) | TCGA-AA-A02K-01 | Colorectum | colon adenocarcinoma | Male | <65 | III/IV | Chemotherapy | folinic | PD | |
| PRR11 | SNV | Missense_Mutation | rs368935442 | c.886N>T | p.Arg296Trp | p.R296W | Q96HE9 | protein_coding | deleterious(0.02) | probably_damaging(1) | TCGA-AG-3892-01 | Colorectum | rectum adenocarcinoma | Female | <65 | I/II | Unknown | Unknown | SD |
| PRR11 | SNV | Missense_Mutation | c.419N>A | p.Ser140Tyr | p.S140Y | Q96HE9 | protein_coding | deleterious(0) | possibly_damaging(0.759) | TCGA-F5-6814-01 | Colorectum | rectum adenocarcinoma | Male | <65 | I/II | Unknown | Unknown | SD | |
| PRR11 | SNV | Missense_Mutation | novel | c.755N>T | p.Ser252Leu | p.S252L | Q96HE9 | protein_coding | tolerated(0.07) | probably_damaging(0.923) | TCGA-A5-A0G2-01 | Endometrium | uterine corpus endometrioid carcinoma | Female | <65 | III/IV | Unknown | Unknown | SD |
| PRR11 | SNV | Missense_Mutation | c.915N>T | p.Glu305Asp | p.E305D | Q96HE9 | protein_coding | tolerated(0.17) | benign(0.027) | TCGA-A5-A0G2-01 | Endometrium | uterine corpus endometrioid carcinoma | Female | <65 | III/IV | Unknown | Unknown | SD |
| Page: 1 2 3 |
Top |
Related drugs of malignant transformation related genes |
| Identification of chemicals and drugs interact with genes involved in malignant transfromation |
| (DGIdb 4.0) |
| Entrez ID | Symbol | Category | Interaction Types | Drug Claim Name | Drug Name | PMIDs |
| Page: 1 |

Copyright 2023-Present -The University of Texas Health Science Center at Houston |